Mga Batayang Estadistika
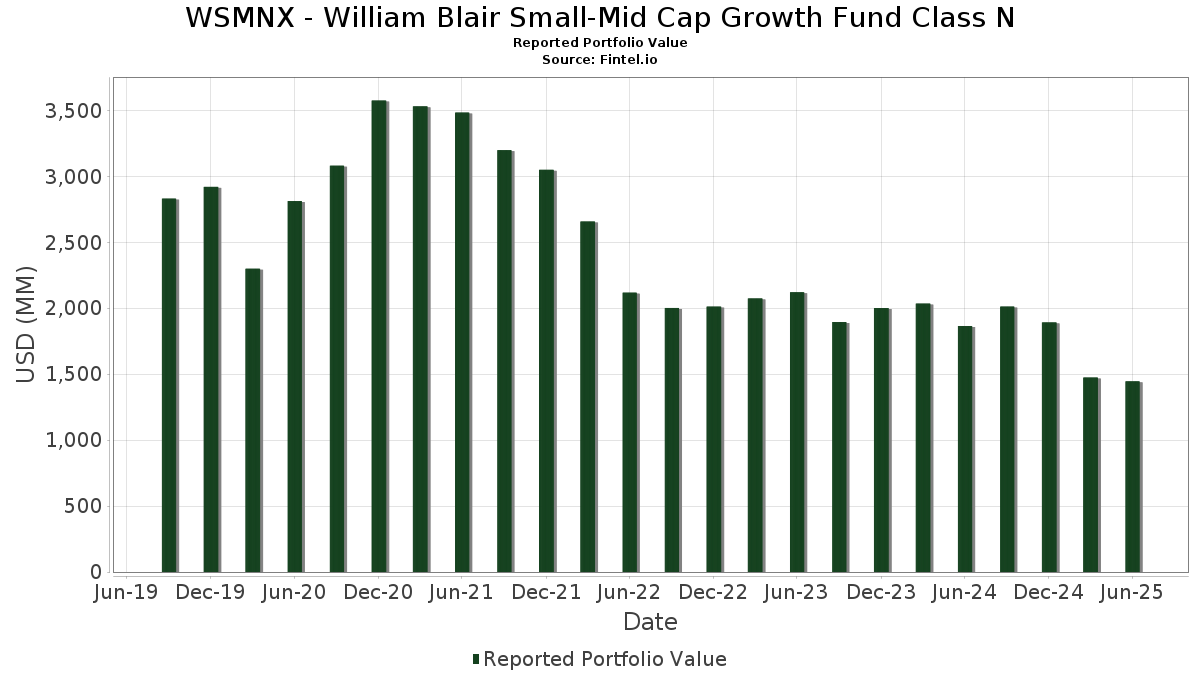
| Nilai Portofolio | $ 1,445,556,321 |
| Posisi Saat Ini | 76 |
Kepemilikan Terbaru, Kinerja, AUM (dari 13F, 13D)
WSMNX - William Blair Small-Mid Cap Growth Fund Class N telah mengungkapkan total kepemilikan 76 dalam pengajuan SEC terbaru mereka. Nilai portofolio terbaru dihitung sebesar $ 1,445,556,321 USD. Aset yang Dikelola (AUM) sebenarnya adalah nilai ini ditambah kas (yang tidak diungkapkan). Aset-aset utama WSMNX - William Blair Small-Mid Cap Growth Fund Class N adalah Talen Energy Corporation (US:TLN) , Pure Storage, Inc. (US:PSTG) , Cameco Corporation (US:CCJ) , Primo Brands Corporation (US:PRMB) , and Doximity, Inc. (US:DOCS) . Posisi baru WSMNX - William Blair Small-Mid Cap Growth Fund Class N meliputi: BellRing Brands, Inc. (US:BRBR) , Maplebear Inc. (US:CART) , Carpenter Technology Corporation (US:CRS) , Evercore Inc. (US:EVR) , and Clean Harbors, Inc. (US:CLH) .
Peningkatan Tertinggi Kuartal Ini
Kami menggunakan perubahan dalam alokasi portofolio karena ini adalah metrik yang paling bermakna. Perubahan dapat disebabkan oleh perdagangan atau perubahan harga saham.
| Keamanan | Saham (MM) |
Nilai (Juta Dolar AS) |
Portfolio % | ΔPorsyento ng Portfolio |
|---|---|---|---|---|
| 28.94 | 2.0032 | 2.0032 | ||
| 0.17 | 23.94 | 1.6568 | 1.6568 | |
| 0.64 | 36.83 | 2.5493 | 1.4608 | |
| 0.34 | 19.70 | 1.3638 | 1.3638 | |
| 0.48 | 35.35 | 2.4471 | 1.2798 | |
| 0.40 | 18.20 | 1.2598 | 1.2598 | |
| 0.06 | 16.33 | 1.1306 | 1.1306 | |
| 0.06 | 15.93 | 1.1028 | 1.1028 | |
| 0.06 | 14.89 | 1.0306 | 1.0306 | |
| 0.13 | 13.58 | 0.9397 | 0.9397 |
Penurunan Tertinggi Kuartal Ini
Kami menggunakan perubahan dalam alokasi portofolio karena ini adalah metrik yang paling bermakna. Perubahan dapat disebabkan oleh perdagangan atau perubahan harga saham.
| Keamanan | Saham (MM) |
Nilai (Juta Dolar AS) |
Portfolio % | ΔPorsyento ng Portfolio |
|---|---|---|---|---|
| 0.10 | 14.69 | 1.0171 | -1.4820 | |
| 0.00 | 0.00 | -1.4279 | ||
| 0.04 | 19.56 | 1.3538 | -1.0751 | |
| 1.18 | 34.98 | 2.4215 | -0.9661 | |
| 0.00 | 0.00 | -0.9572 | ||
| 0.17 | 21.35 | 1.4781 | -0.9193 | |
| 0.49 | 25.11 | 1.7380 | -0.5377 | |
| 1.46 | 7.00 | 0.4846 | -0.4533 | |
| 0.94 | 20.71 | 1.4339 | -0.4361 | |
| 0.16 | 18.89 | 1.3079 | -0.4361 |
Pengajuan 13F dan Dana
Formulir ini diajukan pada 2025-08-20 untuk periode pelaporan 2025-06-30. Klik ikon tautan untuk melihat riwayat transaksi selengkapnya.
Tingkatkan ke versi premium untuk membuka data premium dan ekspor ke Excel. ![]() .
.
| Keamanan | Ketik | Harga Saham Rata-rata | Saham (MM) |
ΔSaham (%) |
ΔSaham (%) |
Nilai ($MM) |
Portpolyo (%) |
ΔPortofolio (%) |
|
|---|---|---|---|---|---|---|---|---|---|
| TLN / Talen Energy Corporation | 0.15 | -8.08 | 44.63 | 33.86 | 3.0895 | 0.8266 | |||
| PSTG / Pure Storage, Inc. | 0.64 | 76.54 | 36.83 | 129.62 | 2.5493 | 1.4608 | |||
| CCJ / Cameco Corporation | 0.48 | 13.97 | 35.35 | 105.54 | 2.4471 | 1.2798 | |||
| PRMB / Primo Brands Corporation | 1.18 | -16.03 | 34.98 | -29.92 | 2.4215 | -0.9661 | |||
| DOCS / Doximity, Inc. | 0.57 | 13.37 | 34.70 | 19.83 | 2.4022 | 0.4368 | |||
| NVT / nVent Electric plc | 0.41 | 16.92 | 30.17 | 63.38 | 2.0885 | 0.8352 | |||
| FIXED INC CLEARING CORP.REPO / RA (000000000) | 28.94 | 2.0032 | 2.0032 | ||||||
| MRCY / Mercury Systems, Inc. | 0.54 | -8.12 | 28.87 | 14.84 | 1.9985 | 0.2923 | |||
| DT / Dynatrace, Inc. | 0.52 | -26.86 | 28.57 | -14.35 | 1.9776 | -0.2862 | |||
| CIEN / Ciena Corporation | 0.35 | 37.07 | 28.36 | 84.47 | 1.9631 | 0.9198 | |||
| MANH / Manhattan Associates, Inc. | 0.14 | -29.15 | 28.08 | -19.15 | 1.9437 | -0.4131 | |||
| EG / Everest Group, Ltd. | 0.08 | -8.12 | 27.30 | -14.06 | 1.8898 | -0.2661 | |||
| SN / SharkNinja, Inc. | 0.27 | -8.11 | 26.34 | 9.05 | 1.8233 | 0.1840 | |||
| PODD / Insulet Corporation | 0.08 | -8.13 | 26.25 | 9.90 | 1.8173 | 0.1962 | |||
| INSM / Insmed Incorporated | 0.26 | -8.11 | 26.23 | 21.22 | 1.8158 | 0.3472 | |||
| WAY / Waystar Holding Corp. | 0.64 | 25.11 | 26.00 | 36.87 | 1.7998 | 0.5106 | |||
| MLI / Mueller Industries, Inc. | 0.32 | -8.13 | 25.14 | -4.12 | 1.7399 | -0.0391 | |||
| CG / The Carlyle Group Inc. | 0.49 | -36.50 | 25.11 | -25.12 | 1.7380 | -0.5377 | |||
| PLNT / Planet Fitness, Inc. | 0.22 | -8.14 | 24.48 | 3.68 | 1.6946 | 0.0923 | |||
| BWXT / BWX Technologies, Inc. | 0.17 | 23.94 | 1.6568 | 1.6568 | |||||
| CFLT / Confluent, Inc. | 0.95 | -7.61 | 23.73 | -1.74 | 1.6423 | 0.0037 | |||
| APPF / AppFolio, Inc. | 0.09 | 33.52 | 21.65 | 39.83 | 1.4984 | 0.4478 | |||
| CW / Curtiss-Wright Corporation | 0.04 | -29.84 | 21.59 | 8.03 | 1.4947 | 0.1383 | |||
| POOL / Pool Corporation | 0.07 | 3.94 | 21.54 | -4.83 | 1.4910 | -0.0451 | |||
| BFAM / Bright Horizons Family Solutions Inc. | 0.17 | -37.87 | 21.35 | -39.56 | 1.4781 | -0.9193 | |||
| PSN / Parsons Corporation | 0.30 | 61.44 | 21.27 | 95.69 | 1.4725 | 0.7347 | |||
| QTWO / Q2 Holdings, Inc. | 0.23 | -8.09 | 21.26 | 7.51 | 1.4719 | 0.1296 | |||
| BWIN / The Baldwin Insurance Group, Inc. | 0.49 | -7.82 | 20.84 | -11.70 | 1.4428 | -0.1591 | |||
| CWAN / Clearwater Analytics Holdings, Inc. | 0.94 | -8.13 | 20.71 | -24.82 | 1.4339 | -0.4361 | |||
| BRBR / BellRing Brands, Inc. | 0.34 | 19.70 | 1.3638 | 1.3638 | |||||
| CHE / Chemed Corporation | 0.04 | -30.95 | 19.56 | -45.35 | 1.3538 | -1.0751 | |||
| CWST / Casella Waste Systems, Inc. | 0.16 | -28.94 | 18.89 | -26.48 | 1.3079 | -0.4361 | |||
| EPAM / EPAM Systems, Inc. | 0.11 | 17.02 | 18.73 | 22.55 | 1.2962 | 0.2592 | |||
| MZTI / The Marzetti Company | 0.11 | 8.22 | 18.66 | 6.84 | 1.2918 | 0.1063 | |||
| EHC / Encompass Health Corporation | 0.15 | -26.06 | 18.34 | -10.47 | 1.2692 | -0.1207 | |||
| CART / Maplebear Inc. | 0.40 | 18.20 | 1.2598 | 1.2598 | |||||
| TRU / TransUnion | 0.20 | -61.58 | 17.76 | -59.81 | 1.2292 | -0.2071 | |||
| GWRE / Guidewire Software, Inc. | 0.07 | -22.45 | 17.65 | -2.55 | 1.2216 | -0.0074 | |||
| EXLS / ExlService Holdings, Inc. | 0.40 | -20.78 | 17.61 | -26.52 | 1.2191 | -0.4075 | |||
| FTAI / FTAI Aviation Ltd. | 0.15 | -18.43 | 17.42 | -15.48 | 1.2056 | -0.1929 | |||
| GMED / Globus Medical, Inc. | 0.29 | -7.83 | 16.96 | -25.68 | 1.1741 | -0.3748 | |||
| EXP / Eagle Materials Inc. | 0.08 | 55.59 | 16.79 | 41.69 | 1.1624 | 0.3581 | |||
| TWST / Twist Bioscience Corporation | 0.45 | -8.14 | 16.57 | -13.92 | 1.1472 | -0.1593 | |||
| WCPRF / Whitecap Resources Inc. | 2.44 | -8.13 | 16.41 | -4.28 | 1.1361 | -0.0275 | |||
| CRS / Carpenter Technology Corporation | 0.06 | 16.33 | 1.1306 | 1.1306 | |||||
| GKOS / Glaukos Corporation | 0.15 | 24.32 | 16.00 | 30.47 | 1.1075 | 0.2753 | |||
| EVR / Evercore Inc. | 0.06 | 15.93 | 1.1028 | 1.1028 | |||||
| ACVA / ACV Auctions Inc. | 0.97 | -8.13 | 15.66 | 5.76 | 1.0837 | 0.0791 | |||
| WAL / Western Alliance Bancorporation | 0.20 | -8.12 | 15.61 | -6.75 | 1.0805 | -0.0555 | |||
| CHDN / Churchill Downs Incorporated | 0.15 | -8.11 | 15.10 | -16.45 | 1.0452 | -0.1812 | |||
| WMS / Advanced Drainage Systems, Inc. | 0.13 | -8.16 | 15.00 | -2.91 | 1.0384 | -0.0102 | |||
| CLH / Clean Harbors, Inc. | 0.06 | 14.89 | 1.0306 | 1.0306 | |||||
| BCO / The Brink's Company | 0.16 | -29.80 | 14.73 | -27.25 | 1.0194 | -0.3543 | |||
| LRN / Stride, Inc. | 0.10 | -65.24 | 14.69 | -60.10 | 1.0171 | -1.4820 | |||
| NICE / NICE Ltd. - Depositary Receipt (Common Stock) | 0.09 | -8.12 | 14.52 | 0.66 | 1.0051 | 0.0262 | |||
| TPG / TPG Inc. | 0.27 | -8.12 | 14.29 | 1.60 | 0.9894 | 0.0347 | |||
| WGS / GeneDx Holdings Corp. | 0.15 | 65.01 | 13.96 | 71.99 | 0.9666 | 0.4156 | |||
| WSC / WillScot Holdings Corporation | 0.50 | -8.11 | 13.78 | -9.43 | 0.9538 | -0.0787 | |||
| ONTO / Onto Innovation Inc. | 0.13 | 13.58 | 0.9397 | 0.9397 | |||||
| NOVT / Novanta Inc. | 0.10 | -8.09 | 13.04 | -7.33 | 0.9028 | -0.0523 | |||
| MDGL / Madrigal Pharmaceuticals, Inc. | 0.04 | -8.16 | 12.26 | -16.10 | 0.8484 | -0.1429 | |||
| EXAS / Exact Sciences Corporation | 0.23 | -17.52 | 12.15 | 1.24 | 0.8411 | 0.0266 | |||
| BURL / Burlington Stores, Inc. | 0.05 | -8.12 | 11.58 | -10.32 | 0.8013 | -0.0747 | |||
| INSP / Inspire Medical Systems, Inc. | 0.09 | 7.33 | 11.40 | -12.55 | 0.7891 | -0.0956 | |||
| FRPT / Freshpet, Inc. | 0.17 | 22.15 | 11.35 | -0.18 | 0.7860 | 0.0140 | |||
| RS / Reliance, Inc. | 0.04 | 11.33 | 0.7844 | 0.7844 | |||||
| PCTY / Paylocity Holding Corporation | 0.06 | -32.25 | 10.96 | -34.48 | 0.7588 | -0.3765 | |||
| LPX / Louisiana-Pacific Corporation | 0.12 | -8.07 | 10.18 | -14.06 | 0.7047 | -0.0992 | |||
| FOLD / Amicus Therapeutics, Inc. | 1.73 | -8.12 | 9.89 | -35.48 | 0.6845 | -0.3557 | |||
| FHN / First Horizon Corporation | 0.44 | 9.35 | 0.6472 | 0.6472 | |||||
| TECH / Bio-Techne Corporation | 0.15 | -8.10 | 7.83 | -19.35 | 0.5417 | -0.1168 | |||
| FSV / FirstService Corporation | 0.04 | -8.12 | 7.71 | -3.32 | 0.5335 | -0.0075 | |||
| EVH / Evolent Health, Inc. | 0.68 | -8.12 | 7.62 | 9.25 | 0.5272 | 0.0541 | |||
| EYE / National Vision Holdings, Inc. | 0.33 | -65.97 | 7.54 | -40.20 | 0.5220 | -0.1544 | |||
| NEOG / Neogen Corporation | 1.46 | -8.12 | 7.00 | -49.35 | 0.4846 | -0.4533 | |||
| FOXF / Fox Factory Holding Corp. | 0.26 | -8.12 | 6.81 | 2.12 | 0.4712 | 0.0188 | |||
| US003CVR0169 / CONTRA ABIOMED INC | 0.08 | 0.00 | 0.00 | 0.0000 | 0.0000 | ||||
| NFE / New Fortress Energy Inc. | 0.00 | -100.00 | 0.00 | -100.00 | -0.9572 | ||||
| CGNX / Cognex Corporation | 0.00 | -100.00 | 0.00 | -100.00 | -1.4279 |