Mga Batayang Estadistika
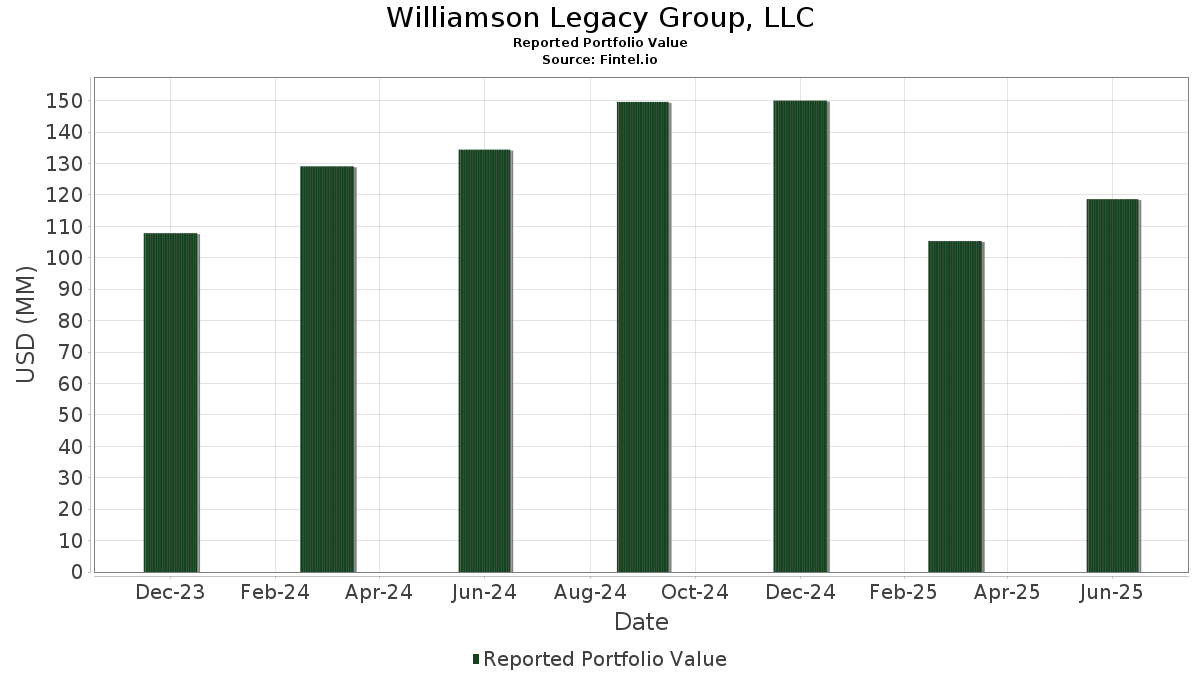
| Nilai Portofolio | $ 118,671,499 |
| Posisi Saat Ini | 104 |
Kepemilikan Terbaru, Kinerja, AUM (dari 13F, 13D)
Williamson Legacy Group, LLC telah mengungkapkan total kepemilikan 104 dalam pengajuan SEC terbaru mereka. Nilai portofolio terbaru dihitung sebesar $ 118,671,499 USD. Aset yang Dikelola (AUM) sebenarnya adalah nilai ini ditambah kas (yang tidak diungkapkan). Aset-aset utama Williamson Legacy Group, LLC adalah Palantir Technologies Inc. (US:PLTR) , Spotify Technology S.A. (US:SPOT) , Robinhood Markets, Inc. (US:HOOD) , Amazon.com, Inc. (US:AMZN) , and eBay Inc. (US:EBAY) . Posisi baru Williamson Legacy Group, LLC meliputi: Howmet Aerospace Inc. (US:HWM) , Sportradar Group AG (US:SRAD) , DoorDash, Inc. (US:DASH) , Chewy, Inc. (US:CHWY) , and Wheaton Precious Metals Corp. (MX:WPM N) .
Peningkatan Tertinggi Kuartal Ini
Kami menggunakan perubahan dalam alokasi portofolio karena ini adalah metrik yang paling bermakna. Perubahan dapat disebabkan oleh perdagangan atau perubahan harga saham.
| Keamanan | Saham (MM) |
Nilai (Juta Dolar AS) |
Portfolio % | ΔPorsyento ng Portfolio |
|---|---|---|---|---|
| 0.03 | 2.39 | 2.0159 | 1.6527 | |
| 0.01 | 1.38 | 1.1654 | 1.1654 | |
| 0.05 | 1.30 | 1.0959 | 1.0959 | |
| 0.01 | 1.26 | 1.0648 | 1.0648 | |
| 0.01 | 1.20 | 1.0134 | 1.0134 | |
| 0.03 | 1.20 | 1.0074 | 1.0074 | |
| 0.01 | 1.19 | 1.0016 | 1.0016 | |
| 0.01 | 1.17 | 0.9861 | 0.9861 | |
| 0.00 | 1.11 | 0.9347 | 0.9347 | |
| 0.02 | 1.10 | 0.9252 | 0.9252 |
Penurunan Tertinggi Kuartal Ini
Kami menggunakan perubahan dalam alokasi portofolio karena ini adalah metrik yang paling bermakna. Perubahan dapat disebabkan oleh perdagangan atau perubahan harga saham.
| Keamanan | Saham (MM) |
Nilai (Juta Dolar AS) |
Portfolio % | ΔPorsyento ng Portfolio |
|---|---|---|---|---|
| 0.00 | 1.48 | 1.2508 | -0.9663 | |
| 0.00 | 2.22 | 1.8684 | -0.7189 | |
| 0.01 | 2.23 | 1.8792 | -0.5405 | |
| 0.01 | 1.75 | 1.4764 | -0.2926 | |
| 0.00 | 1.68 | 1.4154 | -0.2495 | |
| 0.01 | 2.13 | 1.7942 | -0.1633 | |
| 0.06 | 1.52 | 1.2808 | -0.1619 | |
| 0.00 | 1.10 | 0.9236 | -0.1604 | |
| 0.00 | 0.41 | 0.3446 | -0.1575 | |
| 0.04 | 0.94 | 0.7963 | -0.1548 |
Pengajuan 13F dan Dana
Formulir ini diajukan pada 2025-08-13 untuk periode pelaporan 2025-06-30. Klik ikon tautan untuk melihat riwayat transaksi selengkapnya.
Tingkatkan ke versi premium untuk membuka data premium dan ekspor ke Excel. ![]() .
.
| Keamanan | Ketik | Harga Saham Rata-rata | Saham (MM) |
ΔSaham (%) |
ΔSaham (%) |
Nilai ($MM) |
Portpolyo (%) |
ΔPortofolio (%) |
|
|---|---|---|---|---|---|---|---|---|---|
| PLTR / Palantir Technologies Inc. | 0.02 | 4.15 | 2.73 | 68.23 | 2.2981 | 0.7590 | |||
| SPOT / Spotify Technology S.A. | 0.00 | 0.32 | 2.41 | 39.97 | 2.0336 | 0.3964 | |||
| HOOD / Robinhood Markets, Inc. | 0.03 | 177.99 | 2.39 | 526.18 | 2.0159 | 1.6527 | |||
| AMZN / Amazon.com, Inc. | 0.01 | 0.60 | 2.37 | 15.98 | 2.0003 | 0.0575 | |||
| EBAY / eBay Inc. | 0.03 | -0.13 | 2.27 | 9.79 | 1.9102 | -0.0502 | |||
| NRG / NRG Energy, Inc. | 0.01 | -47.98 | 2.23 | -12.48 | 1.8792 | -0.5405 | |||
| META / Meta Platforms, Inc. | 0.00 | -36.46 | 2.22 | -18.64 | 1.8684 | -0.7189 | |||
| AVGO / Broadcom Inc. | 0.01 | 2.87 | 2.22 | 69.29 | 1.8681 | 0.6252 | |||
| EAT / Brinker International, Inc. | 0.01 | 1.32 | 2.14 | 22.59 | 1.8024 | 0.1458 | |||
| RSG / Republic Services, Inc. | 0.01 | 1.41 | 2.13 | 3.30 | 1.7942 | -0.1633 | |||
| AXON / Axon Enterprise, Inc. | 0.00 | 7.68 | 2.08 | 69.49 | 1.7519 | 0.5874 | |||
| DTM / DT Midstream, Inc. | 0.02 | 7.55 | 1.99 | 22.50 | 1.6802 | 0.1351 | |||
| LNG / Cheniere Energy, Inc. | 0.01 | 1.72 | 1.94 | 7.06 | 1.6359 | -0.0859 | |||
| NVDA / NVIDIA Corporation | 0.01 | 1.78 | 1.91 | 48.37 | 1.6105 | 0.3874 | |||
| WMT / Walmart Inc. | 0.02 | 12.74 | 1.79 | 25.61 | 1.5088 | 0.1550 | |||
| TXRH / Texas Roadhouse, Inc. | 0.01 | -2.06 | 1.78 | 10.14 | 1.5016 | -0.0343 | |||
| ALL / The Allstate Corporation | 0.01 | -3.28 | 1.75 | -5.96 | 1.4764 | -0.2926 | |||
| LLY / Eli Lilly and Company | 0.00 | 1.51 | 1.68 | -4.22 | 1.4154 | -0.2495 | |||
| GE / General Electric Company | 0.01 | 0.95 | 1.64 | 29.80 | 1.3844 | 0.1829 | |||
| FTI / TechnipFMC plc | 0.05 | 1.42 | 1.61 | 10.27 | 1.3576 | -0.0301 | |||
| APP / AppLovin Corporation | 0.00 | 1.24 | 1.59 | 33.84 | 1.3434 | 0.2119 | |||
| WMB / The Williams Companies, Inc. | 0.03 | 37.85 | 1.59 | 44.86 | 1.3423 | 0.2985 | |||
| NTRA / Natera, Inc. | 0.01 | 2.54 | 1.58 | 22.45 | 1.3338 | 0.1070 | |||
| FTAI / FTAI Aviation Ltd. | 0.01 | 1.25 | 1.56 | 4.91 | 1.3142 | -0.0973 | |||
| PODD / Insulet Corporation | 0.00 | -0.49 | 1.53 | 19.05 | 1.2851 | 0.0689 | |||
| AGI / Alamos Gold Inc. | 0.06 | 0.70 | 1.52 | 0.00 | 1.2808 | -0.1619 | |||
| WELL / Welltower Inc. | 0.01 | 15.22 | 1.52 | 15.60 | 1.2806 | 0.0326 | |||
| SAP / SAP SE - Depositary Receipt (Common Stock) | 0.00 | -43.89 | 1.48 | -36.45 | 1.2508 | -0.9663 | |||
| SFM / Sprouts Farmers Market, Inc. | 0.01 | 15.69 | 1.47 | 24.74 | 1.2367 | 0.1201 | |||
| HIG / The Hartford Insurance Group, Inc. | 0.01 | 2.17 | 1.38 | 4.77 | 1.1660 | -0.0879 | |||
| HWM / Howmet Aerospace Inc. | 0.01 | 1.38 | 1.1654 | 1.1654 | |||||
| T / AT&T Inc. | 0.05 | 368.94 | 1.38 | 380.14 | 1.1619 | 0.8891 | |||
| NFLX / Netflix, Inc. | 0.00 | 0.80 | 1.35 | 44.78 | 1.1341 | 0.2514 | |||
| CM / Canadian Imperial Bank of Commerce | 0.02 | 357.25 | 1.34 | 476.29 | 1.1269 | 0.9061 | |||
| SRAD / Sportradar Group AG | 0.05 | 1.30 | 1.0959 | 1.0959 | |||||
| GWRE / Guidewire Software, Inc. | 0.01 | 1.95 | 1.29 | 28.20 | 1.0883 | 0.1312 | |||
| CASY / Casey's General Stores, Inc. | 0.00 | 4.94 | 1.28 | 23.36 | 1.0771 | 0.0935 | |||
| COST / Costco Wholesale Corporation | 0.00 | 5.42 | 1.27 | 10.43 | 1.0711 | -0.0226 | |||
| DASH / DoorDash, Inc. | 0.01 | 1.26 | 1.0648 | 1.0648 | |||||
| BSX / Boston Scientific Corporation | 0.01 | 1.06 | 1.26 | 7.67 | 1.0644 | -0.0502 | |||
| GFL / GFL Environmental Inc. | 0.02 | 2.13 | 1.25 | 6.72 | 1.0567 | -0.0594 | |||
| CYBR / CyberArk Software Ltd. | 0.00 | 7.79 | 1.22 | 29.76 | 1.0293 | 0.1355 | |||
| CTAS / Cintas Corporation | 0.01 | 5.82 | 1.21 | 14.75 | 1.0170 | 0.0185 | |||
| BWXT / BWX Technologies, Inc. | 0.01 | 1.20 | 1.0134 | 1.0134 | |||||
| NI / NiSource Inc. | 0.03 | 138.73 | 1.20 | 140.08 | 1.0103 | 0.5364 | |||
| CHWY / Chewy, Inc. | 0.03 | 1.20 | 1.0074 | 1.0074 | |||||
| AEM / Agnico Eagle Mines Limited | 0.01 | 2.13 | 1.19 | 12.04 | 1.0042 | -0.0056 | |||
| WPM N / Wheaton Precious Metals Corp. | 0.01 | 1.19 | 1.0016 | 1.0016 | |||||
| EHC / Encompass Health Corporation | 0.01 | 1.17 | 0.9861 | 0.9861 | |||||
| WRB / W. R. Berkley Corporation | 0.02 | 2.60 | 1.16 | 6.01 | 0.9809 | -0.0624 | |||
| TJX / The TJX Companies, Inc. | 0.01 | 126.08 | 1.15 | 129.14 | 0.9679 | 0.4921 | |||
| GDDY / GoDaddy Inc. | 0.01 | 0.75 | 1.11 | 0.72 | 0.9388 | -0.1115 | |||
| MSTR / Strategy Inc | 0.00 | 1.11 | 0.9347 | 0.9347 | |||||
| MO / Altria Group, Inc. | 0.02 | 1.10 | 0.9252 | 0.9252 | |||||
| PGR / The Progressive Corporation | 0.00 | 1.81 | 1.10 | -4.03 | 0.9236 | -0.1604 | |||
| CCEP N / Coca-Cola Europacific Partners PLC | 0.01 | 1.07 | 0.9049 | 0.9049 | |||||
| MPLX / MPLX LP - Limited Partnership | 0.02 | 28.06 | 1.06 | 23.22 | 0.8903 | 0.0765 | |||
| IBM / International Business Machines Corporation | 0.00 | 1.05 | 0.8868 | 0.8868 | |||||
| MFC / Manulife Financial Corporation | 0.03 | 130.61 | 1.04 | 136.67 | 0.8759 | 0.4588 | |||
| TW / Tradeweb Markets Inc. | 0.01 | 1.00 | 0.8422 | 0.8422 | |||||
| TRV / The Travelers Companies, Inc. | 0.00 | 0.98 | 0.8294 | 0.8294 | |||||
| AJG / Arthur J. Gallagher & Co. | 0.00 | 9.30 | 0.96 | 1.38 | 0.8052 | -0.0900 | |||
| SLM / SLM Corporation | 0.03 | 0.95 | 0.7980 | 0.7980 | |||||
| MWA / Mueller Water Products, Inc. | 0.04 | -0.25 | 0.94 | -5.69 | 0.7963 | -0.1548 | |||
| XEL / Xcel Energy Inc. | 0.01 | 0.94 | 0.7923 | 0.7923 | |||||
| SSNC / SS&C Technologies Holdings, Inc. | 0.01 | -2.81 | 0.94 | -3.60 | 0.7896 | -0.1338 | |||
| UNM / Unum Group | 0.01 | 0.93 | 0.7845 | 0.7845 | |||||
| CVNA / Carvana Co. | 0.00 | 0.92 | 0.7760 | 0.7760 | |||||
| BRO / Brown & Brown, Inc. | 0.01 | 0.92 | 0.7751 | 0.7751 | |||||
| FOXA / Fox Corporation | 0.02 | -1.12 | 0.89 | -2.08 | 0.7531 | -0.1136 | |||
| BJ / BJ's Wholesale Club Holdings, Inc. | 0.01 | 0.89 | 0.7485 | 0.7485 | |||||
| ATO / Atmos Energy Corporation | 0.01 | 183.38 | 0.87 | 182.41 | 0.7309 | 0.4394 | |||
| PNW / Pinnacle West Capital Corporation | 0.01 | 0.85 | 0.7201 | 0.7201 | |||||
| AROC / Archrock, Inc. | 0.03 | 0.23 | 0.85 | -5.16 | 0.7128 | -0.1340 | |||
| TRI N / Thomson Reuters Corporation | 0.00 | 0.80 | 0.6720 | 0.6720 | |||||
| MSI / Motorola Solutions, Inc. | 0.00 | -5.16 | 0.77 | -8.96 | 0.6512 | -0.1544 | |||
| BAP / Credicorp Ltd. | 0.00 | 0.75 | 0.6344 | 0.6344 | |||||
| BK / The Bank of New York Mellon Corporation | 0.01 | 122.29 | 0.69 | 141.81 | 0.5849 | 0.3120 | |||
| ULS / UL Solutions Inc. | 0.01 | 0.65 | 0.5473 | 0.5473 | |||||
| RACE / Ferrari N.V. | 0.00 | -0.15 | 0.64 | 14.41 | 0.5426 | 0.0088 | |||
| RBLX / Roblox Corporation | 0.01 | 0.63 | 0.5270 | 0.5270 | |||||
| CAH / Cardinal Health, Inc. | 0.00 | 0.61 | 0.5111 | 0.5111 | |||||
| AFL / Aflac Incorporated | 0.01 | 21.13 | 0.61 | 15.02 | 0.5099 | 0.0099 | |||
| TTWO / Take-Two Interactive Software, Inc. | 0.00 | 0.56 | 0.4701 | 0.4701 | |||||
| GEV / GE Vernova Inc. | 0.00 | 0.55 | 0.4624 | 0.4624 | |||||
| PG / The Procter & Gamble Company | 0.00 | -1.32 | 0.55 | -7.61 | 0.4601 | -0.1018 | |||
| RTX / RTX Corporation | 0.00 | 13.94 | 0.54 | 25.52 | 0.4565 | 0.0470 | |||
| MSFT / Microsoft Corporation | 0.00 | -4.93 | 0.48 | 25.98 | 0.4045 | 0.0427 | |||
| ABBV / AbbVie Inc. | 0.00 | -12.72 | 0.41 | -22.73 | 0.3446 | -0.1575 | |||
| TRP N / TC Energy Corporation | 0.01 | 0.40 | 0.3354 | 0.3354 | |||||
| PM / Philip Morris International Inc. | 0.00 | 0.35 | 0.2951 | 0.2951 | |||||
| USFD / US Foods Holding Corp. | 0.00 | 0.35 | 0.2907 | 0.2907 | |||||
| COF / Capital One Financial Corporation | 0.00 | 0.32 | 0.2725 | 0.2725 | |||||
| APH / Amphenol Corporation | 0.00 | 0.32 | 0.2661 | 0.2661 | |||||
| SRE / Sempra | 0.00 | -1.66 | 0.28 | 4.43 | 0.2387 | -0.0189 | |||
| VUG / Vanguard Index Funds - Vanguard Growth ETF | 0.00 | -3.48 | 0.28 | 14.34 | 0.2353 | 0.0030 | |||
| TKO / TKO Group Holdings, Inc. | 0.00 | 0.27 | 0.2275 | 0.2275 | |||||
| ICE / Intercontinental Exchange, Inc. | 0.00 | 0.27 | 0.2264 | 0.2264 | |||||
| FTNT / Fortinet, Inc. | 0.00 | 0.26 | 0.2178 | 0.2178 | |||||
| WAB / Westinghouse Air Brake Technologies Corporation | 0.00 | 0.23 | 0.1964 | 0.1964 | |||||
| RSPT / Invesco Exchange-Traded Fund Trust - Invesco S&P 500 Equal Weight Technology ETF | 0.01 | -4.34 | 0.23 | 13.79 | 0.1953 | 0.0024 | |||
| VTI / Vanguard Index Funds - Vanguard Total Stock Market ETF | 0.00 | 0.00 | 0.23 | 10.68 | 0.1926 | -0.0036 | |||
| TWLO / Twilio Inc. | 0.00 | 0.21 | 0.1769 | 0.1769 | |||||
| VEA / Vanguard Tax-Managed Funds - Vanguard FTSE Developed Markets ETF | 0.00 | -33.72 | 0.20 | -25.56 | 0.1695 | -0.0874 | |||
| TYL / Tyler Technologies, Inc. | 0.00 | -100.00 | 0.00 | 0.0000 | |||||
| MMSI / Merit Medical Systems, Inc. | 0.00 | -100.00 | 0.00 | 0.0000 | |||||
| AAPL / Apple Inc. | 0.00 | -100.00 | 0.00 | 0.0000 | |||||
| HLI / Houlihan Lokey, Inc. | 0.00 | -100.00 | 0.00 | 0.0000 | |||||
| WTW / Willis Towers Watson Public Limited Company | 0.00 | -100.00 | 0.00 | 0.0000 | |||||
| FLS / Flowserve Corporation | 0.00 | -100.00 | 0.00 | 0.0000 | |||||
| CMI / Cummins Inc. | 0.00 | -100.00 | 0.00 | 0.0000 | |||||
| IBKR / Interactive Brokers Group, Inc. | 0.00 | -100.00 | 0.00 | 0.0000 | |||||
| GLW / Corning Incorporated | 0.00 | -100.00 | 0.00 | 0.0000 | |||||
| PEG / Public Service Enterprise Group Incorporated | 0.00 | -100.00 | 0.00 | 0.0000 | |||||
| JXN / Jackson Financial Inc. | 0.00 | -100.00 | 0.00 | 0.0000 | |||||
| UPS / United Parcel Service, Inc. | 0.00 | -100.00 | 0.00 | 0.0000 | |||||
| SN / SharkNinja, Inc. | 0.00 | -100.00 | 0.00 | 0.0000 | |||||
| OKE / ONEOK, Inc. | 0.00 | -100.00 | 0.00 | 0.0000 | |||||
| VMI / Valmont Industries, Inc. | 0.00 | -100.00 | 0.00 | 0.0000 | |||||
| ISRG / Intuitive Surgical, Inc. | 0.00 | -100.00 | 0.00 | 0.0000 | |||||
| TRGP / Targa Resources Corp. | 0.00 | -100.00 | 0.00 | 0.0000 | |||||
| JPM / JPMorgan Chase & Co. | 0.00 | -100.00 | 0.00 | 0.0000 | |||||
| FI / Fiserv, Inc. | 0.00 | -100.00 | 0.00 | 0.0000 | |||||
| CW / Curtiss-Wright Corporation | 0.00 | -100.00 | 0.00 | 0.0000 | |||||
| FN / Fabrinet | 0.00 | -100.00 | 0.00 | 0.0000 | |||||
| TRU / TransUnion | 0.00 | -100.00 | 0.00 | 0.0000 | |||||
| ALSN / Allison Transmission Holdings, Inc. | 0.00 | -100.00 | 0.00 | 0.0000 | |||||
| CRBG / Corebridge Financial, Inc. | 0.00 | -100.00 | 0.00 | 0.0000 | |||||
| APO / Apollo Global Management, Inc. | 0.00 | -100.00 | 0.00 | 0.0000 | |||||
| GRMN / Garmin Ltd. | 0.00 | -100.00 | 0.00 | 0.0000 | |||||
| BLK / BlackRock, Inc. | 0.00 | -100.00 | 0.00 | 0.0000 | |||||
| NEE / NextEra Energy, Inc. | 0.00 | -100.00 | 0.00 | 0.0000 | |||||
| AER / AerCap Holdings N.V. | 0.00 | -100.00 | 0.00 | 0.0000 | |||||
| MET / MetLife, Inc. | 0.00 | -100.00 | 0.00 | 0.0000 | |||||
| FLEX / Flex Ltd. | 0.00 | -100.00 | 0.00 | 0.0000 | |||||
| AIT / Applied Industrial Technologies, Inc. | 0.00 | -100.00 | 0.00 | 0.0000 | |||||
| SPGI / S&P Global Inc. | 0.00 | -100.00 | 0.00 | 0.0000 | |||||
| BPOP / Popular, Inc. | 0.00 | -100.00 | 0.00 | 0.0000 | |||||
| SHW / The Sherwin-Williams Company | 0.00 | -100.00 | 0.00 | 0.0000 |