Mga Batayang Estadistika
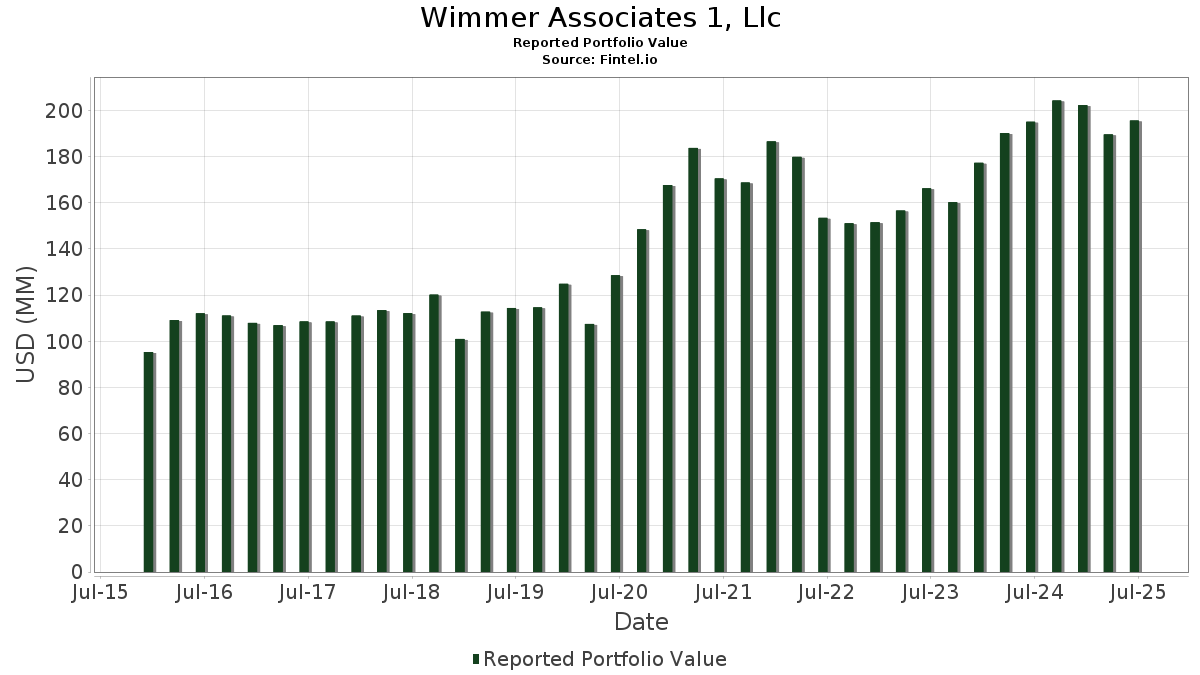
| Nilai Portofolio | $ 195,605,788 |
| Posisi Saat Ini | 109 |
Kepemilikan Terbaru, Kinerja, AUM (dari 13F, 13D)
Wimmer Associates 1, Llc telah mengungkapkan total kepemilikan 109 dalam pengajuan SEC terbaru mereka. Nilai portofolio terbaru dihitung sebesar $ 195,605,788 USD. Aset yang Dikelola (AUM) sebenarnya adalah nilai ini ditambah kas (yang tidak diungkapkan). Aset-aset utama Wimmer Associates 1, Llc adalah Microsoft Corporation (US:MSFT) , Apple Inc. (US:AAPL) , NVIDIA Corporation (US:NVDA) , Vanguard Specialized Funds - Vanguard Dividend Appreciation ETF (US:VIG) , and Invesco Exchange-Traded Fund Trust - Invesco RAFI US 1000 ETF (US:PRF) . Posisi baru Wimmer Associates 1, Llc meliputi: iShares Trust - iShares Russell 1000 ETF (US:IWB) , Willdan Group, Inc. (US:WLDN) , .
Peningkatan Tertinggi Kuartal Ini
Kami menggunakan perubahan dalam alokasi portofolio karena ini adalah metrik yang paling bermakna. Perubahan dapat disebabkan oleh perdagangan atau perubahan harga saham.
| Keamanan | Saham (MM) |
Nilai (Juta Dolar AS) |
Portfolio % | ΔPorsyento ng Portfolio |
|---|---|---|---|---|
| 0.07 | 10.48 | 5.3591 | 0.8020 | |
| 0.03 | 12.78 | 6.5315 | 0.4153 | |
| 0.04 | 6.58 | 3.3660 | 0.2031 | |
| 0.03 | 4.64 | 2.3735 | 0.1412 | |
| 0.05 | 3.23 | 1.6537 | 0.1380 | |
| 0.00 | 0.21 | 0.1095 | 0.1095 | |
| 0.00 | 0.21 | 0.1049 | 0.1049 | |
| 0.00 | 0.20 | 0.1039 | 0.1039 | |
| 0.01 | 1.17 | 0.5969 | 0.0765 | |
| 0.00 | 0.69 | 0.3511 | 0.0648 |
Penurunan Tertinggi Kuartal Ini
Kami menggunakan perubahan dalam alokasi portofolio karena ini adalah metrik yang paling bermakna. Perubahan dapat disebabkan oleh perdagangan atau perubahan harga saham.
| Keamanan | Saham (MM) |
Nilai (Juta Dolar AS) |
Portfolio % | ΔPorsyento ng Portfolio |
|---|---|---|---|---|
| 0.01 | 3.44 | 1.7565 | -0.5769 | |
| 0.06 | 11.68 | 5.9704 | -0.4337 | |
| 0.01 | 6.69 | 3.4181 | -0.1957 | |
| 0.02 | 6.93 | 3.5437 | -0.1688 | |
| 0.01 | 3.80 | 1.9403 | -0.1638 | |
| 0.01 | 2.11 | 1.0768 | -0.1061 | |
| 0.01 | 2.51 | 1.2819 | -0.1039 | |
| 0.00 | 0.37 | 0.1910 | -0.0676 | |
| 0.00 | 1.46 | 0.7452 | -0.0640 | |
| 0.02 | 2.38 | 1.2152 | -0.0516 |
Pengajuan 13F dan Dana
Formulir ini diajukan pada 2025-08-14 untuk periode pelaporan 2025-06-30. Klik ikon tautan untuk melihat riwayat transaksi selengkapnya.
Tingkatkan ke versi premium untuk membuka data premium dan ekspor ke Excel. ![]() .
.
| Keamanan | Ketik | Harga Saham Rata-rata | Saham (MM) |
ΔSaham (%) |
ΔSaham (%) |
Nilai ($MM) |
Portpolyo (%) |
ΔPortofolio (%) |
|
|---|---|---|---|---|---|---|---|---|---|
| MSFT / Microsoft Corporation | 0.03 | -0.51 | 12.78 | 10.18 | 6.5315 | 0.4153 | |||
| AAPL / Apple Inc. | 0.06 | -0.18 | 11.68 | -3.81 | 5.9704 | -0.4337 | |||
| NVDA / NVIDIA Corporation | 0.07 | -0.22 | 10.48 | 21.33 | 5.3591 | 0.8020 | |||
| VIG / Vanguard Specialized Funds - Vanguard Dividend Appreciation ETF | 0.05 | -0.81 | 9.63 | 3.31 | 4.9251 | 0.0068 | |||
| PRF / Invesco Exchange-Traded Fund Trust - Invesco RAFI US 1000 ETF | 0.17 | -0.85 | 7.14 | 2.85 | 3.6507 | -0.0116 | |||
| V / Visa Inc. | 0.02 | -1.21 | 6.93 | -1.52 | 3.5437 | -0.1688 | |||
| COST / Costco Wholesale Corporation | 0.01 | -1.52 | 6.69 | -2.41 | 3.4181 | -0.1957 | |||
| GOOGL / Alphabet Inc. | 0.04 | -0.60 | 6.58 | 9.81 | 3.3660 | 0.2031 | |||
| VTI / Vanguard Index Funds - Vanguard Total Stock Market ETF | 0.02 | -2.10 | 6.08 | 2.87 | 3.1107 | -0.0090 | |||
| AMZN / Amazon.com, Inc. | 0.03 | -0.33 | 5.97 | 3.45 | 3.0515 | 0.0082 | |||
| MOAT / VanEck ETF Trust - VanEck Morningstar Wide Moat ETF | 0.06 | -1.68 | 5.94 | 1.47 | 3.0365 | -0.0512 | |||
| SPY / SPDR S&P 500 ETF | 0.01 | 0.23 | 5.47 | 5.53 | 2.7980 | 0.0623 | |||
| GOOG / Alphabet Inc. | 0.03 | -0.50 | 4.64 | 9.69 | 2.3735 | 0.1412 | |||
| BRK.B / Berkshire Hathaway Inc. | 0.01 | 0.26 | 3.80 | -4.86 | 1.9403 | -0.1638 | |||
| ADBE / Adobe Inc. | 0.01 | -20.22 | 3.44 | -22.34 | 1.7565 | -0.5769 | |||
| CSCO / Cisco Systems, Inc. | 0.05 | 0.24 | 3.23 | 12.57 | 1.6537 | 0.1380 | |||
| ABT / Abbott Laboratories | 0.02 | -3.18 | 3.07 | 2.06 | 1.5706 | -0.0174 | |||
| MMM / 3M Company | 0.02 | -0.11 | 2.77 | 0.91 | 1.4183 | -0.0322 | |||
| ABBV / AbbVie Inc. | 0.01 | -3.33 | 2.51 | -4.57 | 1.2819 | -0.1039 | |||
| VRTX / Vertex Pharmaceuticals Incorporated | 0.01 | -0.04 | 2.49 | 3.02 | 1.2727 | -0.0019 | |||
| BR / Broadridge Financial Solutions, Inc. | 0.01 | 0.09 | 2.46 | 2.50 | 1.2592 | -0.0083 | |||
| AMGN / Amgen Inc. | 0.01 | 0.52 | 2.38 | 3.79 | 1.2186 | 0.0070 | |||
| CVX / Chevron Corporation | 0.02 | -1.61 | 2.38 | -1.00 | 1.2152 | -0.0516 | |||
| LMT / Lockheed Martin Corporation | 0.01 | -0.31 | 2.35 | 0.43 | 1.1995 | -0.0331 | |||
| SBUX / Starbucks Corporation | 0.02 | -0.06 | 2.26 | 5.42 | 1.1542 | 0.0244 | |||
| MCD / McDonald's Corporation | 0.01 | -0.77 | 2.11 | -6.07 | 1.0768 | -0.1061 | |||
| PEP / PepsiCo, Inc. | 0.02 | 0.31 | 2.05 | 1.63 | 1.0493 | -0.0158 | |||
| IDXX / IDEXX Laboratories, Inc. | 0.00 | 0.00 | 1.97 | 5.35 | 1.0068 | 0.0207 | |||
| LLY / Eli Lilly and Company | 0.00 | 0.13 | 1.77 | 4.62 | 0.9042 | 0.0125 | |||
| BDX / Becton, Dickinson and Company | 0.01 | -0.28 | 1.61 | -2.07 | 0.8226 | -0.0437 | |||
| JNJ / Johnson & Johnson | 0.01 | -1.46 | 1.59 | 1.40 | 0.8143 | -0.0143 | |||
| QQQ / Invesco QQQ Trust, Series 1 | 0.00 | 0.00 | 1.58 | 7.00 | 0.8054 | 0.0287 | |||
| SYK / Stryker Corporation | 0.00 | 0.00 | 1.47 | 2.08 | 0.7516 | -0.0080 | |||
| PG / The Procter & Gamble Company | 0.01 | -0.26 | 1.47 | 0.14 | 0.7490 | -0.0229 | |||
| BRK.A / Berkshire Hathaway Inc. | 0.00 | 0.00 | 1.46 | -5.02 | 0.7452 | -0.0640 | |||
| WMT / Walmart Inc. | 0.01 | -0.76 | 1.43 | 1.21 | 0.7285 | -0.0142 | |||
| MMC / Marsh & McLennan Companies, Inc. | 0.01 | 0.81 | 1.36 | -1.45 | 0.6939 | -0.0329 | |||
| ADP / Automatic Data Processing, Inc. | 0.00 | 0.00 | 1.34 | 0.07 | 0.6836 | -0.0212 | |||
| VOO / Vanguard Index Funds - Vanguard S&P 500 ETF | 0.00 | 4.19 | 1.29 | 9.74 | 0.6572 | 0.0392 | |||
| DIS / The Walt Disney Company | 0.01 | -2.10 | 1.26 | 9.03 | 0.6424 | 0.0344 | |||
| LOW / Lowe's Companies, Inc. | 0.01 | 0.00 | 1.22 | -3.86 | 0.6235 | -0.0456 | |||
| NTRS / Northern Trust Corporation | 0.01 | 0.00 | 1.17 | 18.36 | 0.5969 | 0.0765 | |||
| VYM / Vanguard Whitehall Funds - Vanguard High Dividend Yield ETF | 0.01 | -3.15 | 1.16 | 0.52 | 0.5914 | -0.0152 | |||
| JPM / JPMorgan Chase & Co. | 0.00 | 0.00 | 1.14 | 10.29 | 0.5810 | 0.0372 | |||
| SYY / Sysco Corporation | 0.01 | 0.00 | 1.13 | 7.00 | 0.5784 | 0.0206 | |||
| PSX / Phillips 66 | 0.01 | -0.27 | 1.10 | -5.19 | 0.5599 | -0.0498 | |||
| VTV / Vanguard Index Funds - Vanguard Value ETF | 0.01 | -0.65 | 1.09 | 2.94 | 0.5553 | -0.0017 | |||
| IBM / International Business Machines Corporation | 0.00 | 0.00 | 1.08 | 14.00 | 0.5498 | 0.0522 | |||
| XOM / Exxon Mobil Corporation | 0.01 | -0.41 | 1.06 | -1.95 | 0.5409 | -0.0281 | |||
| GLD / SPDR Gold Trust | 0.00 | 1.47 | 1.05 | 3.33 | 0.5389 | 0.0006 | |||
| WFC / Wells Fargo & Company | 0.01 | 1.95 | 1.05 | 7.50 | 0.5351 | 0.0215 | |||
| MRK / Merck & Co., Inc. | 0.01 | -4.66 | 1.00 | -1.49 | 0.5088 | -0.0242 | |||
| TJX / The TJX Companies, Inc. | 0.01 | 0.00 | 0.94 | -5.55 | 0.4785 | -0.0445 | |||
| CAT / Caterpillar Inc. | 0.00 | 0.00 | 0.86 | 10.09 | 0.4410 | 0.0278 | |||
| BLK / BlackRock, Inc. | 0.00 | 0.00 | 0.85 | 9.41 | 0.4345 | 0.0247 | |||
| FDX / FedEx Corporation | 0.00 | 0.00 | 0.79 | -1.62 | 0.4024 | -0.0198 | |||
| IVV / iShares Trust - iShares Core S&P 500 ETF | 0.00 | 0.00 | 0.75 | 5.32 | 0.3845 | 0.0076 | |||
| IVW / iShares Trust - iShares S&P 500 Growth ETF | 0.01 | 0.00 | 0.69 | 7.44 | 0.3546 | 0.0142 | |||
| AMD / Advanced Micro Devices, Inc. | 0.00 | 0.27 | 0.69 | 26.57 | 0.3511 | 0.0648 | |||
| EMR / Emerson Electric Co. | 0.00 | -4.48 | 0.64 | 4.92 | 0.3272 | 0.0052 | |||
| TMO / Thermo Fisher Scientific Inc. | 0.00 | 0.00 | 0.63 | -5.52 | 0.3238 | -0.0296 | |||
| UNP / Union Pacific Corporation | 0.00 | 0.00 | 0.62 | 0.81 | 0.3170 | -0.0075 | |||
| BX / Blackstone Inc. | 0.00 | 0.00 | 0.62 | 0.65 | 0.3168 | -0.0079 | |||
| PAYX / Paychex, Inc. | 0.00 | 0.00 | 0.61 | -3.92 | 0.3134 | -0.0228 | |||
| RTX / RTX Corporation | 0.00 | 0.00 | 0.61 | 11.74 | 0.3117 | 0.0238 | |||
| NUE / Nucor Corporation | 0.00 | -4.92 | 0.59 | 3.52 | 0.3007 | 0.0010 | |||
| HD / The Home Depot, Inc. | 0.00 | 0.00 | 0.58 | -1.86 | 0.2973 | -0.0153 | |||
| VZ / Verizon Communications Inc. | 0.01 | 1.80 | 0.58 | 3.23 | 0.2945 | 0.0003 | |||
| EBAY / eBay Inc. | 0.01 | 0.00 | 0.57 | 7.82 | 0.2888 | 0.0120 | |||
| KMB / Kimberly-Clark Corporation | 0.00 | -0.68 | 0.56 | -4.57 | 0.2887 | -0.0231 | |||
| META / Meta Platforms, Inc. | 0.00 | 0.00 | 0.56 | 12.68 | 0.2864 | 0.0238 | |||
| KO / The Coca-Cola Company | 0.01 | -0.16 | 0.54 | 2.45 | 0.2782 | -0.0020 | |||
| VEA / Vanguard Tax-Managed Funds - Vanguard FTSE Developed Markets ETF | 0.01 | 8.21 | 0.53 | 14.13 | 0.2728 | 0.0263 | |||
| PLD / Prologis, Inc. | 0.00 | 0.00 | 0.50 | -4.19 | 0.2574 | -0.0197 | |||
| UPS / United Parcel Service, Inc. | 0.00 | 0.00 | 0.49 | 1.03 | 0.2519 | -0.0051 | |||
| AXP / American Express Company | 0.00 | 0.00 | 0.48 | 5.52 | 0.2446 | 0.0054 | |||
| VEU / Vanguard International Equity Index Funds - Vanguard FTSE All-World ex-US ETF | 0.01 | 0.00 | 0.46 | 4.77 | 0.2360 | 0.0036 | |||
| TGT / Target Corporation | 0.00 | 0.00 | 0.46 | -0.43 | 0.2349 | -0.0085 | |||
| CNI / Canadian National Railway Company | 0.00 | 0.00 | 0.41 | -1.20 | 0.2101 | -0.0091 | |||
| MS / Morgan Stanley | 0.00 | 0.00 | 0.40 | 8.99 | 0.2047 | 0.0108 | |||
| VO / Vanguard Index Funds - Vanguard Mid-Cap ETF | 0.00 | -6.72 | 0.39 | -3.48 | 0.1987 | -0.0136 | |||
| WM / Waste Management, Inc. | 0.00 | 0.00 | 0.38 | 2.96 | 0.1960 | -0.0005 | |||
| MAR / Marriott International, Inc. | 0.00 | 0.00 | 0.38 | -0.26 | 0.1955 | -0.0069 | |||
| ACN / Accenture plc | 0.00 | -17.76 | 0.37 | -23.88 | 0.1910 | -0.0676 | |||
| XMHQ / Invesco Exchange-Traded Fund Trust - Invesco S&P MidCap Quality ETF | 0.00 | -1.32 | 0.37 | -2.14 | 0.1876 | -0.0100 | |||
| DUK / Duke Energy Corporation | 0.00 | 0.00 | 0.36 | 4.35 | 0.1844 | 0.0021 | |||
| VXUS / Vanguard STAR Funds - Vanguard Total International Stock ETF | 0.01 | 0.00 | 0.36 | 4.99 | 0.1835 | 0.0034 | |||
| GILD / Gilead Sciences, Inc. | 0.00 | 0.00 | 0.34 | 9.21 | 0.1763 | 0.0099 | |||
| GPC / Genuine Parts Company | 0.00 | 0.00 | 0.34 | 0.30 | 0.1724 | -0.0053 | |||
| IVE / iShares Trust - iShares S&P 500 Value ETF | 0.00 | 0.00 | 0.32 | 3.21 | 0.1648 | -0.0002 | |||
| SRE / Sempra | 0.00 | 0.00 | 0.31 | 0.97 | 0.1603 | -0.0037 | |||
| CEG / Constellation Energy Corporation | 0.00 | 0.00 | 0.31 | 10.99 | 0.1601 | 0.0109 | |||
| NVS / Novartis AG - Depositary Receipt (Common Stock) | 0.00 | 0.00 | 0.31 | 13.38 | 0.1561 | 0.0139 | |||
| NVO / Novo Nordisk A/S - Depositary Receipt (Common Stock) | 0.00 | 0.00 | 0.31 | 5.54 | 0.1561 | 0.0035 | |||
| IP / International Paper Company | 0.01 | 0.00 | 0.30 | -2.61 | 0.1526 | -0.0088 | |||
| ODFL / Old Dominion Freight Line, Inc. | 0.00 | 0.00 | 0.29 | -5.23 | 0.1485 | -0.0133 | |||
| NTNX / Nutanix, Inc. | 0.00 | 0.00 | 0.27 | -7.22 | 0.1383 | -0.0155 | |||
| SCHW / The Charles Schwab Corporation | 0.00 | 0.00 | 0.27 | 5.56 | 0.1364 | 0.0034 | |||
| NEE / NextEra Energy, Inc. | 0.00 | 0.00 | 0.26 | -3.70 | 0.1331 | -0.0095 | |||
| CP / Canadian Pacific Kansas City Limited | 0.00 | 0.00 | 0.26 | 1.19 | 0.1304 | -0.0029 | |||
| FAF / First American Financial Corporation | 0.00 | 0.00 | 0.24 | 2.53 | 0.1243 | -0.0011 | |||
| PYPL / PayPal Holdings, Inc. | 0.00 | 0.00 | 0.24 | 3.02 | 0.1223 | -0.0004 | |||
| FI / Fiserv, Inc. | 0.00 | 0.00 | 0.23 | -10.00 | 0.1155 | -0.0165 | |||
| COP / ConocoPhillips | 0.00 | 0.00 | 0.22 | -4.74 | 0.1131 | -0.0093 | |||
| ECL / Ecolab Inc. | 0.00 | 0.21 | 0.1095 | 0.1095 | |||||
| HSY / The Hershey Company | 0.00 | 0.00 | 0.21 | 1.44 | 0.1082 | -0.0017 | |||
| AMP / Ameriprise Financial, Inc. | 0.00 | 0.00 | 0.21 | 2.97 | 0.1064 | -0.0005 | |||
| IWB / iShares Trust - iShares Russell 1000 ETF | 0.00 | 0.21 | 0.1049 | 0.1049 | |||||
| WLDN / Willdan Group, Inc. | 0.00 | 0.20 | 0.1039 | 0.1039 |