Mga Batayang Estadistika
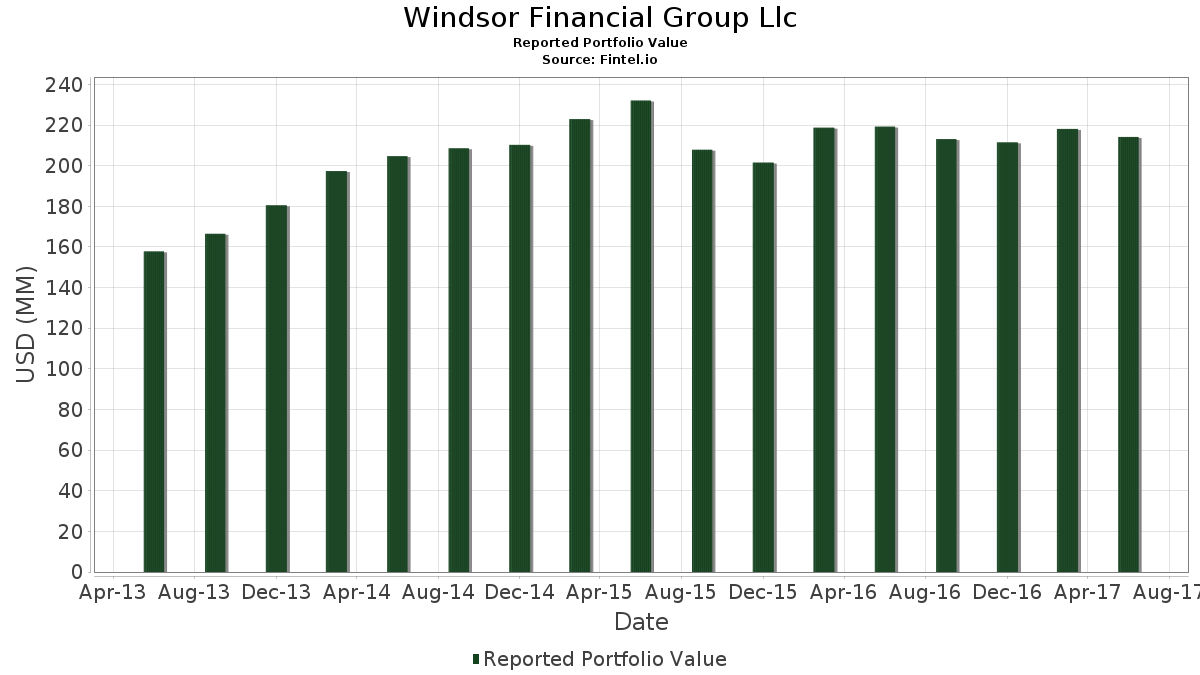
| Nilai Portofolio | $ 214,150,000 |
| Posisi Saat Ini | 79 |
Kepemilikan Terbaru, Kinerja, AUM (dari 13F, 13D)
Windsor Financial Group Llc telah mengungkapkan total kepemilikan 79 dalam pengajuan SEC terbaru mereka. Nilai portofolio terbaru dihitung sebesar $ 214,150,000 USD. Aset yang Dikelola (AUM) sebenarnya adalah nilai ini ditambah kas (yang tidak diungkapkan). Aset-aset utama Windsor Financial Group Llc adalah Berkshire Hathaway Inc. (US:BRK.B) , Vanguard Scottsdale Funds - Vanguard Short-Term Corporate Bond ETF (US:VCSH) , Markel Group Inc. (US:MKL) , Apple Inc. (US:AAPL) , and Comcast Corporation (US:CMCSA) .
Peningkatan Tertinggi Kuartal Ini
Kami menggunakan perubahan dalam alokasi portofolio karena ini adalah metrik yang paling bermakna. Perubahan dapat disebabkan oleh perdagangan atau perubahan harga saham.
| Keamanan | Saham (MM) |
Nilai (Juta Dolar AS) |
Portfolio % | ΔPorsyento ng Portfolio |
|---|---|---|---|---|
| 0.11 | 9.10 | 4.2489 | 4.2489 | |
| 0.17 | 5.72 | 2.6734 | 2.6734 | |
| 0.04 | 5.54 | 2.5856 | 2.5856 | |
| 0.06 | 5.43 | 2.5347 | 2.5347 | |
| 0.04 | 4.89 | 2.2858 | 2.2858 | |
| 0.06 | 4.85 | 2.2638 | 2.2638 | |
| 0.05 | 3.77 | 1.7618 | 1.7618 | |
| 0.10 | 1.18 | 0.5496 | 0.5496 | |
| 0.10 | 4.94 | 2.3077 | 0.2921 | |
| 0.01 | 6.42 | 2.9998 | 0.2588 |
Penurunan Tertinggi Kuartal Ini
Kami menggunakan perubahan dalam alokasi portofolio karena ini adalah metrik yang paling bermakna. Perubahan dapat disebabkan oleh perdagangan atau perubahan harga saham.
| Keamanan | Saham (MM) |
Nilai (Juta Dolar AS) |
Portfolio % | ΔPorsyento ng Portfolio |
|---|---|---|---|---|
| 0.00 | 0.00 | -1.3833 | ||
| 0.20 | 5.14 | 2.4011 | -0.2216 | |
| 0.05 | 3.62 | 1.6904 | -0.1730 | |
| 0.05 | 3.58 | 1.6717 | -0.1550 | |
| 0.08 | 1.72 | 0.8032 | -0.1405 | |
| 0.13 | 4.21 | 1.9678 | -0.1102 | |
| 0.06 | 2.35 | 1.0983 | -0.0801 | |
| 0.05 | 2.85 | 1.3318 | -0.0520 | |
| 0.04 | 2.10 | 0.9802 | -0.0446 | |
| 0.06 | 5.64 | 2.6360 | -0.0252 |
Pengajuan 13F dan Dana
Formulir ini diajukan pada 2017-08-03 untuk periode pelaporan 2017-06-30. Klik ikon tautan untuk melihat riwayat transaksi selengkapnya.
Tingkatkan ke versi premium untuk membuka data premium dan ekspor ke Excel. ![]() .
.
| Keamanan | Ketik | Harga Saham Rata-rata | Saham (MM) |
ΔSaham (%) |
ΔSaham (%) |
Nilai ($MM) |
Portpolyo (%) |
ΔPortofolio (%) |
|
|---|---|---|---|---|---|---|---|---|---|
| BRK.B / Berkshire Hathaway Inc. | 0.06 | 0.19 | 10.14 | 1.81 | 4.7331 | 0.1681 | |||
| VCSH / Vanguard Scottsdale Funds - Vanguard Short-Term Corporate Bond ETF | 0.11 | 4.44 | 9.10 | 4.83 | 4.2489 | 4.2489 | |||
| MKL / Markel Group Inc. | 0.01 | -1.88 | 8.15 | -1.88 | 3.8067 | -0.0027 | |||
| AAPL / Apple Inc. | 0.05 | -0.44 | 7.74 | -0.19 | 3.6129 | 0.0585 | |||
| CMCSA / Comcast Corporation | 0.18 | -2.46 | 6.90 | 1.00 | 3.2216 | 0.0895 | |||
| WTW / Willis Towers Watson Public Limited Company | 0.05 | -3.80 | 6.56 | 6.92 | 3.0647 | 0.2503 | |||
| VTI / Vanguard Index Funds - Vanguard Total Stock Market ETF | 0.05 | -2.87 | 6.47 | -0.37 | 3.0194 | 0.0436 | |||
| GOOG / Alphabet Inc. | 0.01 | -1.90 | 6.42 | 7.46 | 2.9998 | 0.2588 | |||
| JNJ / Johnson & Johnson | 0.05 | -0.60 | 6.09 | 5.56 | 2.8452 | 0.1986 | |||
| 61166W101 / Monsanto Co. | 0.05 | -3.29 | 5.92 | 1.13 | 2.7640 | 0.0803 | |||
| HRL / Hormel Foods Corporation | 0.17 | 52.01 | 5.72 | 49.71 | 2.6734 | 2.6734 | |||
| XOM / Exxon Mobil Corporation | 0.07 | 0.78 | 5.66 | -0.79 | 2.6411 | 0.0271 | |||
| PG / The Procter & Gamble Company | 0.06 | 0.28 | 5.64 | -2.74 | 2.6360 | -0.0252 | |||
| 74005P104 / Praxair, Inc. | 0.04 | -1.30 | 5.54 | 10.32 | 2.5856 | 2.5856 | |||
| V / Visa Inc. | 0.06 | 0.09 | 5.43 | 5.62 | 2.5347 | 2.5347 | |||
| MSFT / Microsoft Corporation | 0.08 | -0.40 | 5.31 | 4.24 | 2.4777 | 0.1439 | |||
| DISCK / Warner Bros.Discovery Inc - Series C | 0.20 | 0.95 | 5.14 | -10.10 | 2.4011 | -0.2216 | |||
| VEU / Vanguard International Equity Index Funds - Vanguard FTSE All-World ex-US ETF | 0.10 | 7.49 | 4.94 | 12.42 | 2.3077 | 0.2921 | |||
| GLD / SPDR Gold Trust | 0.04 | 0.58 | 4.89 | -0.02 | 2.2858 | 2.2858 | |||
| NVS / Novartis AG - Depositary Receipt (Common Stock) | 0.06 | -3.85 | 4.87 | 8.06 | 2.2732 | 0.2076 | |||
| DHR / Danaher Corporation | 0.06 | -0.03 | 4.85 | -1.36 | 2.2638 | 2.2638 | |||
| L / Loews Corporation | 0.10 | -0.68 | 4.77 | -0.60 | 2.2255 | 0.0270 | |||
| PDCO / Patterson Companies, Inc. | 0.10 | -0.45 | 4.72 | 3.35 | 2.2041 | 0.1100 | |||
| GE / General Electric Company | 0.17 | 8.26 | 4.58 | -1.87 | 2.1364 | -0.0012 | |||
| QCOM / QUALCOMM Incorporated | 0.08 | 2.70 | 4.47 | -1.09 | 2.0859 | 0.0153 | |||
| LMT / Lockheed Martin Corporation | 0.02 | -0.24 | 4.27 | 3.49 | 1.9953 | 0.1021 | |||
| CSCO / Cisco Systems, Inc. | 0.13 | 0.42 | 4.21 | -7.02 | 1.9678 | -0.1102 | |||
| DUK / Duke Energy Corporation | 0.05 | 0.19 | 4.02 | 2.13 | 1.8786 | 0.0725 | |||
| PFE / Pfizer Inc. | 0.12 | -0.22 | 3.97 | -2.02 | 1.8538 | -0.0041 | |||
| BSV / Vanguard Bond Index Funds - Vanguard Short-Term Bond ETF | 0.05 | 18.45 | 3.77 | 18.65 | 1.7618 | 1.7618 | |||
| CHRW / C.H. Robinson Worldwide, Inc. | 0.05 | 0.24 | 3.62 | -10.93 | 1.6904 | -0.1730 | |||
| SLB / Schlumberger Limited | 0.05 | 6.57 | 3.58 | -10.14 | 1.6717 | -0.1550 | |||
| TEVA / Teva Pharmaceutical Industries Limited - Depositary Receipt (Common Stock) | 0.09 | -0.48 | 3.10 | 3.02 | 1.4476 | 0.0679 | |||
| CNP / CenterPoint Energy, Inc. | 0.11 | -1.10 | 2.98 | -1.78 | 1.3939 | 0.0005 | |||
| TGT / Target Corporation | 0.05 | -0.27 | 2.85 | -5.50 | 1.3318 | -0.0520 | |||
| XEL / Xcel Energy Inc. | 0.06 | 0.00 | 2.35 | -8.48 | 1.0983 | -0.0801 | |||
| VNQ / Vanguard Specialized Funds - Vanguard Real Estate ETF | 0.03 | 2.32 | 2.17 | 3.14 | 1.0128 | 0.0486 | |||
| GIS / General Mills, Inc. | 0.04 | 0.01 | 2.10 | -6.09 | 0.9802 | -0.0446 | |||
| IGR / CBRE Global Real Estate Income Fund | 0.25 | 0.04 | 1.91 | 3.41 | 0.8914 | 0.0450 | |||
| MOS / The Mosaic Company | 0.08 | 6.83 | 1.72 | -16.42 | 0.8032 | -0.1405 | |||
| MMM / 3M Company | 0.01 | 0.67 | 1.66 | 9.53 | 0.7728 | 0.0800 | |||
| ICF / iShares Trust - iShares Select U.S. REIT ETF | 0.02 | -0.51 | 1.64 | 0.86 | 0.7672 | 0.0203 | |||
| AXP / American Express Company | 0.02 | 0.00 | 1.40 | 6.48 | 0.6523 | 0.0508 | |||
| TECH / Bio-Techne Corporation | 0.01 | 0.00 | 1.38 | 15.66 | 0.6449 | 0.0974 | |||
| IAU / iShares Gold Trust | 0.10 | 11.86 | 1.18 | 11.25 | 0.5496 | 0.5496 | |||
| RWX / SPDR Index Shares Funds - SPDR Dow Jones International Real Estate ETF | 0.03 | -4.79 | 1.15 | -3.05 | 0.5351 | -0.0068 | |||
| GILD / Gilead Sciences, Inc. | 0.01 | 8.58 | 0.69 | 13.09 | 0.3227 | 0.0425 | |||
| CVX / Chevron Corporation | 0.01 | 2.41 | 0.68 | -0.44 | 0.3189 | 0.0044 | |||
| BAC.PRL / Bank of America Corporation - Preferred Stock | 0.00 | 0.00 | 0.49 | 5.58 | 0.2297 | 0.0161 | |||
| AMP / Ameriprise Financial, Inc. | 0.00 | 0.00 | 0.47 | -1.87 | 0.2199 | -0.0001 | |||
| DTD / WisdomTree Trust - WisdomTree U.S. Total Dividend Fund | 0.01 | -4.27 | 0.44 | -2.86 | 0.2059 | -0.0022 | |||
| DVY / iShares Trust - iShares Select Dividend ETF | 0.00 | 0.00 | 0.39 | 1.31 | 0.1812 | 0.0056 | |||
| / Total S.A. | 0.01 | 17.11 | 0.39 | 15.22 | 0.1802 | 0.0266 | |||
| HD / The Home Depot, Inc. | 0.00 | 1.75 | 0.36 | 6.27 | 0.1662 | 0.0126 | |||
| SLV / iShares Silver Trust | 0.02 | 0.00 | 0.31 | -8.99 | 0.1466 | 0.1466 | |||
| BIV / Vanguard Bond Index Funds - Vanguard Intermediate-Term Bond ETF | 0.00 | 13.80 | 0.31 | 15.02 | 0.1466 | 0.1466 | |||
| WFC.PRL / Wells Fargo & Company - Preferred Stock | 0.00 | 0.00 | 0.30 | 5.96 | 0.1410 | 0.0103 | |||
| ABBV / AbbVie Inc. | 0.00 | 0.26 | 0.1223 | 0.1223 | |||||
| WFC / Wells Fargo & Company | 0.00 | 0.00 | 0.26 | -0.39 | 0.1205 | 0.0017 | |||
| BRK.A / Berkshire Hathaway Inc. | 0.00 | 0.00 | 0.26 | 2.00 | 0.1191 | 0.0044 | |||
| MO / Altria Group, Inc. | 0.00 | 10.99 | 0.24 | 15.71 | 0.1135 | 0.1135 | |||
| FCX / Freeport-McMoRan Inc. | 0.02 | 0.00 | 0.24 | -10.11 | 0.1121 | -0.0104 | |||
| PEP / PepsiCo, Inc. | 0.00 | 12.87 | 0.24 | 16.59 | 0.1116 | 0.0176 | |||
| ADM / Archer-Daniels-Midland Company | 0.01 | 0.00 | 0.24 | -10.19 | 0.1111 | -0.0104 | |||
| BHP / BHP Group Limited - Depositary Receipt (Common Stock) | 0.01 | 0.00 | 0.24 | -2.07 | 0.1102 | -0.0003 | |||
| JPM / JPMorgan Chase & Co. | 0.00 | 0.00 | 0.23 | 4.02 | 0.1088 | 0.1088 | |||
| DAL / Delta Air Lines, Inc. | 0.00 | 0.23 | 0.1069 | 0.1069 | |||||
| IBM / International Business Machines Corporation | 0.00 | 0.00 | 0.23 | -11.63 | 0.1065 | -0.0118 | |||
| CMI / Cummins Inc. | 0.00 | 0.00 | 0.23 | 7.08 | 0.1060 | 0.0088 | |||
| DE / Deere & Company | 0.00 | -6.42 | 0.22 | 5.88 | 0.1009 | 0.0073 | |||
| PM / Philip Morris International Inc. | 0.00 | 0.00 | 0.21 | 4.00 | 0.0971 | 0.0971 | |||
| ABT / Abbott Laboratories | 0.00 | 0.21 | 0.0971 | 0.0971 | |||||
| VZ / Verizon Communications Inc. | 0.00 | 0.00 | 0.21 | -8.41 | 0.0967 | -0.0070 | |||
| VBMFX / Vanguard Bond Index Funds - Vanguard Bond Index Fund Total Bond Market Index Fund | 0.00 | 0.20 | 0.0934 | 0.0934 | |||||
| NMS / Nuveen Minnesota Quality Municipal Income Fund | 0.01 | 0.00 | 0.18 | -4.19 | 0.0855 | 0.0855 | |||
| TROV / TrovaGene, Inc. | 0.06 | 0.00 | 0.08 | 9.72 | 0.0369 | 0.0039 | |||
| 90184LAB8 / Twitter, Inc. Bond 0.250% 9/1 | 0.05 | 0.00 | 0.05 | 0.00 | 0.0219 | 0.0219 | |||
| 092533AB4 / BlackRock Capital Investment Corporation Bond | 0.01 | 0.00 | 0.01 | 0.00 | 0.0070 | 0.0070 | |||
| 94733AAA2 / Web.com Group, Inc. Bond | 0.01 | 0.00 | 0.01 | 0.00 | 0.0070 | 0.0070 | |||
| EEM / iShares, Inc. - iShares MSCI Emerging Markets ETF | 0.00 | -100.00 | 0.00 | -100.00 | 0.0000 | ||||
| TPR / Tapestry, Inc. | 0.00 | -100.00 | 0.00 | -100.00 | -1.3833 | ||||
| WINA / Winmark Corporation | 0.00 | -100.00 | 0.00 | -100.00 | 0.0000 | ||||
| AAP / Advance Auto Parts, Inc. | 0.00 | -100.00 | 0.00 | -100.00 | 0.0000 |