Mga Batayang Estadistika
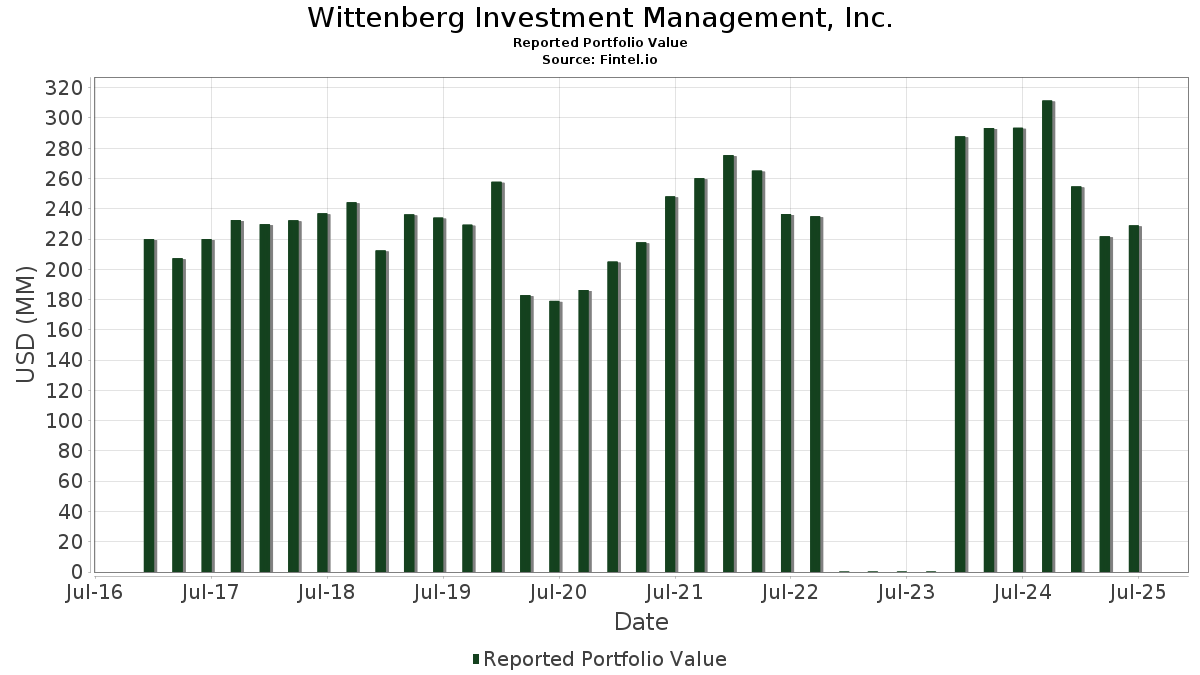
| Nilai Portofolio | $ 229,005,422 |
| Posisi Saat Ini | 76 |
Kepemilikan Terbaru, Kinerja, AUM (dari 13F, 13D)
Wittenberg Investment Management, Inc. telah mengungkapkan total kepemilikan 76 dalam pengajuan SEC terbaru mereka. Nilai portofolio terbaru dihitung sebesar $ 229,005,422 USD. Aset yang Dikelola (AUM) sebenarnya adalah nilai ini ditambah kas (yang tidak diungkapkan). Aset-aset utama Wittenberg Investment Management, Inc. adalah Berkshire Hathaway Inc. (US:BRK.B) , Sirius XM Holdings Inc. (US:SIRI) , Apple Inc. (US:AAPL) , Alphabet Inc. (US:GOOG) , and Alphabet Inc. (US:GOOGL) . Posisi baru Wittenberg Investment Management, Inc. meliputi: Cable One, Inc. (US:CABO) , Occidental Petroleum Corporation (US:OXY) , PrimeEnergy Resources Corporation (US:PNRG) , QVC Group Inc. (US:QVCGA) , and . Industri unggulan Wittenberg Investment Management, Inc. adalah "Petroleum Refining And Related Industries" (sic 29) , "Restaurants, Dining, Eating And Drinking Places" (sic 58) , and "Water Transportation" (sic 44) .
Peningkatan Tertinggi Kuartal Ini
Kami menggunakan perubahan dalam alokasi portofolio karena ini adalah metrik yang paling bermakna. Perubahan dapat disebabkan oleh perdagangan atau perubahan harga saham.
| Keamanan | Saham (MM) |
Nilai (Juta Dolar AS) |
Portfolio % | ΔPorsyento ng Portfolio |
|---|---|---|---|---|
| 0.08 | 3.68 | 1.6057 | 1.0120 | |
| 0.01 | 1.89 | 0.8261 | 0.8261 | |
| 0.03 | 1.46 | 0.6366 | 0.6366 | |
| 0.09 | 16.41 | 7.1641 | 0.6100 | |
| 0.01 | 6.46 | 2.8226 | 0.5555 | |
| 0.08 | 13.90 | 6.0696 | 0.4952 | |
| 0.01 | 2.05 | 0.8930 | 0.4029 | |
| 0.02 | 6.15 | 2.6864 | 0.2621 | |
| 0.01 | 0.58 | 0.2539 | 0.2539 | |
| 0.00 | 2.05 | 0.8935 | 0.2469 |
Penurunan Tertinggi Kuartal Ini
Kami menggunakan perubahan dalam alokasi portofolio karena ini adalah metrik yang paling bermakna. Perubahan dapat disebabkan oleh perdagangan atau perubahan harga saham.
| Keamanan | Saham (MM) |
Nilai (Juta Dolar AS) |
Portfolio % | ΔPorsyento ng Portfolio |
|---|---|---|---|---|
| 0.11 | 52.68 | 23.0042 | -3.5804 | |
| 0.04 | 4.36 | 1.9060 | -1.2195 | |
| 0.11 | 22.12 | 9.6577 | -1.1833 | |
| 1.10 | 25.34 | 11.0666 | -0.1695 | |
| 0.00 | 0.22 | 0.0968 | -0.1327 | |
| 1.14 | 1.52 | 0.6644 | -0.1040 | |
| 0.60 | 3.63 | 1.5854 | -0.0939 | |
| 0.09 | 0.54 | 0.2377 | -0.0936 | |
| 0.06 | 1.10 | 0.4792 | -0.0894 | |
| 0.13 | 1.64 | 0.7180 | -0.0870 |
Pengajuan 13D/G
Ini adalah daftar pengajuan 13D dan 13G yang dibuat dalam setahun terakhir (jika ada). Klik ikon tautan untuk melihat riwayat transaksi lengkap. Baris berwarna hijau menunjukkan posisi baru. Baris berwarna merah menunjukkan posisi yang sudah ditutup.
| Tanggal File | Formulir | Keamanan | Sebelumnya Saham |
Saat ini Saham |
ΔPersentase Saham | % Kepemilikan |
% ΔKepemilikan | |
|---|---|---|---|---|---|---|---|---|
| 2025-02-14 | LTRPA / Liberty TripAdvisor Holdings, Inc. | 3,934,990 | 1,708,792 | -56.57 | 2.34 | -56.67 |
Pengajuan 13F dan Dana
Formulir ini diajukan pada 2025-08-11 untuk periode pelaporan 2025-06-30. Klik ikon tautan untuk melihat riwayat transaksi selengkapnya.
Tingkatkan ke versi premium untuk membuka data premium dan ekspor ke Excel. ![]() .
.
| Keamanan | Ketik | Harga Saham Rata-rata | Saham (MM) |
ΔSaham (%) |
ΔSaham (%) |
Nilai ($MM) |
Portpolyo (%) |
ΔPortofolio (%) |
|
|---|---|---|---|---|---|---|---|---|---|
| BRK.B / Berkshire Hathaway Inc. | 0.11 | -2.05 | 52.68 | -10.66 | 23.0042 | -3.5804 | |||
| SIRI / Sirius XM Holdings Inc. | 1.10 | -0.19 | 25.34 | 1.69 | 11.0666 | -0.1695 | |||
| AAPL / Apple Inc. | 0.11 | -0.42 | 22.12 | -8.02 | 9.6577 | -1.1833 | |||
| GOOG / Alphabet Inc. | 0.09 | -0.60 | 16.41 | 12.86 | 7.1641 | 0.6100 | |||
| GOOGL / Alphabet Inc. | 0.08 | -1.35 | 13.90 | 12.42 | 6.0696 | 0.4952 | |||
| WBD / Warner Bros. Discovery, Inc. | 0.58 | 0.10 | 6.63 | 6.90 | 2.8972 | 0.0990 | |||
| MSFT / Microsoft Corporation | 0.01 | -2.99 | 6.46 | 28.54 | 2.8226 | 0.5555 | |||
| JPM / JPMorgan Chase & Co. | 0.02 | -3.19 | 6.15 | 14.42 | 2.6864 | 0.2621 | |||
| SSP / The E.W. Scripps Company | 2.09 | 2.54 | 6.14 | 1.84 | 2.6802 | -0.0369 | |||
| LBRDA / Liberty Broadband Corporation | 0.04 | -45.29 | 4.36 | -37.05 | 1.9060 | -1.2195 | |||
| LLYVA / Liberty Live Group | 0.05 | -4.65 | 3.71 | 12.71 | 1.6194 | 0.1358 | |||
| TDW / Tidewater Inc. | 0.08 | 155.88 | 3.68 | 179.41 | 1.6057 | 1.0120 | |||
| LILA / Liberty Latin America Ltd. | 0.60 | 1.15 | 3.63 | -2.52 | 1.5854 | -0.0939 | |||
| LBRDK / Liberty Broadband Corporation | 0.03 | -0.72 | 3.37 | 14.85 | 1.4698 | 0.1484 | |||
| LYV / Live Nation Entertainment, Inc. | 0.02 | 0.00 | 2.90 | 15.81 | 1.2668 | 0.1378 | |||
| GLDD / Great Lakes Dredge & Dock Corporation | 0.20 | -13.80 | 2.40 | 20.75 | 1.0476 | 0.1521 | |||
| BAC / Bank of America Corporation | 0.05 | 0.00 | 2.30 | 13.40 | 1.0056 | 0.0900 | |||
| JEF / Jefferies Financial Group Inc. | 0.04 | -1.56 | 2.05 | 0.49 | 0.8973 | -0.0246 | |||
| NFLX / Netflix, Inc. | 0.00 | -0.65 | 2.05 | 42.68 | 0.8935 | 0.2469 | |||
| LMB / Limbach Holdings, Inc. | 0.01 | 0.00 | 2.05 | 88.13 | 0.8930 | 0.4029 | |||
| SPOT / Spotify Technology S.A. | 0.00 | 0.00 | 1.94 | 39.55 | 0.8461 | 0.2199 | |||
| CABO / Cable One, Inc. | 0.01 | 1.89 | 0.8261 | 0.8261 | |||||
| LBTYA / Liberty Global Ltd. | 0.19 | 15.20 | 1.89 | 0.21 | 0.8249 | -0.0252 | |||
| LILAK / Liberty Latin America Ltd. | 0.30 | 2.56 | 1.87 | 2.74 | 0.8175 | -0.0042 | |||
| TRIP / Tripadvisor, Inc. | 0.13 | 0.00 | 1.64 | -7.90 | 0.7180 | -0.0870 | |||
| PHIN / PHINIA Inc. | 0.04 | 0.00 | 1.58 | 4.85 | 0.6898 | 0.0106 | |||
| FWONA / Formula One Group | 0.02 | -0.74 | 1.56 | 15.63 | 0.6820 | 0.0734 | |||
| RDI / Reading International, Inc. | 1.14 | -7.39 | 1.52 | -10.74 | 0.6644 | -0.1040 | |||
| WFC.PRL / Wells Fargo & Company - Preferred Stock | 0.00 | 0.00 | 1.52 | -2.19 | 0.6634 | -0.0371 | |||
| OXY / Occidental Petroleum Corporation | 0.03 | 1.46 | 0.6366 | 0.6366 | |||||
| GTX / Garrett Motion Inc. | 0.14 | -1.65 | 1.44 | 23.52 | 0.6286 | 0.1030 | |||
| PSMT / PriceSmart, Inc. | 0.01 | -0.74 | 1.41 | 18.72 | 0.6176 | 0.0803 | |||
| GS / The Goldman Sachs Group, Inc. | 0.00 | -6.89 | 1.27 | 20.70 | 0.5551 | 0.0799 | |||
| BATRK / Atlanta Braves Holdings, Inc. | 0.03 | -0.67 | 1.26 | 16.08 | 0.5488 | 0.0608 | |||
| THRY / Thryv Holdings, Inc. | 0.10 | 26.26 | 1.24 | 19.88 | 0.5426 | 0.0751 | |||
| APA / APA Corporation | 0.06 | 0.00 | 1.10 | -13.01 | 0.4792 | -0.0894 | |||
| LLYVK / Liberty Live Group | 0.01 | -1.91 | 1.07 | 16.79 | 0.4679 | 0.0544 | |||
| WFC / Wells Fargo & Company | 0.01 | -1.26 | 0.94 | 10.16 | 0.4121 | 0.0260 | |||
| FWONK / Formula One Group | 0.01 | -2.76 | 0.91 | 12.92 | 0.3972 | 0.0339 | |||
| PDLB / Ponce Financial Group, Inc. | 0.06 | 0.00 | 0.89 | 9.23 | 0.3881 | 0.0213 | |||
| CTGO / Contango Ore, Inc. | 0.04 | -21.26 | 0.73 | 50.41 | 0.3180 | 0.0994 | |||
| AXP / American Express Company | 0.00 | 0.00 | 0.61 | 18.59 | 0.2646 | 0.0342 | |||
| AMZN / Amazon.com, Inc. | 0.00 | 0.00 | 0.59 | 15.46 | 0.2578 | 0.0270 | |||
| HGV / Hilton Grand Vacations Inc. | 0.01 | 0.58 | 0.2539 | 0.2539 | |||||
| CMG / Chipotle Mexican Grill, Inc. | 0.01 | 0.00 | 0.57 | 11.83 | 0.2476 | 0.0190 | |||
| GLRE / Greenlight Capital Re, Ltd. | 0.04 | 0.00 | 0.55 | 6.14 | 0.2416 | 0.0064 | |||
| CAR / Avis Budget Group, Inc. | 0.00 | 0.00 | 0.55 | 122.45 | 0.2383 | 0.1278 | |||
| LEE / Lee Enterprises, Incorporated | 0.09 | 20.15 | 0.54 | -25.89 | 0.2377 | -0.0936 | |||
| DIS / The Walt Disney Company | 0.00 | -1.24 | 0.49 | 24.18 | 0.2154 | 0.0362 | |||
| IWS / iShares Trust - iShares Russell Mid-Cap Value ETF | 0.00 | 0.46 | 0.2007 | 0.2007 | |||||
| BP / BP p.l.c. - Depositary Receipt (Common Stock) | 0.02 | 0.00 | 0.46 | -11.43 | 0.2000 | -0.0331 | |||
| PNRG / PrimeEnergy Resources Corporation | 0.00 | 0.44 | 0.1918 | 0.1918 | |||||
| BYFC / Broadway Financial Corporation | 0.06 | 3.62 | 0.40 | 4.66 | 0.1768 | 0.0026 | |||
| MCY / Mercury General Corporation | 0.01 | -3.26 | 0.40 | 16.33 | 0.1746 | 0.0199 | |||
| NN / NextNav Inc. | 0.03 | 0.00 | 0.38 | 25.00 | 0.1659 | 0.0288 | |||
| WH / Wyndham Hotels & Resorts, Inc. | 0.00 | 0.00 | 0.36 | -10.40 | 0.1584 | -0.0239 | |||
| WBA / Walgreens Boots Alliance, Inc. | 0.03 | 24.00 | 0.36 | 27.24 | 0.1554 | 0.0295 | |||
| TNL / Travel + Leisure Co. | 0.01 | 0.00 | 0.29 | 11.67 | 0.1256 | 0.0093 | |||
| JNJ / Johnson & Johnson | 0.00 | 0.00 | 0.26 | -7.94 | 0.1117 | -0.0135 | |||
| CET / Central Securities Corporation | 0.01 | 0.00 | 0.25 | 6.44 | 0.1084 | 0.0033 | |||
| COST / Costco Wholesale Corporation | 0.00 | 0.00 | 0.25 | 4.66 | 0.1081 | 0.0015 | |||
| CMCSA / Comcast Corporation | 0.01 | -5.52 | 0.24 | -8.61 | 0.1068 | -0.0139 | |||
| QVCGA / QVC Group Inc. | 0.09 | 0.24 | 0.1035 | 0.1035 | |||||
| MCD / McDonald's Corporation | 0.00 | 0.00 | 0.23 | -6.43 | 0.1021 | -0.0106 | |||
| T / AT&T Inc. | 0.01 | -4.01 | 0.23 | -1.72 | 0.0996 | -0.0051 | |||
| ZTS / Zoetis Inc. | 0.00 | 0.00 | 0.23 | -5.44 | 0.0991 | -0.0089 | |||
| COOP / Mr. Cooper Group Inc. | 0.00 | 0.22 | 0.0977 | 0.0977 | |||||
| SNRE / Sunrise Communications AG - Depositary Receipt (Common Stock) | 0.00 | -62.81 | 0.22 | -56.50 | 0.0968 | -0.1327 | |||
| EML / The Eastern Company | 0.01 | 0.00 | 0.21 | -9.65 | 0.0900 | -0.0131 | |||
| BLFY / Blue Foundry Bancorp | 0.02 | 16.20 | 0.21 | 20.59 | 0.0899 | 0.0131 | |||
| CLST / Catalyst Bancorp, Inc. | 0.01 | 0.00 | 0.17 | 6.29 | 0.0740 | 0.0022 | |||
| FSEA / First Seacoast Bancorp, Inc. | 0.01 | -12.84 | 0.15 | -14.86 | 0.0652 | -0.0138 | |||
| LFCR / Lifecore Biomedical, Inc. | 0.02 | 40.91 | 0.14 | 61.63 | 0.0611 | 0.0223 | |||
| LBTYK / Liberty Global Ltd. | 0.01 | 0.00 | 0.13 | -13.73 | 0.0579 | -0.0115 | |||
| AWX / Avalon Holdings Corporation | 0.04 | 0.00 | 0.09 | -12.50 | 0.0400 | -0.0071 | |||
| SSY / SunLink Health Systems, Inc. | 0.05 | -11.27 | 0.05 | -22.41 | 0.0198 | -0.0064 | |||
| SGOV / iShares Trust - iShares 0-3 Month Treasury Bond ETF | 0.00 | -100.00 | 0.00 | 0.0000 | |||||
| ENZB / Enzo Biochem, Inc. | 0.00 | -100.00 | 0.00 | 0.0000 | |||||
| QVCGA / QVC Group Inc. | 0.00 | -100.00 | 0.00 | 0.0000 | |||||
| WMPN / William Penn Bancorporation | 0.00 | -100.00 | 0.00 | 0.0000 | |||||
| SHV / iShares Trust - iShares Short Treasury Bond ETF | 0.00 | -100.00 | 0.00 | 0.0000 |