Mga Batayang Estadistika
| Nilai Portofolio | $ 99,560,000 |
| Posisi Saat Ini | 42 |
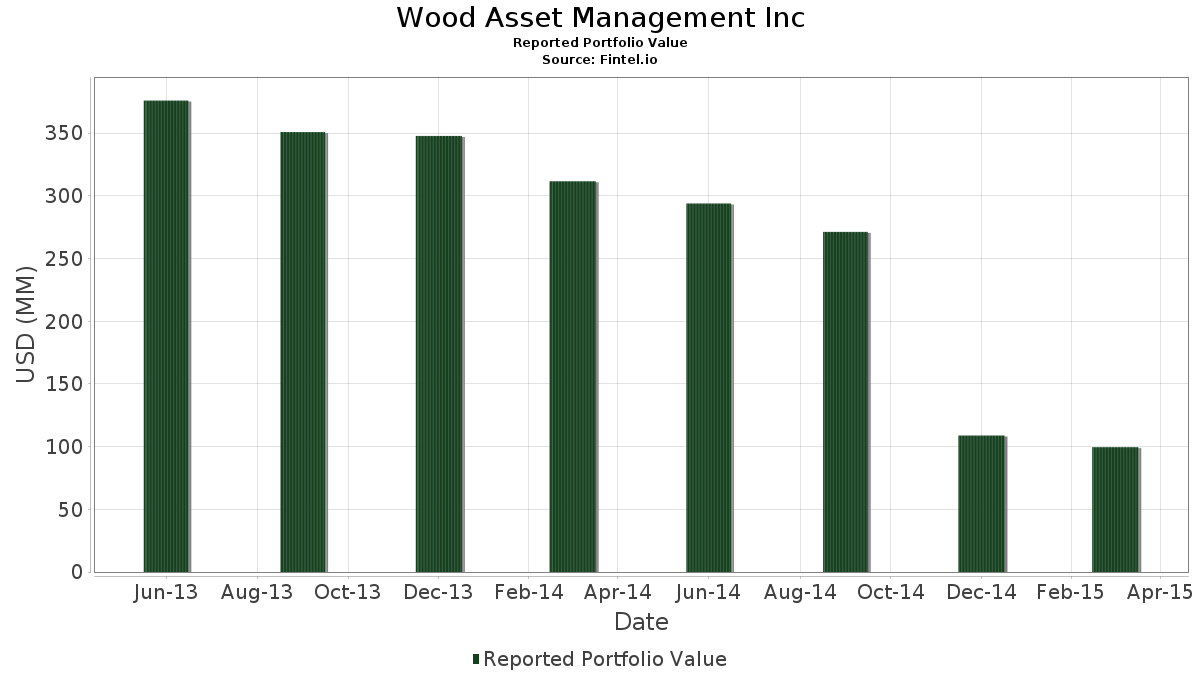
Kepemilikan Terbaru, Kinerja, AUM (dari 13F, 13D)
Wood Asset Management Inc telah mengungkapkan total kepemilikan 42 dalam pengajuan SEC terbaru mereka. Nilai portofolio terbaru dihitung sebesar $ 99,560,000 USD. Aset yang Dikelola (AUM) sebenarnya adalah nilai ini ditambah kas (yang tidak diungkapkan). Aset-aset utama Wood Asset Management Inc adalah Applied Materials, Inc. (US:AMAT) , Apple Inc. (US:AAPL) , General Electric Company (US:GE) , Lennar Corporation (US:LEN.B) , and Marathon Petroleum Corporation (US:MPC) . Posisi baru Wood Asset Management Inc meliputi: Flowers Foods, Inc. (US:FLO) , Nasdaq, Inc. (US:NDAQ) , PulteGroup, Inc. (US:PHM) , .
Peningkatan Tertinggi Kuartal Ini
Kami menggunakan perubahan dalam alokasi portofolio karena ini adalah metrik yang paling bermakna. Perubahan dapat disebabkan oleh perdagangan atau perubahan harga saham.
| Keamanan | Saham (MM) |
Nilai (Juta Dolar AS) |
Portfolio % | ΔPorsyento ng Portfolio |
|---|---|---|---|---|
| 0.08 | 1.86 | 1.8662 | 1.8662 | |
| 0.04 | 1.80 | 1.8059 | 1.8059 | |
| 0.08 | 1.74 | 1.7487 | 1.7487 | |
| 0.03 | 3.96 | 3.9805 | 1.0399 | |
| 0.02 | 3.39 | 3.4020 | 0.7626 | |
| 0.03 | 4.17 | 4.1844 | 0.7467 | |
| 0.04 | 3.98 | 3.9966 | 0.7417 | |
| 0.02 | 2.95 | 2.9620 | 0.3898 | |
| 0.06 | 2.19 | 2.2027 | 0.3782 | |
| 0.03 | 2.76 | 2.7692 | 0.3742 |
Penurunan Tertinggi Kuartal Ini
Kami menggunakan perubahan dalam alokasi portofolio karena ini adalah metrik yang paling bermakna. Perubahan dapat disebabkan oleh perdagangan atau perubahan harga saham.
| Keamanan | Saham (MM) |
Nilai (Juta Dolar AS) |
Portfolio % | ΔPorsyento ng Portfolio |
|---|---|---|---|---|
| 0.00 | 0.00 | -3.2328 | ||
| 0.00 | 0.00 | -3.1712 | ||
| 0.00 | 0.00 | -2.2866 | ||
| 0.00 | 0.00 | -1.8778 | ||
| 0.00 | 0.00 | -1.6968 | ||
| 0.00 | 0.00 | -1.3073 | ||
| 0.03 | 1.31 | 1.3208 | -1.0236 | |
| 0.00 | 0.00 | -0.2425 | ||
| 0.02 | 1.94 | 1.9446 | -0.1473 | |
| 0.05 | 0.81 | 0.8086 | -0.0936 |
Pengajuan 13F dan Dana
Formulir ini diajukan pada 2015-04-16 untuk periode pelaporan 2015-03-31. Klik ikon tautan untuk melihat riwayat transaksi selengkapnya.
Tingkatkan ke versi premium untuk membuka data premium dan ekspor ke Excel. ![]() .
.
| Keamanan | Ketik | Harga Saham Rata-rata | Saham (MM) |
ΔSaham (%) |
ΔSaham (%) |
Nilai ($MM) |
Portpolyo (%) |
ΔPortofolio (%) |
|
|---|---|---|---|---|---|---|---|---|---|
| AMAT / Applied Materials, Inc. | 0.20 | 1.16 | 4.44 | -8.42 | 4.4556 | 0.0056 | |||
| AAPL / Apple Inc. | 0.03 | -1.24 | 4.17 | 11.33 | 4.1844 | 0.7467 | |||
| GE / General Electric Company | 0.16 | -1.55 | 4.01 | -3.35 | 4.0277 | 0.2162 | |||
| LEN.B / Lennar Corporation | 0.08 | -1.47 | 3.98 | 13.91 | 0.0000 | ||||
| MPC / Marathon Petroleum Corporation | 0.04 | -1.02 | 3.98 | 12.31 | 3.9966 | 0.7417 | |||
| ABC / Amerisource Bergen Corp. | 0.03 | -1.82 | 3.96 | 23.81 | 3.9805 | 1.0399 | |||
| DHR / Danaher Corporation | 0.05 | -1.73 | 3.84 | -2.64 | 3.8550 | 0.2336 | |||
| PCAR / PACCAR Inc | 0.06 | -0.31 | 3.64 | -7.45 | 0.0000 | ||||
| MHK / Mohawk Industries, Inc. | 0.02 | -1.40 | 3.39 | 17.89 | 3.4020 | 0.7626 | |||
| JNJ / Johnson & Johnson | 0.03 | -1.76 | 3.30 | -5.50 | 3.3106 | 0.1062 | |||
| JPXUZ / JPMorgan Chase & Co. | 0.05 | -1.80 | 3.26 | -4.96 | 3.2734 | 0.1233 | |||
| IVZ / Invesco Ltd. | 0.08 | -4.45 | 3.24 | -4.03 | 3.2513 | 0.1526 | |||
| DUKH / Northern Lights Fund Trust - Ocean Park High Income ETF | 0.04 | -1.46 | 3.13 | -9.41 | 3.1408 | -0.0304 | |||
| WFC.PRY / Wells Fargo & Company - Preferred Stock | 0.06 | -2.09 | 3.01 | -2.84 | 3.0263 | 0.1775 | |||
| BLK / BlackRock, Inc. | 0.01 | -1.63 | 2.98 | 0.68 | 2.9912 | 0.2737 | |||
| TMO / Thermo Fisher Scientific Inc. | 0.02 | -1.75 | 2.95 | 5.32 | 2.9620 | 0.3898 | |||
| TWX / Warner Media LLC | 0.03 | -0.97 | 2.77 | -2.09 | 2.7782 | 0.1830 | |||
| CVS / CVS Health Corporation | 0.03 | -1.35 | 2.76 | 5.75 | 2.7692 | 0.3742 | |||
| PNUCL / PNC Financial Services Group, Inc. (The) | 0.03 | -1.82 | 2.63 | 0.34 | 2.6396 | 0.2336 | |||
| RJF / Raymond James Financial, Inc. | 0.04 | -1.45 | 2.41 | -2.35 | 2.4217 | 0.1535 | |||
| DTV / DTE Energy Company | 0.03 | -1.68 | 2.29 | -3.49 | 2.3031 | 0.1204 | |||
| CBRL / Cracker Barrel Old Country Store, Inc. | 0.01 | -1.32 | 2.21 | 6.65 | 2.2228 | 0.3165 | |||
| PFE / Pfizer Inc. | 0.06 | -1.14 | 2.19 | 10.42 | 2.2027 | 0.3782 | |||
| CVX / Chevron Corporation | 0.02 | 3.63 | 2.12 | -3.02 | 2.1274 | 0.1210 | |||
| HON / Honeywell International Inc. | 0.02 | -1.50 | 2.12 | 2.82 | 2.1243 | 0.2346 | |||
| INTU / Intuit Inc. | 0.02 | -19.15 | 1.94 | -14.98 | 1.9446 | -0.1473 | |||
| MRK / Merck & Co., Inc. | 0.03 | -1.18 | 1.93 | 0.05 | 1.9365 | 0.1662 | |||
| FLO / Flowers Foods, Inc. | 0.08 | 1.86 | 1.8662 | 1.8662 | |||||
| NDAQ / Nasdaq, Inc. | 0.04 | 1.80 | 1.8059 | 1.8059 | |||||
| PHM / PulteGroup, Inc. | 0.08 | 1.74 | 1.7487 | 1.7487 | |||||
| H & R Block Inc / (009367110) | 0.05 | 1.73 | 0.0000 | ||||||
| INPAP / International Paper Company - Preferred Security | 0.03 | -1.75 | 1.69 | 1.75 | 1.6955 | 0.1714 | |||
| CMCSA / Comcast Corporation | 0.03 | -0.94 | 1.56 | -3.59 | 1.5659 | 0.0804 | |||
| ORCL / Oracle Corporation | 0.03 | -46.30 | 1.31 | -48.47 | 1.3208 | -1.0236 | |||
| DOW / Dow Inc. | 0.02 | -9.41 | 1.08 | -4.68 | 1.0838 | 0.0438 | |||
| DAL / Delta Air Lines, Inc. | 0.02 | 0.29 | 1.03 | -8.36 | 1.0356 | 0.0021 | |||
| BAC.PRV / Bank of America Corporation | 0.05 | -4.65 | 0.81 | -18.02 | 0.8086 | -0.0936 | |||
| ANTM / Anthem Inc | 0.01 | -4.68 | 0.80 | 17.18 | 0.0000 | ||||
| DIS / The Walt Disney Company | 0.01 | -2.07 | 0.63 | 9.01 | 0.6318 | 0.1017 | |||
| BRK.B / Berkshire Hathaway Inc. | 0.00 | -4.44 | 0.51 | -8.15 | 0.5092 | 0.0021 | |||
| LH / Labcorp Holdings Inc. | 0.00 | 0.00 | 0.21 | 26.51 | 0.2109 | 0.2109 | |||
| WMT / Walmart Inc. | 0.00 | -2.56 | 0.20 | -6.98 | 0.2009 | 0.0034 | |||
| C / Citigroup Inc. | 0.00 | -100.00 | 0.00 | -100.00 | -1.6968 | ||||
| UPS / United Parcel Service, Inc. | 0.00 | -100.00 | 0.00 | -100.00 | -3.1712 | ||||
| BBWI / Bath & Body Works, Inc. | 0.00 | -100.00 | 0.00 | -100.00 | -3.2328 | ||||
| SLB / Schlumberger Limited | 0.00 | -100.00 | 0.00 | -100.00 | -1.3073 | ||||
| Kraft Foods Group Inc / (050076Q10) | 0.00 | -100.00 | 0.00 | 0.0000 | |||||
| BWA / BorgWarner Inc. | 0.00 | -100.00 | 0.00 | -100.00 | -1.8778 | ||||
| PG / The Procter & Gamble Company | 0.00 | -100.00 | 0.00 | -100.00 | -0.2425 | ||||
| PRU / Prudential Financial, Inc. | 0.00 | -100.00 | 0.00 | -100.00 | -2.2866 |