Mga Batayang Estadistika
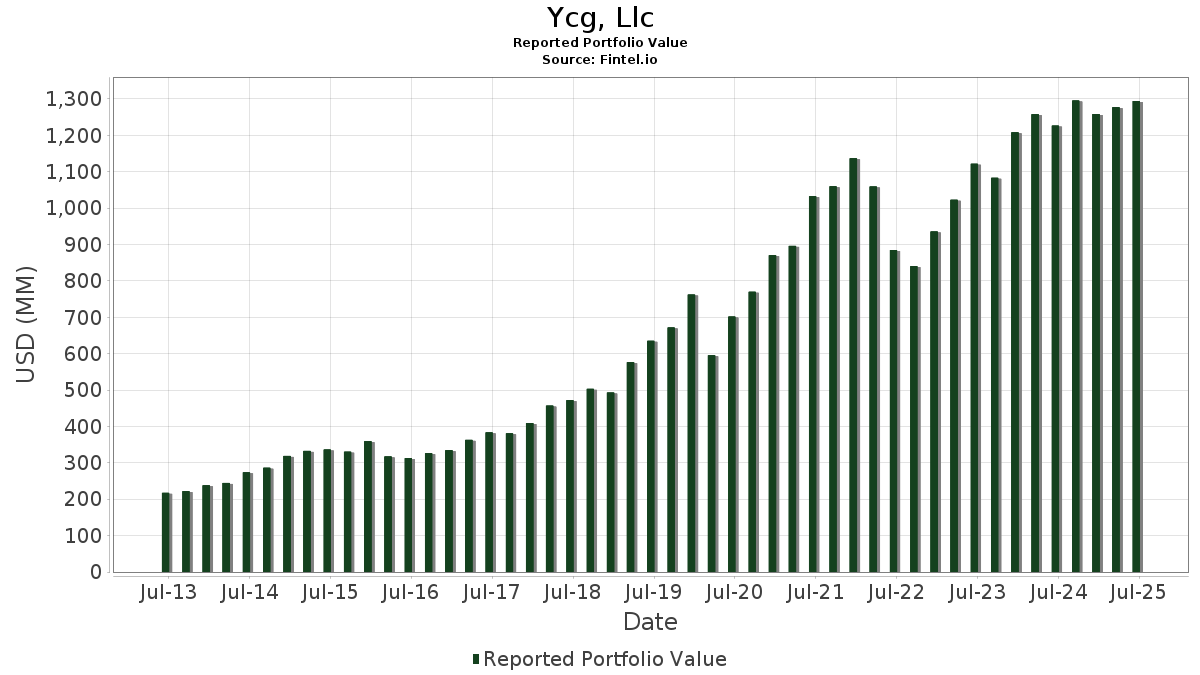
| Nilai Portofolio | $ 1,293,954,787 |
| Posisi Saat Ini | 36 |
Kepemilikan Terbaru, Kinerja, AUM (dari 13F, 13D)
Ycg, Llc telah mengungkapkan total kepemilikan 36 dalam pengajuan SEC terbaru mereka. Nilai portofolio terbaru dihitung sebesar $ 1,293,954,787 USD. Aset yang Dikelola (AUM) sebenarnya adalah nilai ini ditambah kas (yang tidak diungkapkan). Aset-aset utama Ycg, Llc adalah Microsoft Corporation (US:MSFT) , Mastercard Incorporated (US:MA) , Moody's Corporation (US:MCO) , Amazon.com, Inc. (US:AMZN) , and MSCI Inc. (US:MSCI) .
Peningkatan Tertinggi Kuartal Ini
Kami menggunakan perubahan dalam alokasi portofolio karena ini adalah metrik yang paling bermakna. Perubahan dapat disebabkan oleh perdagangan atau perubahan harga saham.
| Keamanan | Saham (MM) |
Nilai (Juta Dolar AS) |
Portfolio % | ΔPorsyento ng Portfolio |
|---|---|---|---|---|
| 0.22 | 107.99 | 8.3457 | 1.7960 | |
| 0.06 | 48.09 | 3.7166 | 0.7434 | |
| 0.33 | 73.29 | 5.6643 | 0.6511 | |
| 0.03 | 56.86 | 4.3946 | 0.6231 | |
| 0.25 | 44.75 | 3.4583 | 0.3613 | |
| 0.18 | 89.11 | 6.8869 | 0.3344 | |
| 0.11 | 10.04 | 0.7757 | 0.2269 | |
| 0.38 | 29.82 | 2.3047 | 0.2145 | |
| 0.04 | 17.67 | 1.3655 | 0.1660 | |
| 0.20 | 28.68 | 2.2168 | 0.1235 |
Penurunan Tertinggi Kuartal Ini
Kami menggunakan perubahan dalam alokasi portofolio karena ini adalah metrik yang paling bermakna. Perubahan dapat disebabkan oleh perdagangan atau perubahan harga saham.
| Keamanan | Saham (MM) |
Nilai (Juta Dolar AS) |
Portfolio % | ΔPorsyento ng Portfolio |
|---|---|---|---|---|
| 0.14 | 44.51 | 3.4401 | -1.0649 | |
| 1.17 | 57.58 | 4.4499 | -0.7930 | |
| 0.15 | 52.16 | 4.0307 | -0.5951 | |
| 0.22 | 47.13 | 3.6426 | -0.5211 | |
| 0.24 | 54.18 | 4.1875 | -0.3229 | |
| 0.20 | 49.56 | 3.8298 | -0.2417 | |
| 0.05 | 24.05 | 1.8589 | -0.2062 | |
| 0.21 | 42.22 | 3.2625 | -0.1536 | |
| 0.11 | 17.78 | 1.3743 | -0.1305 | |
| 0.06 | 15.89 | 1.2283 | -0.1040 |
Pengajuan 13F dan Dana
Formulir ini diajukan pada 2025-08-13 untuk periode pelaporan 2025-06-30. Klik ikon tautan untuk melihat riwayat transaksi selengkapnya.
Tingkatkan ke versi premium untuk membuka data premium dan ekspor ke Excel. ![]() .
.
| Keamanan | Ketik | Harga Saham Rata-rata | Saham (MM) |
ΔSaham (%) |
ΔSaham (%) |
Nilai ($MM) |
Portpolyo (%) |
ΔPortofolio (%) |
|
|---|---|---|---|---|---|---|---|---|---|
| MSFT / Microsoft Corporation | 0.22 | -2.56 | 107.99 | 29.11 | 8.3457 | 1.7960 | |||
| MA / Mastercard Incorporated | 0.17 | -1.59 | 94.60 | 0.89 | 7.3109 | -0.0315 | |||
| MCO / Moody's Corporation | 0.18 | -1.12 | 89.11 | 6.50 | 6.8869 | 0.3344 | |||
| AMZN / Amazon.com, Inc. | 0.33 | -0.71 | 73.29 | 14.49 | 5.6643 | 0.6511 | |||
| MSCI / MSCI Inc. | 0.11 | -1.36 | 60.62 | 0.60 | 4.6852 | -0.0337 | |||
| CPRT / Copart, Inc. | 1.17 | -0.82 | 57.58 | -14.00 | 4.4499 | -0.7930 | |||
| FICO / Fair Isaac Corporation | 0.03 | 19.11 | 56.86 | 18.07 | 4.3946 | 0.6231 | |||
| WM / Waste Management, Inc. | 0.24 | -4.82 | 54.18 | -5.93 | 4.1875 | -0.3229 | |||
| AON / Aon plc | 0.15 | -1.23 | 52.16 | -11.71 | 4.0307 | -0.5951 | |||
| RSG / Republic Services, Inc. | 0.20 | -6.41 | 49.56 | -4.69 | 3.8298 | -0.2417 | |||
| INTU / Intuit Inc. | 0.06 | -1.26 | 48.09 | 26.67 | 3.7166 | 0.7434 | |||
| MMC / Marsh & McLennan Companies, Inc. | 0.22 | -1.06 | 47.13 | -11.35 | 3.6426 | -0.5211 | |||
| GOOG / Alphabet Inc. | 0.25 | -0.35 | 44.75 | 13.15 | 3.4583 | 0.3613 | |||
| VRSK / Verisk Analytics, Inc. | 0.14 | -26.07 | 44.51 | -22.63 | 3.4401 | -1.0649 | |||
| SPGI / S&P Global Inc. | 0.08 | -0.98 | 43.04 | 2.76 | 3.3265 | 0.0465 | |||
| AAPL / Apple Inc. | 0.21 | 4.77 | 42.22 | -3.23 | 3.2625 | -0.1536 | |||
| CSGP / CoStar Group, Inc. | 0.44 | -1.81 | 35.28 | -0.36 | 2.7266 | -0.0461 | |||
| CME / CME Group Inc. | 0.11 | -0.87 | 30.33 | 2.99 | 2.3443 | 0.0378 | |||
| CP / Canadian Pacific Kansas City Limited | 0.38 | -1.05 | 29.82 | 11.72 | 2.3047 | 0.2145 | |||
| CNI / Canadian National Railway Company | 0.28 | -0.73 | 29.52 | 5.97 | 2.2816 | 0.1000 | |||
| CBRE / CBRE Group, Inc. | 0.20 | 0.15 | 28.68 | 7.31 | 2.2168 | 0.1235 | |||
| BRK.B / Berkshire Hathaway Inc. | 0.05 | 0.00 | 24.05 | -8.79 | 1.8589 | -0.2062 | |||
| V / Visa Inc. | 0.06 | 0.21 | 22.88 | 1.53 | 1.7683 | 0.0035 | |||
| CL / Colgate-Palmolive Company | 0.20 | -1.06 | 18.29 | -4.02 | 1.4132 | -0.0786 | |||
| PG / The Procter & Gamble Company | 0.11 | -1.02 | 17.78 | -7.46 | 1.3743 | -0.1305 | |||
| RACE / Ferrari N.V. | 0.04 | 0.57 | 17.67 | 15.35 | 1.3655 | 0.1660 | |||
| ADBE / Adobe Inc. | 0.05 | -0.07 | 17.42 | 0.80 | 1.3461 | -0.0070 | |||
| PGR / The Progressive Corporation | 0.06 | -0.93 | 15.89 | -6.58 | 1.2283 | -0.1040 | |||
| MLM / Martin Marietta Materials, Inc. | 0.02 | -0.51 | 10.66 | 14.23 | 0.8235 | 0.0930 | |||
| VMC / Vulcan Materials Company | 0.04 | -0.51 | 10.40 | 11.23 | 0.8035 | 0.0715 | |||
| CRH / CRH plc | 0.11 | 37.25 | 10.04 | 43.23 | 0.7757 | 0.2269 | |||
| KO / The Coca-Cola Company | 0.08 | -1.70 | 5.79 | -2.90 | 0.4476 | -0.0195 | |||
| EFX / Equifax Inc. | 0.01 | 0.00 | 1.56 | 6.50 | 0.1203 | 0.0058 | |||
| SYK / Stryker Corporation | 0.00 | 0.00 | 1.40 | 6.28 | 0.1085 | 0.0051 | |||
| JNJ / Johnson & Johnson | 0.00 | 0.00 | 0.53 | -7.93 | 0.0413 | -0.0041 | |||
| TJX / The TJX Companies, Inc. | 0.00 | 0.00 | 0.25 | 1.23 | 0.0191 | 0.0000 | |||
| BDX / Becton, Dickinson and Company | 0.00 | -100.00 | 0.00 | 0.0000 | |||||
| PEP / PepsiCo, Inc. | 0.00 | -100.00 | 0.00 | 0.0000 |