Mga Batayang Estadistika
| Nilai Portofolio | $ 46,808,000 |
| Posisi Saat Ini | 79 |
Kepemilikan Terbaru, Kinerja, AUM (dari 13F, 13D)
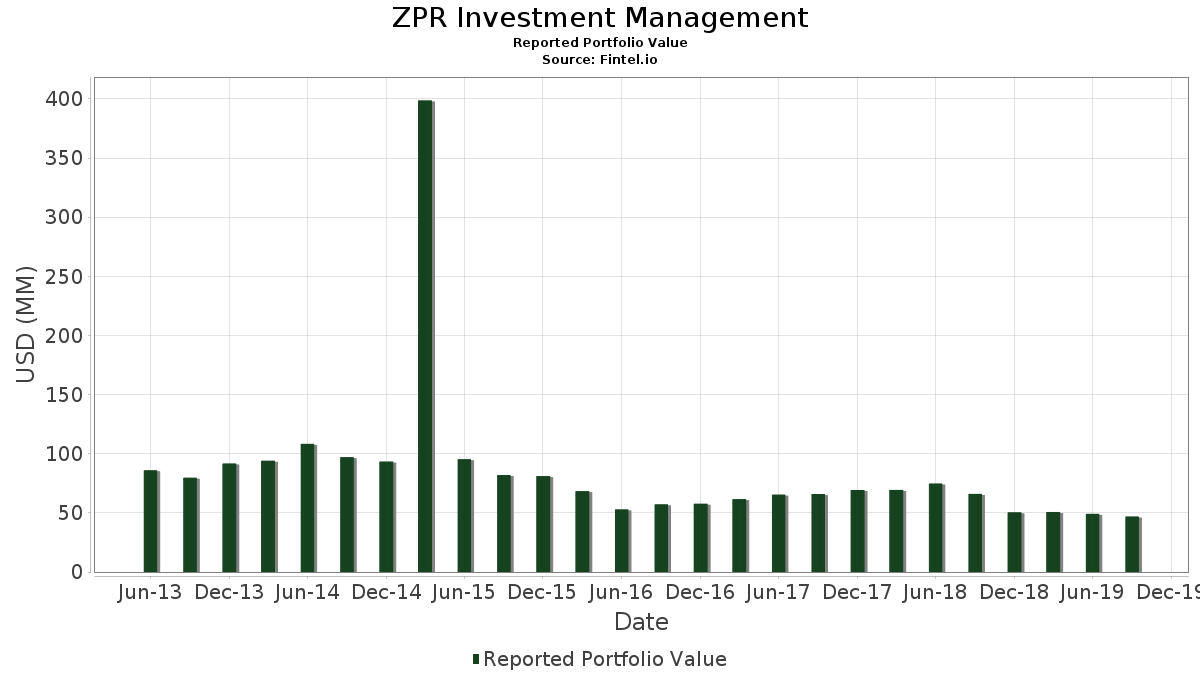
ZPR Investment Management telah mengungkapkan total kepemilikan 79 dalam pengajuan SEC terbaru mereka. Nilai portofolio terbaru dihitung sebesar $ 46,808,000 USD. Aset yang Dikelola (AUM) sebenarnya adalah nilai ini ditambah kas (yang tidak diungkapkan). Aset-aset utama ZPR Investment Management adalah TD SYNNEX Corporation (US:SNX) , America's Car-Mart, Inc. (US:CRMT) , Generac Holdings Inc. (US:GNRC) , Quanta Services, Inc. (US:PWR) , and Zebra Technologies Corporation (US:ZBRA) . Posisi baru ZPR Investment Management meliputi: M.D.C. Holdings, Inc. (US:MDC) , BMC Stock Holdings, Inc. (US:) , Jones Lang LaSalle Incorporated (US:JLL) , First American Financial Corporation (US:FAF) , and Anixter International, Inc. (US:US0352901054) .
Peningkatan Tertinggi Kuartal Ini
Kami menggunakan perubahan dalam alokasi portofolio karena ini adalah metrik yang paling bermakna. Perubahan dapat disebabkan oleh perdagangan atau perubahan harga saham.
| Keamanan | Saham (MM) |
Nilai (Juta Dolar AS) |
Portfolio % | ΔPorsyento ng Portfolio |
|---|---|---|---|---|
| 0.10 | 1.08 | 2.2988 | 2.0382 | |
| 0.02 | 0.85 | 1.8117 | 1.8117 | |
| 0.01 | 0.53 | 1.1408 | 1.1408 | |
| 0.02 | 0.51 | 1.0981 | 1.0981 | |
| 0.01 | 0.50 | 1.0746 | 1.0746 | |
| 0.05 | 1.53 | 3.2687 | 1.0702 | |
| 0.00 | 0.46 | 0.9891 | 0.9891 | |
| 0.01 | 0.45 | 0.9614 | 0.9614 | |
| 0.12 | 1.40 | 2.9995 | 0.9129 | |
| 0.00 | 0.43 | 0.9122 | 0.9122 |
Penurunan Tertinggi Kuartal Ini
Kami menggunakan perubahan dalam alokasi portofolio karena ini adalah metrik yang paling bermakna. Perubahan dapat disebabkan oleh perdagangan atau perubahan harga saham.
| Keamanan | Saham (MM) |
Nilai (Juta Dolar AS) |
Portfolio % | ΔPorsyento ng Portfolio |
|---|---|---|---|---|
| 0.00 | 0.00 | -2.1883 | ||
| 0.00 | 0.00 | -2.0275 | ||
| 0.00 | 0.00 | -1.4494 | ||
| 0.00 | 0.00 | -1.4087 | ||
| 0.00 | 0.00 | -1.2255 | ||
| 0.00 | 0.27 | 0.5854 | -1.1327 | |
| 0.00 | 0.00 | -1.0870 | ||
| 0.00 | 0.00 | -0.7919 | ||
| 0.08 | 1.63 | 3.4909 | -0.7678 | |
| 0.00 | 0.00 | -0.6962 |
Pengajuan 13F dan Dana
Formulir ini diajukan pada 2019-11-14 untuk periode pelaporan 2019-09-30. Klik ikon tautan untuk melihat riwayat transaksi selengkapnya.
Tingkatkan ke versi premium untuk membuka data premium dan ekspor ke Excel. ![]() .
.
| Keamanan | Ketik | Harga Saham Rata-rata | Saham (MM) |
ΔSaham (%) |
ΔSaham (%) |
Nilai ($MM) |
Portpolyo (%) |
ΔPortofolio (%) |
|
|---|---|---|---|---|---|---|---|---|---|
| SNX / TD SYNNEX Corporation | 0.03 | -6.28 | 2.86 | 7.53 | 6.1015 | 0.6948 | |||
| CRMT / America's Car-Mart, Inc. | 0.02 | -16.31 | 1.97 | -10.84 | 4.2172 | -0.2897 | |||
| GNRC / Generac Holdings Inc. | 0.02 | -24.83 | 1.75 | -15.17 | 3.7280 | -0.4594 | |||
| PWR / Quanta Services, Inc. | 0.04 | -6.15 | 1.70 | -7.10 | 3.6319 | -0.0934 | |||
| ZBRA / Zebra Technologies Corporation | 0.01 | -6.24 | 1.68 | -7.63 | 3.5934 | -0.1135 | |||
| ATKR / Atkore Inc. | 0.05 | -6.27 | 1.66 | 9.94 | 3.5443 | 0.4724 | |||
| PLBC / Plumas Bancorp | 0.08 | -6.02 | 1.63 | -21.89 | 3.4909 | -0.7678 | |||
| MLR / Miller Industries, Inc. | 0.05 | 30.85 | 1.53 | 41.67 | 3.2687 | 1.0702 | |||
| TACT / TransAct Technologies Incorporated | 0.12 | 26.92 | 1.40 | 36.98 | 2.9995 | 0.9129 | |||
| WD / Walker & Dunlop, Inc. | 0.02 | -5.78 | 1.37 | -0.94 | 2.9354 | 0.1119 | |||
| OSK / Oshkosh Corporation | 0.02 | -6.13 | 1.25 | -14.73 | 2.6598 | -0.3123 | |||
| DIOD / Diodes Incorporated | 0.03 | -5.58 | 1.18 | 4.25 | 2.5145 | 0.2163 | |||
| CASH / Pathward Financial, Inc. | 0.04 | -6.07 | 1.15 | 9.22 | 2.4547 | 0.3132 | |||
| RCKY / Rocky Brands, Inc. | 0.03 | -6.18 | 1.10 | 14.29 | 2.3586 | 0.3921 | |||
| GRBK / Green Brick Partners, Inc. | 0.10 | 554.27 | 1.08 | 740.63 | 2.2988 | 2.0382 | |||
| MCFT / MasterCraft Boat Holdings, Inc. | 0.07 | -6.00 | 0.97 | -28.42 | 2.0766 | -0.6879 | |||
| VRNT / Verint Systems Inc. | 0.02 | 29.32 | 0.97 | 2.87 | 2.0659 | 0.1524 | |||
| TALO / Talos Energy Inc. | 0.05 | -5.69 | 0.96 | -20.31 | 2.0616 | -0.4036 | |||
| SANM / Sanmina Corporation | 0.03 | -7.52 | 0.86 | -1.94 | 1.8373 | 0.0520 | |||
| PFBC / Preferred Bank | 0.02 | -37.39 | 0.86 | -30.61 | 1.8352 | -0.6850 | |||
| UFPI / UFP Industries, Inc. | 0.02 | 0.85 | 1.8117 | 1.8117 | |||||
| NMRK / Newmark Group, Inc. | 0.09 | -8.22 | 0.80 | -7.38 | 1.7155 | -0.0494 | |||
| FONR / FONAR Corporation | 0.04 | -6.11 | 0.78 | -9.73 | 1.6642 | -0.0925 | |||
| TKR / The Timken Company | 0.02 | -5.79 | 0.77 | -20.17 | 1.6493 | -0.3192 | |||
| MHH / Mastech Digital, Inc. | 0.12 | -6.47 | 0.73 | 18.17 | 1.5702 | 0.3041 | |||
| PKOH / Park-Ohio Holdings Corp. | 0.02 | -6.03 | 0.73 | -13.83 | 1.5574 | -0.1647 | |||
| NTWK / NetSol Technologies, Inc. | 0.12 | 69.91 | 0.66 | 71.43 | 1.4100 | 0.6263 | |||
| CPRI / Capri Holdings Limited | 0.02 | -6.03 | 0.64 | -10.13 | 1.3652 | -0.0822 | |||
| MDC / M.D.C. Holdings, Inc. | 0.01 | 0.53 | 1.1408 | 1.1408 | |||||
| / BMC Stock Holdings, Inc. | 0.02 | 0.51 | 1.0981 | 1.0981 | |||||
| SBFG / SB Financial Group, Inc. | 0.03 | -7.08 | 0.51 | -5.61 | 1.0789 | -0.0102 | |||
| PRFT / Perficient, Inc. | 0.01 | 0.50 | 1.0746 | 1.0746 | |||||
| HELE / Helen of Troy Limited | 0.00 | 0.46 | 0.9891 | 0.9891 | |||||
| MLHR / Herman Miller Inc. | 0.01 | 0.45 | 0.9614 | 0.9614 | |||||
| GFED / Guaranty Federal Bancshares Inc | 0.02 | -4.97 | 0.44 | -0.68 | 0.9400 | 0.0382 | |||
| JLL / Jones Lang LaSalle Incorporated | 0.00 | 0.43 | 0.9122 | 0.9122 | |||||
| FAF / First American Financial Corporation | 0.01 | 0.43 | 0.9101 | 0.9101 | |||||
| EVTC / EVERTEC, Inc. | 0.01 | 0.41 | 0.8716 | 0.8716 | |||||
| FMNB / Farmers National Banc Corp. | 0.03 | -8.22 | 0.38 | -10.40 | 0.8097 | -0.0514 | |||
| NODK / NI Holdings, Inc. | 0.02 | 12.11 | 0.38 | 9.01 | 0.8011 | 0.1009 | |||
| ODC / Oil-Dri Corporation of America | 0.01 | -0.96 | 0.35 | -0.84 | 0.7584 | 0.0296 | |||
| UNTY / Unity Bancorp, Inc. | 0.02 | -8.23 | 0.35 | -10.41 | 0.7541 | -0.0479 | |||
| FL / Foot Locker, Inc. | 0.01 | -52.30 | 0.32 | -50.86 | 0.6730 | -0.6319 | |||
| US0352901054 / Anixter International, Inc. | 0.00 | 0.30 | 0.6388 | 0.6388 | |||||
| DBI / Designer Brands Inc. | 0.02 | -50.89 | 0.28 | -56.19 | 0.5896 | -0.6928 | |||
| SNFCA / Security National Financial Corporation | 0.06 | -6.75 | 0.28 | -8.94 | 0.5875 | -0.0273 | |||
| NC / NACCO Industries, Inc. | 0.00 | -73.59 | 0.27 | -67.54 | 0.5854 | -1.1327 | |||
| UG / United-Guardian, Inc. | 0.01 | 0.88 | 0.26 | 1.97 | 0.5533 | 0.0363 | |||
| BELFB / Bel Fuse Inc. | 0.02 | -6.08 | 0.26 | -18.01 | 0.5448 | -0.0883 | |||
| RIVE / Riverview Financial Corp | 0.02 | -7.76 | 0.25 | 2.88 | 0.5341 | 0.0394 | |||
| EML / The Eastern Company | 0.01 | 11.97 | 0.25 | -0.80 | 0.5320 | 0.0210 | |||
| HMNF / HMN Financial, Inc. | 0.01 | 0.24 | 0.5063 | 0.5063 | |||||
| VCTR / Victory Capital Holdings, Inc. | 0.01 | -7.14 | 0.23 | -16.97 | 0.4914 | -0.0725 | |||
| US01167P1012 / Alaska Communications Systems Group Inc | 0.13 | 42.52 | 0.23 | 44.03 | 0.4892 | 0.1656 | |||
| JRSH / Jerash Holdings (US), Inc. | 0.03 | 16.33 | 0.23 | 19.90 | 0.4892 | 0.1004 | |||
| PRPL / Purple Innovation, Inc. | 0.03 | 0.22 | 0.4786 | 0.4786 | |||||
| ALCO / Alico, Inc. | 0.01 | 0.21 | 0.4551 | 0.4551 | |||||
| ISSC / Innovative Solutions and Support, Inc. | 0.04 | 205.88 | 0.20 | 180.82 | 0.4380 | 0.2894 | |||
| TSQ / Townsquare Media, Inc. | 0.03 | 24.84 | 0.19 | 63.56 | 0.4123 | 0.1721 | |||
| STL / Sterling Bancorp. | 0.02 | -7.69 | 0.19 | -9.66 | 0.3995 | -0.0219 | |||
| MYFW / First Western Financial, Inc. | 0.01 | 0.18 | 0.3867 | 0.3867 | |||||
| CRD.B / Crawford & Company | 0.02 | -8.17 | 0.18 | -0.55 | 0.3867 | 0.0162 | |||
| SANW / S&W Seed Company | 0.08 | 0.18 | 0.3845 | 0.3845 | |||||
| CWBC / Community West Bancshares | 0.02 | -10.26 | 0.17 | -8.06 | 0.3653 | -0.0133 | |||
| LMST / Limestone Bancorp Inc | 0.01 | 0.16 | 0.3440 | 0.3440 | |||||
| PBBI / PB Bancorp, Inc. | 0.01 | 0.16 | 0.3440 | 0.3440 | |||||
| VMD / Viemed Healthcare, Inc. | 0.02 | 0.16 | 0.3375 | 0.3375 | |||||
| NAII / Natural Alternatives International, Inc. | 0.02 | -49.05 | 0.15 | -63.59 | 0.3205 | -0.5182 | |||
| NATR / Nature's Sunshine Products, Inc. | 0.02 | 0.14 | 0.2970 | 0.2970 | |||||
| CVU / CPI Aerostructures, Inc. | 0.02 | -6.91 | 0.14 | -8.67 | 0.2927 | -0.0127 | |||
| ASRV / AmeriServ Financial, Inc. | 0.03 | -8.35 | 0.14 | -8.72 | 0.2905 | -0.0128 | |||
| DVD / Dover Motorsports Inc | 0.07 | -3.35 | 0.13 | -7.86 | 0.2756 | -0.0094 | |||
| GDP / Goodrich Petroleum Corp. | 0.01 | 11.47 | 0.13 | -8.70 | 0.2692 | -0.0117 | |||
| RNGR / Ranger Energy Services, Inc. | 0.02 | 0.12 | 0.2606 | 0.2606 | |||||
| NL / NL Industries, Inc. | 0.02 | 0.08 | 0.1730 | 0.1730 | |||||
| ESTE / Earthstone Energy Inc - Class A | 0.02 | 0.06 | 0.1367 | 0.1367 | |||||
| BBGI / Beasley Broadcast Group, Inc. | 0.02 | 0.05 | 0.1111 | 0.1111 | |||||
| AWRE / Aware, Inc. | 0.01 | -10.41 | 0.04 | -18.18 | 0.0769 | -0.0127 | |||
| ARC / ARC Document Solutions, Inc. | 0.01 | 9.94 | 0.01 | -28.57 | 0.0320 | -0.0107 | |||
| CHRA / Charah Solutions Inc | 0.00 | -100.00 | 0.00 | -100.00 | -0.2219 | ||||
| CURO / CURO Group Holdings Corp. | 0.00 | -100.00 | 0.00 | -100.00 | -0.7919 | ||||
| GIII / G-III Apparel Group, Ltd. | 0.00 | -100.00 | 0.00 | -100.00 | -1.4087 | ||||
| BCEI / Bonanza Creek Energy Inc New | 0.00 | -100.00 | 0.00 | -100.00 | -2.1883 | ||||
| KEM / KraneShares Trust - KraneShares Dynamic Emerging Markets Strategy ETF | 0.00 | -100.00 | 0.00 | -100.00 | -1.4494 | ||||
| MRBK / Meridian Corporation | 0.00 | -100.00 | 0.00 | -100.00 | -0.3746 | ||||
| ACNB / ACNB Corporation | 0.00 | -100.00 | 0.00 | -100.00 | -0.4580 | ||||
| VOXX / VOXX International Corporation | 0.00 | -100.00 | 0.00 | -100.00 | 0.0000 | 0.0000 | |||
| MAMS / MAM Software Group, Inc. | 0.00 | -100.00 | 0.00 | -100.00 | -0.6107 | ||||
| EVOL / Symbolic Logic, Inc. | 0.00 | -100.00 | 0.00 | -100.00 | -0.2992 | ||||
| RUSHA / Rush Enterprises, Inc. | 0.00 | -100.00 | 0.00 | -100.00 | -0.4804 | ||||
| HNNA / Hennessy Advisors, Inc. | 0.00 | -100.00 | 0.00 | -100.00 | -0.3115 | ||||
| US7587501039 / Regal-Beloit Corp. | 0.00 | -100.00 | 0.00 | -100.00 | -1.0870 | ||||
| KMT / Kennametal Inc. | 0.00 | -100.00 | 0.00 | -100.00 | -2.0275 | ||||
| BFC / Bank First Corporation | 0.00 | -100.00 | 0.00 | -100.00 | -0.6962 | ||||
| LINC / Lincoln Educational Services Corporation | 0.00 | -100.00 | 0.00 | -100.00 | -0.1588 | ||||
| WLFC / Willis Lease Finance Corporation | 0.00 | -100.00 | 0.00 | -100.00 | 0.0000 | 0.0000 | |||
| FCAP / First Capital, Inc. | 0.00 | -100.00 | 0.00 | -100.00 | -0.5354 | ||||
| TNK / Teekay Tankers Ltd. | 0.00 | -100.00 | 0.00 | -100.00 | 0.0000 | 0.0000 | |||
| / BMC Stock Holdings, Inc. | 0.00 | -100.00 | 0.00 | -100.00 | -1.2255 |