Chegg, Inc.
Pendahuluan
Halaman ini memberikan analisis komprehensif tentang sejarah perdagangan orang dalam yang diketahui dari Insight Holdings Group, LLC. Orang dalam adalah pejabat, direktur, atau investor signifikan dalam suatu perusahaan. Adalah ilegal bagi orang dalam untuk melakukan perdagangan di perusahaan mereka berdasarkan informasi spesifik yang tidak dipublikasikan. Ini tidak berarti bahwa mereka dilarang melakukan perdagangan apa pun di perusahaan mereka sendiri. Namun, mereka harus melaporkan semua perdagangan kepada SEC melalui Formulir 4. Terlepas dari pembatasan ini, penelitian akademis menunjukkan bahwa orang dalam - secara umum - cenderung mengungguli pasar di perusahaan mereka sendiri.
Rata-rata Profitabilitas Perdagangan
Profitabilitas perdagangan rata-rata adalah pengembalian rata-rata dari semua pembelian pasar terbuka yang dilakukan oleh orang dalam dalam tiga tahun terakhir. Untuk menghitung ini, kami memeriksa setiap pembelian pasar terbuka yang tidak direncanakan yang dilakukan oleh orang dalam, tidak termasuk semua perdagangan yang ditandai sebagai bagian dari rencana perdagangan 10b5-1. Kami kemudian menghitung kinerja rata-rata dari perdagangan tersebut selama 3, 6, dan 12 bulan, dengan merata-ratakan setiap durasi tersebut untuk menghasilkan metrik kinerja akhir untuk setiap perdagangan. Terakhir, kami merata-ratakan semua metrik kinerja untuk menghitung metrik kinerja untuk orang dalam. Daftar ini hanya mencakup orang dalam yang telah melakukan setidaknya tiga perdagangan dalam dua tahun terakhir.
Jika profitabilitas perdagangan orang dalam ini adalah "N/A", maka orang dalam tersebut belum melakukan pembelian di pasar terbuka dalam tiga tahun terakhir, atau perdagangan yang mereka lakukan terlalu baru untuk menghitung metrik kinerja yang andal.
Frekuensi Pembaruan: Setiap Hari
Lihat daftar pedagang dalam perusahaan yang paling menguntungkan.
Perusahaan dengan Posisi Orang Dalam yang Dilaporkan
Pengajuan SEC menunjukkan bahwa Insight Holdings Group, LLC telah melaporkan kepemilikan atau perdagangan di perusahaan-perusahaan berikut:
| Keamanan | Judul | Kepemilikan Terakhir yang Dilaporkan |
|---|---|---|
| US:ETWO / E2open Parent Holdings, Inc. | Director, 10% Owner | 0 |
| 10% Owner | 0 | |
| US:NCNO / nCino, Inc. | Director, 10% Owner | 306,042 |
| US:DIBS / 1stdibs.Com, Inc. | 10% Owner | 0 |
| US:S / SentinelOne, Inc. | 10% Owner | 5,764 |
| US:UDMY / Udemy, Inc. | 10% Owner | 24,203,192 |
| US:USER / UserTesting Inc | 10% Owner | 10,500,190 |
| Director, 10% Owner | 0 | |
| US:TENB / Tenable Holdings, Inc. | 10% Owner | 62,114 |
| US:US72941BAA44 / Pluralsight Inc 144a (ps) - Co Bond | 10% Owner | 1,035,274 |
| US:SMAR / Smartsheet Inc. | 10% Owner | 1,391,707 |
| US:AYX / Alteryx, Inc. | 10% Owner | 26,249 |
| US:MIME / Mimecast Ltd | 10% Owner | 19,885 |
| US:TNTR / Tintri, Inc. | 10% Owner | 923,615 |
| US:YEXT / Yext, Inc. | 10% Owner | 0 |
| 10% Owner | 0 | |
| US:CVT / Cvent Holding Corp | 10% Owner | 4,125,810 |
| US:SSTK / Shutterstock, Inc. | 10% Owner | 0 |
| US:CHGG / Chegg, Inc. | 10% Owner | 6,323,440 |
| US:MDSO / Medidata Solutions, Inc. | 10% Owner | 1,844,343 |
| BE:WEB / Warehouses Estates Belgium S.C.A. | 10% Owner | 0 |
Cara Membaca Grafik
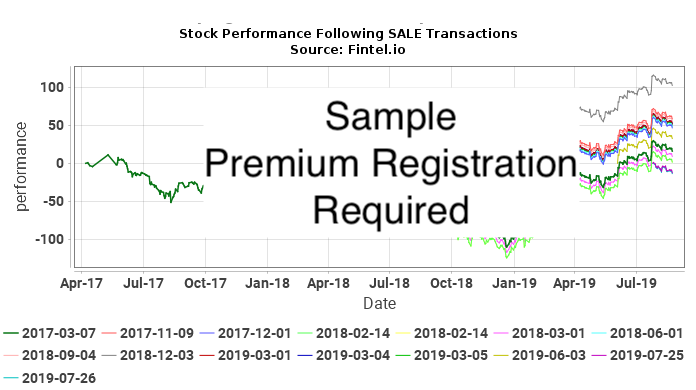
Grafik berikut menunjukkan kinerja saham sekuritas setelah setiap perdagangan pasar terbuka yang tidak direncanakan yang dilakukan oleh Insight Holdings Group, LLC. Perdagangan yang tidak direncanakan adalah perdagangan yang tidak dilakukan sebagai bagian dari rencana perdagangan 10b5-1. Kinerja saham digambarkan sebagai perubahan persentase kumulatif dalam harga saham. Misalnya, jika perdagangan orang dalam dilakukan pada 1 Januari 2019, grafik akan menunjukkan perubahan persentase harian sekuritas hingga saat ini. Jika harga saham naik dari $10 menjadi $15 selama periode ini, perubahan persentase kumulatif dalam harga saham akan menjadi 50%. Perubahan harga dari $10 menjadi $20 akan menjadi 100%, dan perubahan harga dari $10 menjadi $5 akan menjadi -50%.
Pada akhirnya, kita mencoba menentukan seberapa erat korelasi perdagangan orang dalam dengan pengembalian berlebih (positif atau negatif) pada harga saham untuk melihat apakah orang dalam tersebut mengatur waktu perdagangannya untuk mendapatkan keuntungan dari informasi orang dalam. Pertimbangkan situasi di mana orang dalam melakukan hal ini. Dalam situasi ini, kita akan mengharapkan (a) pengembalian positif setelah pembelian, atau (b) pengembalian negatif setelah penjualan. Dalam kasus (a), grafik PEMBELIAN akan menunjukkan serangkaian kurva yang miring ke atas, menunjukkan pengembalian positif setelah setiap transaksi pembelian. Dalam kasus (b), grafik PENJUALAN akan menunjukkan serangkaian kurva yang miring ke bawah, menunjukkan pengembalian negatif setelah setiap transaksi penjualan.
Namun, ini saja tidak cukup untuk menarik kesimpulan. Jika, misalnya, harga saham perusahaan berada dalam tren kenaikan non-siklikal selama bertahun-tahun, maka kita akan mengharapkan semua plot pasca-pembelian memiliki kemiringan ke atas. Demikian pula, penurunan non-siklikal selama bertahun-tahun akan menghasilkan plot pasca-perdagangan dengan kemiringan ke bawah. Tak satu pun dari grafik ini akan menunjukkan aktivitas perdagangan orang dalam.
Indikator terkuat adalah situasi di mana harga saham sangat siklikal, dan terdapat sinyal positif pada grafik PEMBELIAN dan plot negatif pada grafik PENJUALAN. Situasi ini akan sangat menunjukkan adanya orang dalam yang mengatur waktu perdagangan untuk keuntungan finansial mereka.
Pembelian Orang Dalam CHGG / Chegg, Inc. - Analisis Keuntungan Jangka Pendek
Pada bagian ini, kami menganalisis profitabilitas setiap pembelian saham oleh orang dalam di pasar terbuka yang tidak direncanakan yang dilakukan di CHGG / Chegg, Inc.. Analisis ini membantu memahami apakah orang dalam tersebut secara konsisten menghasilkan pengembalian abnormal, dan layak untuk diikuti. Analisis ini dilakukan selama satu tahun setelah setiap transaksi, dan hasilnya bersifat teoritis .
Tabel berikut menunjukkan pembelian pasar terbuka terbaru yang bukan bagian dari rencana perdagangan otomatis.
| Tanggal Perdagangan | Ticker | Orang Dalam | Dilaporkan Saham |
Dilaporkan Harga |
Disesuaikan Saham |
Disesuaikan Harga |
Dasar Biaya | Hari-hari menuju Maksimal |
Harga di Maksimal |
Maksimal Keuntungan ($) |
Maksimum Pengembalian (%) |
|---|---|---|---|---|---|---|---|
| Tidak ada transaksi pasar terbuka tak terduga yang diketahui untuk kombinasi orang dalam dan sekuritas ini. |
Harga yang Disesuaikan adalah harga yang disesuaikan dengan pemisahan saham. Saham yang Disesuaikan adalah saham yang disesuaikan dengan pemisahan saham.
Penjualan Orang Dalam CHGG / Chegg, Inc. - Analisis Kerugian Jangka Pendek
Pada bagian ini, kami menganalisis penghindaran kerugian jangka pendek dari setiap penjualan internal pasar terbuka yang tidak direncanakan yang dilakukan di CHGG / Chegg, Inc.. Pola penghindaran kerugian yang konsisten dapat menunjukkan bahwa transaksi penjualan di masa mendatang dapat memprediksi penurunan harga. Analisis ini berlaku untuk satu tahun setelah setiap perdagangan, dan hasilnya bersifat teoritis .
Tabel berikut menunjukkan penjualan pasar terbuka terbaru yang bukan bagian dari rencana perdagangan otomatis.
| Tanggal Perdagangan | Ticker | Orang Dalam | Dilaporkan Saham |
Dilaporkan Harga |
Disesuaikan Saham |
Disesuaikan Harga |
Dasar Biaya | Hari-hari menuju Menit |
Harga di Menit |
Kerugian Maksimal Dihindari ($) |
Kerugian Maksimal Dihindari (%) |
|---|---|---|---|---|---|---|---|
| Tidak ada transaksi pasar terbuka tak terduga yang diketahui untuk kombinasi orang dalam dan sekuritas ini. |
Harga yang Disesuaikan adalah harga yang disesuaikan dengan pemisahan saham. Saham yang Disesuaikan adalah saham yang disesuaikan dengan pemisahan saham.
Pembelian Orang Dalam DIBS / 1stdibs.Com, Inc. - Analisis Keuntungan Jangka Pendek
Pada bagian ini, kami menganalisis profitabilitas setiap pembelian saham oleh orang dalam di pasar terbuka yang tidak direncanakan yang dilakukan di CHGG / Chegg, Inc.. Analisis ini membantu memahami apakah orang dalam tersebut secara konsisten menghasilkan pengembalian abnormal, dan layak untuk diikuti. Analisis ini dilakukan selama satu tahun setelah setiap transaksi, dan hasilnya bersifat teoritis .
Tabel berikut menunjukkan pembelian pasar terbuka terbaru yang bukan bagian dari rencana perdagangan otomatis.
| Tanggal Perdagangan | Ticker | Orang Dalam | Dilaporkan Saham |
Dilaporkan Harga |
Disesuaikan Saham |
Disesuaikan Harga |
Dasar Biaya | Hari-hari menuju Maksimal |
Harga di Maksimal |
Maksimal Keuntungan ($) |
Maksimum Pengembalian (%) |
|---|---|---|---|---|---|---|---|
| Tidak ada transaksi pasar terbuka tak terduga yang diketahui untuk kombinasi orang dalam dan sekuritas ini. |
Harga yang Disesuaikan adalah harga yang disesuaikan dengan pemisahan saham. Saham yang Disesuaikan adalah saham yang disesuaikan dengan pemisahan saham.
Penjualan Orang Dalam DIBS / 1stdibs.Com, Inc. - Analisis Kerugian Jangka Pendek
Pada bagian ini, kami menganalisis penghindaran kerugian jangka pendek dari setiap penjualan internal pasar terbuka yang tidak direncanakan yang dilakukan di CHGG / Chegg, Inc.. Pola penghindaran kerugian yang konsisten dapat menunjukkan bahwa transaksi penjualan di masa mendatang dapat memprediksi penurunan harga. Analisis ini berlaku untuk satu tahun setelah setiap perdagangan, dan hasilnya bersifat teoritis .
Tabel berikut menunjukkan penjualan pasar terbuka terbaru yang bukan bagian dari rencana perdagangan otomatis.
Harga yang Disesuaikan adalah harga yang disesuaikan dengan pemisahan saham. Saham yang Disesuaikan adalah saham yang disesuaikan dengan pemisahan saham.
Pembelian Orang Dalam NCNO / nCino, Inc. - Analisis Keuntungan Jangka Pendek
Pada bagian ini, kami menganalisis profitabilitas setiap pembelian saham oleh orang dalam di pasar terbuka yang tidak direncanakan yang dilakukan di CHGG / Chegg, Inc.. Analisis ini membantu memahami apakah orang dalam tersebut secara konsisten menghasilkan pengembalian abnormal, dan layak untuk diikuti. Analisis ini dilakukan selama satu tahun setelah setiap transaksi, dan hasilnya bersifat teoritis .
Tabel berikut menunjukkan pembelian pasar terbuka terbaru yang bukan bagian dari rencana perdagangan otomatis.
| Tanggal Perdagangan | Ticker | Orang Dalam | Dilaporkan Saham |
Dilaporkan Harga |
Disesuaikan Saham |
Disesuaikan Harga |
Dasar Biaya | Hari-hari menuju Maksimal |
Harga di Maksimal |
Maksimal Keuntungan ($) |
Maksimum Pengembalian (%) |
|---|---|---|---|---|---|---|---|
| Tidak ada transaksi pasar terbuka tak terduga yang diketahui untuk kombinasi orang dalam dan sekuritas ini. |
Harga yang Disesuaikan adalah harga yang disesuaikan dengan pemisahan saham. Saham yang Disesuaikan adalah saham yang disesuaikan dengan pemisahan saham.
Penjualan Orang Dalam NCNO / nCino, Inc. - Analisis Kerugian Jangka Pendek
Pada bagian ini, kami menganalisis penghindaran kerugian jangka pendek dari setiap penjualan internal pasar terbuka yang tidak direncanakan yang dilakukan di CHGG / Chegg, Inc.. Pola penghindaran kerugian yang konsisten dapat menunjukkan bahwa transaksi penjualan di masa mendatang dapat memprediksi penurunan harga. Analisis ini berlaku untuk satu tahun setelah setiap perdagangan, dan hasilnya bersifat teoritis .
Tabel berikut menunjukkan penjualan pasar terbuka terbaru yang bukan bagian dari rencana perdagangan otomatis.
Harga yang Disesuaikan adalah harga yang disesuaikan dengan pemisahan saham. Saham yang Disesuaikan adalah saham yang disesuaikan dengan pemisahan saham.
Pembelian Orang Dalam S / SentinelOne, Inc. - Analisis Keuntungan Jangka Pendek
Pada bagian ini, kami menganalisis profitabilitas setiap pembelian saham oleh orang dalam di pasar terbuka yang tidak direncanakan yang dilakukan di CHGG / Chegg, Inc.. Analisis ini membantu memahami apakah orang dalam tersebut secara konsisten menghasilkan pengembalian abnormal, dan layak untuk diikuti. Analisis ini dilakukan selama satu tahun setelah setiap transaksi, dan hasilnya bersifat teoritis .
Tabel berikut menunjukkan pembelian pasar terbuka terbaru yang bukan bagian dari rencana perdagangan otomatis.
Harga yang Disesuaikan adalah harga yang disesuaikan dengan pemisahan saham. Saham yang Disesuaikan adalah saham yang disesuaikan dengan pemisahan saham.
Penjualan Orang Dalam S / SentinelOne, Inc. - Analisis Kerugian Jangka Pendek
Pada bagian ini, kami menganalisis penghindaran kerugian jangka pendek dari setiap penjualan internal pasar terbuka yang tidak direncanakan yang dilakukan di CHGG / Chegg, Inc.. Pola penghindaran kerugian yang konsisten dapat menunjukkan bahwa transaksi penjualan di masa mendatang dapat memprediksi penurunan harga. Analisis ini berlaku untuk satu tahun setelah setiap perdagangan, dan hasilnya bersifat teoritis .
Tabel berikut menunjukkan penjualan pasar terbuka terbaru yang bukan bagian dari rencana perdagangan otomatis.
Harga yang Disesuaikan adalah harga yang disesuaikan dengan pemisahan saham. Saham yang Disesuaikan adalah saham yang disesuaikan dengan pemisahan saham.
Pembelian Orang Dalam SSTK / Shutterstock, Inc. - Analisis Keuntungan Jangka Pendek
Pada bagian ini, kami menganalisis profitabilitas setiap pembelian saham oleh orang dalam di pasar terbuka yang tidak direncanakan yang dilakukan di CHGG / Chegg, Inc.. Analisis ini membantu memahami apakah orang dalam tersebut secara konsisten menghasilkan pengembalian abnormal, dan layak untuk diikuti. Analisis ini dilakukan selama satu tahun setelah setiap transaksi, dan hasilnya bersifat teoritis .
Tabel berikut menunjukkan pembelian pasar terbuka terbaru yang bukan bagian dari rencana perdagangan otomatis.
| Tanggal Perdagangan | Ticker | Orang Dalam | Dilaporkan Saham |
Dilaporkan Harga |
Disesuaikan Saham |
Disesuaikan Harga |
Dasar Biaya | Hari-hari menuju Maksimal |
Harga di Maksimal |
Maksimal Keuntungan ($) |
Maksimum Pengembalian (%) |
|---|---|---|---|---|---|---|---|
| Tidak ada transaksi pasar terbuka tak terduga yang diketahui untuk kombinasi orang dalam dan sekuritas ini. |
Harga yang Disesuaikan adalah harga yang disesuaikan dengan pemisahan saham. Saham yang Disesuaikan adalah saham yang disesuaikan dengan pemisahan saham.
Penjualan Orang Dalam SSTK / Shutterstock, Inc. - Analisis Kerugian Jangka Pendek
Pada bagian ini, kami menganalisis penghindaran kerugian jangka pendek dari setiap penjualan internal pasar terbuka yang tidak direncanakan yang dilakukan di CHGG / Chegg, Inc.. Pola penghindaran kerugian yang konsisten dapat menunjukkan bahwa transaksi penjualan di masa mendatang dapat memprediksi penurunan harga. Analisis ini berlaku untuk satu tahun setelah setiap perdagangan, dan hasilnya bersifat teoritis .
Tabel berikut menunjukkan penjualan pasar terbuka terbaru yang bukan bagian dari rencana perdagangan otomatis.
| Tanggal Perdagangan | Ticker | Orang Dalam | Dilaporkan Saham |
Dilaporkan Harga |
Disesuaikan Saham |
Disesuaikan Harga |
Dasar Biaya | Hari-hari menuju Menit |
Harga di Menit |
Kerugian Maksimal Dihindari ($) |
Kerugian Maksimal Dihindari (%) |
|---|---|---|---|---|---|---|---|
| Tidak ada transaksi pasar terbuka tak terduga yang diketahui untuk kombinasi orang dalam dan sekuritas ini. |
Harga yang Disesuaikan adalah harga yang disesuaikan dengan pemisahan saham. Saham yang Disesuaikan adalah saham yang disesuaikan dengan pemisahan saham.
Pembelian Orang Dalam TENB / Tenable Holdings, Inc. - Analisis Keuntungan Jangka Pendek
Pada bagian ini, kami menganalisis profitabilitas setiap pembelian saham oleh orang dalam di pasar terbuka yang tidak direncanakan yang dilakukan di CHGG / Chegg, Inc.. Analisis ini membantu memahami apakah orang dalam tersebut secara konsisten menghasilkan pengembalian abnormal, dan layak untuk diikuti. Analisis ini dilakukan selama satu tahun setelah setiap transaksi, dan hasilnya bersifat teoritis .
Tabel berikut menunjukkan pembelian pasar terbuka terbaru yang bukan bagian dari rencana perdagangan otomatis.
| Tanggal Perdagangan | Ticker | Orang Dalam | Dilaporkan Saham |
Dilaporkan Harga |
Disesuaikan Saham |
Disesuaikan Harga |
Dasar Biaya | Hari-hari menuju Maksimal |
Harga di Maksimal |
Maksimal Keuntungan ($) |
Maksimum Pengembalian (%) |
|---|---|---|---|---|---|---|---|
| Tidak ada transaksi pasar terbuka tak terduga yang diketahui untuk kombinasi orang dalam dan sekuritas ini. |
Harga yang Disesuaikan adalah harga yang disesuaikan dengan pemisahan saham. Saham yang Disesuaikan adalah saham yang disesuaikan dengan pemisahan saham.
Penjualan Orang Dalam TENB / Tenable Holdings, Inc. - Analisis Kerugian Jangka Pendek
Pada bagian ini, kami menganalisis penghindaran kerugian jangka pendek dari setiap penjualan internal pasar terbuka yang tidak direncanakan yang dilakukan di CHGG / Chegg, Inc.. Pola penghindaran kerugian yang konsisten dapat menunjukkan bahwa transaksi penjualan di masa mendatang dapat memprediksi penurunan harga. Analisis ini berlaku untuk satu tahun setelah setiap perdagangan, dan hasilnya bersifat teoritis .
Tabel berikut menunjukkan penjualan pasar terbuka terbaru yang bukan bagian dari rencana perdagangan otomatis.
Harga yang Disesuaikan adalah harga yang disesuaikan dengan pemisahan saham. Saham yang Disesuaikan adalah saham yang disesuaikan dengan pemisahan saham.
Pembelian Orang Dalam UDMY / Udemy, Inc. - Analisis Keuntungan Jangka Pendek
Pada bagian ini, kami menganalisis profitabilitas setiap pembelian saham oleh orang dalam di pasar terbuka yang tidak direncanakan yang dilakukan di CHGG / Chegg, Inc.. Analisis ini membantu memahami apakah orang dalam tersebut secara konsisten menghasilkan pengembalian abnormal, dan layak untuk diikuti. Analisis ini dilakukan selama satu tahun setelah setiap transaksi, dan hasilnya bersifat teoritis .
Tabel berikut menunjukkan pembelian pasar terbuka terbaru yang bukan bagian dari rencana perdagangan otomatis.
| Tanggal Perdagangan | Ticker | Orang Dalam | Dilaporkan Saham |
Dilaporkan Harga |
Disesuaikan Saham |
Disesuaikan Harga |
Dasar Biaya | Hari-hari menuju Maksimal |
Harga di Maksimal |
Maksimal Keuntungan ($) |
Maksimum Pengembalian (%) |
|---|---|---|---|---|---|---|---|
| Tidak ada transaksi pasar terbuka tak terduga yang diketahui untuk kombinasi orang dalam dan sekuritas ini. |
Harga yang Disesuaikan adalah harga yang disesuaikan dengan pemisahan saham. Saham yang Disesuaikan adalah saham yang disesuaikan dengan pemisahan saham.
Penjualan Orang Dalam UDMY / Udemy, Inc. - Analisis Kerugian Jangka Pendek
Pada bagian ini, kami menganalisis penghindaran kerugian jangka pendek dari setiap penjualan internal pasar terbuka yang tidak direncanakan yang dilakukan di CHGG / Chegg, Inc.. Pola penghindaran kerugian yang konsisten dapat menunjukkan bahwa transaksi penjualan di masa mendatang dapat memprediksi penurunan harga. Analisis ini berlaku untuk satu tahun setelah setiap perdagangan, dan hasilnya bersifat teoritis .
Tabel berikut menunjukkan penjualan pasar terbuka terbaru yang bukan bagian dari rencana perdagangan otomatis.
| Tanggal Perdagangan | Ticker | Orang Dalam | Dilaporkan Saham |
Dilaporkan Harga |
Disesuaikan Saham |
Disesuaikan Harga |
Dasar Biaya | Hari-hari menuju Menit |
Harga di Menit |
Kerugian Maksimal Dihindari ($) |
Kerugian Maksimal Dihindari (%) |
|---|---|---|---|---|---|---|---|
| Tidak ada transaksi pasar terbuka tak terduga yang diketahui untuk kombinasi orang dalam dan sekuritas ini. |
Harga yang Disesuaikan adalah harga yang disesuaikan dengan pemisahan saham. Saham yang Disesuaikan adalah saham yang disesuaikan dengan pemisahan saham.
Pembelian Orang Dalam YEXT / Yext, Inc. - Analisis Keuntungan Jangka Pendek
Pada bagian ini, kami menganalisis profitabilitas setiap pembelian saham oleh orang dalam di pasar terbuka yang tidak direncanakan yang dilakukan di CHGG / Chegg, Inc.. Analisis ini membantu memahami apakah orang dalam tersebut secara konsisten menghasilkan pengembalian abnormal, dan layak untuk diikuti. Analisis ini dilakukan selama satu tahun setelah setiap transaksi, dan hasilnya bersifat teoritis .
Tabel berikut menunjukkan pembelian pasar terbuka terbaru yang bukan bagian dari rencana perdagangan otomatis.
| Tanggal Perdagangan | Ticker | Orang Dalam | Dilaporkan Saham |
Dilaporkan Harga |
Disesuaikan Saham |
Disesuaikan Harga |
Dasar Biaya | Hari-hari menuju Maksimal |
Harga di Maksimal |
Maksimal Keuntungan ($) |
Maksimum Pengembalian (%) |
|---|---|---|---|---|---|---|---|
| Tidak ada transaksi pasar terbuka tak terduga yang diketahui untuk kombinasi orang dalam dan sekuritas ini. |
Harga yang Disesuaikan adalah harga yang disesuaikan dengan pemisahan saham. Saham yang Disesuaikan adalah saham yang disesuaikan dengan pemisahan saham.
Penjualan Orang Dalam YEXT / Yext, Inc. - Analisis Kerugian Jangka Pendek
Pada bagian ini, kami menganalisis penghindaran kerugian jangka pendek dari setiap penjualan internal pasar terbuka yang tidak direncanakan yang dilakukan di CHGG / Chegg, Inc.. Pola penghindaran kerugian yang konsisten dapat menunjukkan bahwa transaksi penjualan di masa mendatang dapat memprediksi penurunan harga. Analisis ini berlaku untuk satu tahun setelah setiap perdagangan, dan hasilnya bersifat teoritis .
Tabel berikut menunjukkan penjualan pasar terbuka terbaru yang bukan bagian dari rencana perdagangan otomatis.
| Tanggal Perdagangan | Ticker | Orang Dalam | Dilaporkan Saham |
Dilaporkan Harga |
Disesuaikan Saham |
Disesuaikan Harga |
Dasar Biaya | Hari-hari menuju Menit |
Harga di Menit |
Kerugian Maksimal Dihindari ($) |
Kerugian Maksimal Dihindari (%) |
|---|---|---|---|---|---|---|---|
| Tidak ada transaksi pasar terbuka tak terduga yang diketahui untuk kombinasi orang dalam dan sekuritas ini. |
Harga yang Disesuaikan adalah harga yang disesuaikan dengan pemisahan saham. Saham yang Disesuaikan adalah saham yang disesuaikan dengan pemisahan saham.
Sejarah Perdagangan Orang Dalam
Tabel ini menunjukkan daftar lengkap transaksi orang dalam yang dilakukan oleh Insight Holdings Group, LLC sebagaimana diungkapkan kepada Komisi Bursa Efek (Securities Exchange Commission/SEC).
| Tanggal File | Tanggal Transaksi | Formulir | Ticker | Keamanan | Kode | Saham | Sisa Saham | Persen Ubah |
Bagikan Harga |
Tran Nilai |
Sisa Nilai |
|
|---|---|---|---|---|---|---|---|---|---|---|---|---|
| 2025-08-05 |
|
4 | ETWO |
E2open Parent Holdings, Inc.
Common Stock |
S - Sale | -4,800,596 | 0 | -100.00 | 3.30 | -15,841,967 | ||
| 2025-08-05 |
|
4 | ETWO |
E2open Parent Holdings, Inc.
Common Stock |
S - Sale | -5,220,857 | 0 | -100.00 | 3.30 | -17,228,828 | ||
| 2025-08-05 |
|
4 | ETWO |
E2open Parent Holdings, Inc.
Common Stock |
S - Sale | -1,789,373 | 0 | -100.00 | 3.30 | -5,904,931 | ||
| 2025-08-05 |
|
4 | ETWO |
E2open Parent Holdings, Inc.
Common Stock |
S - Sale | -8,391,675 | 0 | -100.00 | 3.30 | -27,692,528 | ||
| 2025-08-05 |
|
4 | ETWO |
E2open Parent Holdings, Inc.
Common Stock |
S - Sale | -29,628,506 | 0 | -100.00 | 3.30 | -97,774,070 | ||
| 2025-05-27 |
|
4 | HNGE |
Hinge Health, Inc.
Class A Common Stock |
S - Sale | -1,250,000 | 0 | -100.00 | 32.00 | -40,000,000 | ||
| 2025-05-27 |
|
4 | HNGE |
Hinge Health, Inc.
Class A Common Stock |
C - Conversion | 1,250,000 | 1,250,000 | |||||
| 2024-12-11 |
|
4 | NCNO |
nCino, Inc.
Common Stock |
S - Sale | -30,892 | 306,042 | -9.17 | 36.18 | -1,117,564 | 11,071,528 | |
| 2024-12-11 |
|
4 | NCNO |
nCino, Inc.
Common Stock |
S - Sale | -144,874 | 1,435,253 | -9.17 | 36.18 | -5,241,034 | 51,922,430 | |
| 2024-12-11 |
|
4 | NCNO |
nCino, Inc.
Common Stock |
S - Sale | -5,820 | 57,660 | -9.17 | 36.18 | -210,547 | 2,085,937 | |
| 2024-12-11 |
|
4 | NCNO |
nCino, Inc.
Common Stock |
S - Sale | -291,571 | 2,888,551 | -9.17 | 36.18 | -10,548,018 | 104,497,665 | |
| 2024-12-11 |
|
4 | NCNO |
nCino, Inc.
Common Stock |
S - Sale | -12,569 | 336,934 | -3.60 | 37.27 | -468,391 | 12,556,048 | |
| 2024-12-11 |
|
4 | NCNO |
nCino, Inc.
Common Stock |
S - Sale | -58,943 | 1,580,127 | -3.60 | 37.27 | -2,196,546 | 58,884,381 | |
| 2024-12-11 |
|
4 | NCNO |
nCino, Inc.
Common Stock |
S - Sale | -2,368 | 63,480 | -3.60 | 37.27 | -88,245 | 2,365,620 | |
| 2024-12-11 |
|
4 | NCNO |
nCino, Inc.
Common Stock |
S - Sale | -118,627 | 3,180,122 | -3.60 | 37.27 | -4,420,706 | 118,509,154 | |
| 2024-12-11 |
|
4 | NCNO |
nCino, Inc.
Common Stock |
S - Sale | -60,583 | 846,672 | -6.68 | 36.18 | -2,191,681 | 30,629,630 | |
| 2024-12-11 |
|
4 | NCNO |
nCino, Inc.
Common Stock |
S - Sale | -17,723 | 175,585 | -9.17 | 36.18 | -641,156 | 6,352,051 | |
| 2024-12-11 |
|
4 | NCNO |
nCino, Inc.
Common Stock |
S - Sale | -91,622 | 907,693 | -9.17 | 36.18 | -3,314,563 | 32,837,156 | |
| 2024-12-11 |
|
4 | NCNO |
nCino, Inc.
Common Stock |
S - Sale | -53,809 | 286,590 | -15.81 | 36.18 | -1,946,621 | 10,367,823 | |
| 2024-12-11 |
|
4 | NCNO |
nCino, Inc.
Common Stock |
S - Sale | -24,649 | 907,255 | -2.65 | 37.27 | -918,560 | 33,809,402 | |
| 2024-12-11 |
|
4 | NCNO |
nCino, Inc.
Common Stock |
S - Sale | -7,211 | 193,308 | -3.60 | 37.27 | -268,722 | 7,203,739 | |
| 2024-12-11 |
|
4 | NCNO |
nCino, Inc.
Common Stock |
S - Sale | -37,277 | 999,315 | -3.60 | 37.27 | -1,389,150 | 37,240,073 | |
| 2024-12-11 |
|
4 | NCNO |
nCino, Inc.
Common Stock |
S - Sale | -21,892 | 340,399 | -6.04 | 37.27 | -815,819 | 12,685,173 | |
| 2024-12-11 |
|
4 | NCNO |
nCino, Inc.
Common Stock |
S - Sale | -107,805 | 1,068,014 | -9.17 | 36.18 | -3,900,008 | 38,637,008 | |
| 2024-12-11 |
|
4 | NCNO |
nCino, Inc.
Common Stock |
S - Sale | -87,592 | 867,760 | -9.17 | 36.18 | -3,168,772 | 31,392,520 | |
| 2024-12-11 |
|
4 | NCNO |
nCino, Inc.
Common Stock |
S - Sale | -95,260 | 943,728 | -9.17 | 36.18 | -3,446,173 | 34,140,776 | |
| 2024-12-11 |
|
4 | NCNO |
nCino, Inc.
Common Stock |
S - Sale | -118,491 | 1,173,877 | -9.17 | 36.18 | -4,286,590 | 42,466,761 | |
| 2024-12-11 |
|
4 | NCNO |
nCino, Inc.
Common Stock |
S - Sale | -43,861 | 1,175,819 | -3.60 | 37.27 | -1,634,506 | 43,817,601 | |
| 2024-12-11 |
|
4 | NCNO |
nCino, Inc.
Common Stock |
S - Sale | -35,637 | 955,352 | -3.60 | 37.27 | -1,328,034 | 35,601,765 | |
| 2024-12-11 |
|
4 | NCNO |
nCino, Inc.
Common Stock |
S - Sale | -38,757 | 1,038,988 | -3.60 | 37.27 | -1,444,303 | 38,718,511 | |
| 2024-12-11 |
|
4 | NCNO |
nCino, Inc.
Common Stock |
S - Sale | -48,209 | 1,292,368 | -3.60 | 37.27 | -1,796,537 | 48,160,869 | |
| 2024-10-21 |
|
4 | NCNO |
nCino, Inc.
Common Stock |
S - Sale | -51,223 | 349,503 | -12.78 | 36.62 | -1,875,960 | 12,799,988 | |
| 2024-10-21 |
|
4 | NCNO |
nCino, Inc.
Common Stock |
S - Sale | -240,222 | 1,639,070 | -12.78 | 36.62 | -8,797,746 | 60,028,316 | |
| 2024-10-21 |
|
4 | NCNO |
nCino, Inc.
Common Stock |
S - Sale | -9,650 | 65,848 | -12.78 | 36.62 | -353,416 | 2,411,578 | |
| 2024-10-21 |
|
4 | NCNO |
nCino, Inc.
Common Stock |
S - Sale | -483,466 | 3,298,749 | -12.78 | 36.62 | -17,706,169 | 120,811,404 | |
| 2024-10-21 |
|
4 | NCNO |
nCino, Inc.
Common Stock |
S - Sale | -100,455 | 931,904 | -9.73 | 36.62 | -3,679,004 | 34,129,493 | |
| 2024-10-21 |
|
4 | NCNO |
nCino, Inc.
Common Stock |
S - Sale | -29,388 | 200,519 | -12.78 | 36.62 | -1,076,288 | 7,343,688 | |
| 2024-10-21 |
|
4 | NCNO |
nCino, Inc.
Common Stock |
S - Sale | -151,923 | 1,036,592 | -12.78 | 36.62 | -5,563,937 | 37,963,523 | |
| 2024-10-21 |
|
4 | NCNO |
nCino, Inc.
Common Stock |
S - Sale | -89,222 | 362,291 | -19.76 | 36.62 | -3,267,613 | 13,268,328 | |
| 2024-10-21 |
|
4 | NCNO |
nCino, Inc.
Common Stock |
S - Sale | -178,756 | 1,219,680 | -12.78 | 36.62 | -6,546,652 | 44,668,829 | |
| 2024-10-21 |
|
4 | NCNO |
nCino, Inc.
Common Stock |
S - Sale | -145,240 | 990,989 | -12.78 | 36.62 | -5,319,183 | 36,293,387 | |
| 2024-10-21 |
|
4 | NCNO |
nCino, Inc.
Common Stock |
S - Sale | -157,955 | 1,077,745 | -12.78 | 36.62 | -5,784,849 | 39,470,686 | |
| 2024-10-21 |
|
4 | NCNO |
nCino, Inc.
Common Stock |
S - Sale | -196,475 | 1,340,577 | -12.78 | 36.62 | -7,195,583 | 49,096,488 | |
| 2024-10-18 |
|
4 | NCNO |
nCino, Inc.
Common Stock |
S - Sale | -30,148 | 1,398,436 | -2.11 | 36.16 | -1,090,143 | 50,567,026 | |
| 2024-10-18 |
|
4 | NCNO |
nCino, Inc.
Common Stock |
S - Sale | -24,495 | 1,136,229 | -2.11 | 36.16 | -885,732 | 41,085,700 | |
| 2024-10-18 |
|
4 | NCNO |
nCino, Inc.
Common Stock |
S - Sale | -26,639 | 1,235,700 | -2.11 | 36.16 | -963,258 | 44,682,541 | |
| 2024-10-18 |
|
4 | NCNO |
nCino, Inc.
Common Stock |
S - Sale | -33,136 | 1,537,052 | -2.11 | 36.16 | -1,198,188 | 55,579,339 | |
| 2024-10-18 |
|
4 | NCNO |
nCino, Inc.
Common Stock |
S - Sale | -132,239 | 1,428,584 | -8.47 | 36.02 | -4,763,302 | 51,458,167 | |
| 2024-10-18 |
|
4 | NCNO |
nCino, Inc.
Common Stock |
S - Sale | -107,444 | 1,160,724 | -8.47 | 36.02 | -3,870,176 | 41,809,743 | |
| 2024-10-18 |
|
4 | NCNO |
nCino, Inc.
Common Stock |
S - Sale | -116,850 | 1,262,339 | -8.47 | 36.02 | -4,208,984 | 45,469,956 | |
| 2024-10-18 |
|
4 | NCNO |
nCino, Inc.
Common Stock |
S - Sale | -145,346 | 1,570,188 | -8.47 | 36.02 | -5,235,421 | 56,558,800 | |
| 2024-10-18 |
|
4 | NCNO |
nCino, Inc.
Common Stock |
S - Sale | -16,942 | 1,032,359 | -1.61 | 36.16 | -612,618 | 37,329,792 | |
| 2024-10-18 |
|
4 | NCNO |
nCino, Inc.
Common Stock |
S - Sale | -4,956 | 229,907 | -2.11 | 36.16 | -179,207 | 8,313,368 | |
| 2024-10-18 |
|
4 | NCNO |
nCino, Inc.
Common Stock |
S - Sale | -25,622 | 1,188,515 | -2.11 | 36.16 | -926,484 | 42,976,346 | |
| 2024-10-18 |
|
4 | NCNO |
nCino, Inc.
Common Stock |
S - Sale | -15,048 | 451,513 | -3.23 | 36.16 | -544,131 | 16,326,575 | |
| 2024-10-18 |
|
4 | NCNO |
nCino, Inc.
Common Stock |
S - Sale | -74,314 | 1,049,301 | -6.61 | 36.02 | -2,676,820 | 37,796,242 | |
| 2024-10-18 |
|
4 | NCNO |
nCino, Inc.
Common Stock |
S - Sale | -21,740 | 234,863 | -8.47 | 36.02 | -783,083 | 8,459,859 | |
| 2024-10-18 |
|
4 | NCNO |
nCino, Inc.
Common Stock |
S - Sale | -112,388 | 1,214,137 | -8.47 | 36.02 | -4,048,261 | 43,733,700 | |
| 2024-10-18 |
|
4 | NCNO |
nCino, Inc.
Common Stock |
S - Sale | -66,004 | 466,561 | -12.39 | 36.02 | -2,377,490 | 16,805,714 | |
| 2024-10-18 |
|
4 | NCNO |
nCino, Inc.
Common Stock |
S - Sale | -8,639 | 400,726 | -2.11 | 36.16 | -312,384 | 14,490,132 | |
| 2024-10-18 |
|
4 | NCNO |
nCino, Inc.
Common Stock |
S - Sale | -40,514 | 1,879,292 | -2.11 | 36.16 | -1,464,974 | 67,954,635 | |
| 2024-10-18 |
|
4 | NCNO |
nCino, Inc.
Common Stock |
S - Sale | -1,628 | 75,498 | -2.11 | 36.16 | -58,868 | 2,729,985 | |
| 2024-10-18 |
|
4 | NCNO |
nCino, Inc.
Common Stock |
S - Sale | -81,537 | 3,782,215 | -2.11 | 36.16 | -2,948,353 | 136,763,760 | |
| 2024-10-18 |
|
4 | NCNO |
nCino, Inc.
Common Stock |
S - Sale | -37,893 | 409,365 | -8.47 | 36.02 | -1,364,921 | 14,745,491 | |
| 2024-10-18 |
|
4 | NCNO |
nCino, Inc.
Common Stock |
S - Sale | -177,709 | 1,919,806 | -8.47 | 36.02 | -6,401,149 | 69,152,180 | |
| 2024-10-18 |
|
4 | NCNO |
nCino, Inc.
Common Stock |
S - Sale | -7,139 | 77,126 | -8.47 | 36.02 | -257,150 | 2,778,109 | |
| 2024-10-18 |
|
4 | NCNO |
nCino, Inc.
Common Stock |
S - Sale | -357,655 | 3,863,752 | -8.47 | 36.02 | -12,882,876 | 139,173,893 | |
| 2024-08-16 |
|
4 | NCNO |
nCino, Inc.
Common Stock |
S - Sale | -17,776 | 447,258 | -3.82 | 33.50 | -595,583 | 14,985,335 | |
| 2024-08-16 |
|
4 | NCNO |
nCino, Inc.
Common Stock |
S - Sale | -83,369 | 2,097,515 | -3.82 | 33.50 | -2,793,270 | 70,277,030 | |
| 2024-08-16 |
|
4 | NCNO |
nCino, Inc.
Common Stock |
S - Sale | -3,349 | 84,265 | -3.82 | 33.50 | -112,208 | 2,823,290 | |
| 2024-08-16 |
|
4 | NCNO |
nCino, Inc.
Common Stock |
S - Sale | -167,786 | 4,221,407 | -3.82 | 33.50 | -5,621,653 | 141,437,819 | |
| 2024-08-16 |
|
4 | NCNO |
nCino, Inc.
Common Stock |
S - Sale | -22,344 | 465,034 | -4.58 | 33.16 | -740,869 | 15,419,318 | |
| 2024-08-16 |
|
4 | NCNO |
nCino, Inc.
Common Stock |
S - Sale | -104,788 | 2,180,884 | -4.58 | 33.16 | -3,474,498 | 72,312,443 | |
| 2024-08-16 |
|
4 | NCNO |
nCino, Inc.
Common Stock |
S - Sale | -4,210 | 87,614 | -4.58 | 33.16 | -139,593 | 2,905,052 | |
| 2024-08-16 |
|
4 | NCNO |
nCino, Inc.
Common Stock |
S - Sale | -210,892 | 4,389,193 | -4.58 | 33.16 | -6,992,630 | 145,534,228 | |
| 2024-08-16 |
|
4 | NCNO |
nCino, Inc.
Common Stock |
S - Sale | -34,862 | 1,123,615 | -3.01 | 33.50 | -1,168,048 | 37,646,608 | |
| 2024-08-16 |
|
4 | NCNO |
nCino, Inc.
Common Stock |
S - Sale | -10,201 | 256,603 | -3.82 | 33.50 | -341,783 | 8,597,458 | |
| 2024-08-16 |
|
4 | NCNO |
nCino, Inc.
Common Stock |
S - Sale | -52,724 | 1,326,525 | -3.82 | 33.50 | -1,766,512 | 44,445,087 | |
| 2024-08-16 |
|
4 | NCNO |
nCino, Inc.
Common Stock |
S - Sale | -30,964 | 532,565 | -5.49 | 33.50 | -1,037,446 | 17,843,537 | |
| 2024-08-16 |
|
4 | NCNO |
nCino, Inc.
Common Stock |
S - Sale | -43,820 | 1,158,477 | -3.64 | 33.16 | -1,452,957 | 38,412,085 | |
| 2024-08-16 |
|
4 | NCNO |
nCino, Inc.
Common Stock |
S - Sale | -12,819 | 266,804 | -4.58 | 33.16 | -425,045 | 8,846,527 | |
| 2024-08-16 |
|
4 | NCNO |
nCino, Inc.
Common Stock |
S - Sale | -66,271 | 1,379,249 | -4.58 | 33.16 | -2,197,374 | 45,732,311 | |
| 2024-08-16 |
|
4 | NCNO |
nCino, Inc.
Common Stock |
S - Sale | -38,920 | 563,529 | -6.46 | 33.16 | -1,290,486 | 18,685,156 | |
| 2024-08-16 |
|
4 | NCNO |
nCino, Inc.
Common Stock |
S - Sale | -62,036 | 1,560,823 | -3.82 | 33.50 | -2,078,510 | 52,295,219 | |
| 2024-08-16 |
|
4 | NCNO |
nCino, Inc.
Common Stock |
S - Sale | -50,406 | 1,268,168 | -3.82 | 33.50 | -1,688,848 | 42,489,842 | |
| 2024-08-16 |
|
4 | NCNO |
nCino, Inc.
Common Stock |
S - Sale | -54,817 | 1,379,189 | -3.82 | 33.50 | -1,836,638 | 46,209,590 | |
| 2024-08-16 |
|
4 | NCNO |
nCino, Inc.
Common Stock |
S - Sale | -68,185 | 1,715,534 | -3.82 | 33.50 | -2,284,532 | 57,478,795 | |
| 2024-08-16 |
|
4 | NCNO |
nCino, Inc.
Common Stock |
S - Sale | -77,976 | 1,622,859 | -4.58 | 33.16 | -2,585,481 | 53,809,785 | |
| 2024-08-16 |
|
4 | NCNO |
nCino, Inc.
Common Stock |
S - Sale | -63,355 | 1,318,574 | -4.58 | 33.16 | -2,100,687 | 43,720,486 | |
| 2024-08-16 |
|
4 | NCNO |
nCino, Inc.
Common Stock |
S - Sale | -68,902 | 1,434,006 | -4.58 | 33.16 | -2,284,611 | 47,547,911 | |
| 2024-08-16 |
|
4 | NCNO |
nCino, Inc.
Common Stock |
S - Sale | -85,705 | 1,783,719 | -4.58 | 33.16 | -2,841,755 | 59,143,484 | |
| 2024-08-01 |
|
4 | NCNO |
nCino, Inc.
Common Stock |
S - Sale | -1,275 | 487,378 | -0.26 | 33.11 | -42,210 | 16,135,039 | |
| 2024-08-01 |
|
4 | NCNO |
nCino, Inc.
Common Stock |
S - Sale | -5,978 | 2,285,672 | -0.26 | 33.11 | -197,906 | 75,669,000 | |
| 2024-08-01 |
|
4 | NCNO |
nCino, Inc.
Common Stock |
S - Sale | -240 | 91,824 | -0.26 | 33.11 | -7,945 | 3,039,907 | |
| 2024-08-01 |
|
4 | NCNO |
nCino, Inc.
Common Stock |
S - Sale | -12,031 | 4,600,085 | -0.26 | 33.11 | -398,296 | 152,289,494 | |
| 2024-08-01 |
|
4 | NCNO |
nCino, Inc.
Common Stock |
S - Sale | -195 | 488,653 | -0.04 | 33.32 | -6,498 | 16,284,361 | |
| 2024-08-01 |
|
4 | NCNO |
nCino, Inc.
Common Stock |
S - Sale | -916 | 2,291,650 | -0.04 | 33.32 | -30,526 | 76,369,236 | |
| 2024-08-01 |
|
4 | NCNO |
nCino, Inc.
Common Stock |
S - Sale | -37 | 92,064 | -0.04 | 33.32 | -1,233 | 3,068,033 | |
| 2024-08-01 |
|
4 | NCNO |
nCino, Inc.
Common Stock |
S - Sale | -1,843 | 4,612,116 | -0.04 | 33.32 | -61,418 | 153,698,766 | |
| 2024-08-01 |
|
4 | NCNO |
nCino, Inc.
Common Stock |
S - Sale | -2,500 | 1,202,297 | -0.21 | 33.11 | -82,764 | 39,803,004 | |
| 2024-08-01 |
|
4 | NCNO |
nCino, Inc.
Common Stock |
S - Sale | -731 | 279,623 | -0.26 | 33.11 | -24,200 | 9,257,143 | |
| 2024-08-01 |
|
4 | NCNO |
nCino, Inc.
Common Stock |
S - Sale | -3,781 | 1,445,520 | -0.26 | 33.11 | -125,173 | 47,855,096 | |
| 2024-08-01 |
|
4 | NCNO |
nCino, Inc.
Common Stock |
S - Sale | -2,220 | 602,449 | -0.37 | 33.11 | -73,495 | 19,944,556 | |
| 2024-08-01 |
|
4 | NCNO |
nCino, Inc.
Common Stock |
S - Sale | -383 | 1,204,797 | -0.03 | 33.32 | -12,763 | 40,149,860 | |
| 2024-08-01 |
|
4 | NCNO |
nCino, Inc.
Common Stock |
S - Sale | -112 | 280,354 | -0.04 | 33.32 | -3,732 | 9,342,797 | |
| 2024-08-01 |
|
4 | NCNO |
nCino, Inc.
Common Stock |
S - Sale | -579 | 1,449,301 | -0.04 | 33.32 | -19,295 | 48,297,956 | |
| 2024-08-01 |
|
4 | NCNO |
nCino, Inc.
Common Stock |
S - Sale | -340 | 604,669 | -0.06 | 33.32 | -11,330 | 20,150,594 | |
| 2024-08-01 |
|
4 | NCNO |
nCino, Inc.
Common Stock |
S - Sale | -4,448 | 1,700,835 | -0.26 | 33.11 | -147,255 | 56,307,503 | |
| 2024-08-01 |
|
4 | NCNO |
nCino, Inc.
Common Stock |
S - Sale | -3,614 | 1,381,929 | -0.26 | 33.11 | -119,644 | 45,749,865 | |
| 2024-08-01 |
|
4 | NCNO |
nCino, Inc.
Common Stock |
S - Sale | -3,931 | 1,502,908 | -0.26 | 33.11 | -130,139 | 49,754,972 | |
| 2024-08-01 |
|
4 | NCNO |
nCino, Inc.
Common Stock |
S - Sale | -4,889 | 1,869,424 | -0.26 | 33.11 | -161,854 | 61,888,777 | |
| 2024-08-01 |
|
4 | NCNO |
nCino, Inc.
Common Stock |
S - Sale | -682 | 1,705,283 | -0.04 | 33.32 | -22,728 | 56,828,556 | |
| 2024-08-01 |
|
4 | NCNO |
nCino, Inc.
Common Stock |
S - Sale | -554 | 1,385,543 | -0.04 | 33.32 | -18,462 | 46,173,220 | |
| 2024-08-01 |
|
4 | NCNO |
nCino, Inc.
Common Stock |
S - Sale | -602 | 1,506,839 | -0.04 | 33.32 | -20,062 | 50,215,410 | |
| 2024-08-01 |
|
4 | NCNO |
nCino, Inc.
Common Stock |
S - Sale | -749 | 1,874,313 | -0.04 | 33.32 | -24,960 | 62,461,481 | |
| 2024-07-30 |
|
4 | NCNO |
nCino, Inc.
Common Stock |
S - Sale | -1,397 | 488,848 | -0.28 | 33.30 | -46,516 | 16,277,221 | |
| 2024-07-30 |
|
4 | NCNO |
nCino, Inc.
Common Stock |
S - Sale | -6,549 | 2,292,566 | -0.28 | 33.30 | -218,063 | 76,335,799 | |
| 2024-07-30 |
|
4 | NCNO |
nCino, Inc.
Common Stock |
S - Sale | -263 | 92,101 | -0.28 | 33.30 | -8,757 | 3,066,696 | |
| 2024-07-30 |
|
4 | NCNO |
nCino, Inc.
Common Stock |
S - Sale | -13,181 | 4,613,959 | -0.28 | 33.30 | -438,889 | 153,631,454 | |
| 2024-07-30 |
|
4 | NCNO |
nCino, Inc.
Common Stock |
S - Sale | -25,741 | 490,245 | -4.99 | 33.50 | -862,213 | 16,421,099 | |
| 2024-07-30 |
|
4 | NCNO |
nCino, Inc.
Common Stock |
S - Sale | -120,717 | 2,299,115 | -4.99 | 33.50 | -4,043,500 | 77,010,466 | |
| 2024-07-30 |
|
4 | NCNO |
nCino, Inc.
Common Stock |
S - Sale | -4,850 | 92,364 | -4.99 | 33.50 | -162,454 | 3,093,797 | |
| 2024-07-30 |
|
4 | NCNO |
nCino, Inc.
Common Stock |
S - Sale | -242,952 | 4,627,140 | -4.99 | 33.50 | -8,137,847 | 154,989,293 | |
| 2024-07-30 |
|
4 | NCNO |
nCino, Inc.
Common Stock |
S - Sale | -2,739 | 1,205,180 | -0.23 | 33.30 | -91,201 | 40,128,999 | |
| 2024-07-30 |
|
4 | NCNO |
nCino, Inc.
Common Stock |
S - Sale | -801 | 280,466 | -0.28 | 33.30 | -26,671 | 9,338,704 | |
| 2024-07-30 |
|
4 | NCNO |
nCino, Inc.
Common Stock |
S - Sale | -4,142 | 1,449,880 | -0.28 | 33.30 | -137,917 | 48,276,799 | |
| 2024-07-30 |
|
4 | NCNO |
nCino, Inc.
Common Stock |
S - Sale | -2,432 | 605,009 | -0.40 | 33.30 | -80,979 | 20,145,045 | |
| 2024-07-30 |
|
4 | NCNO |
nCino, Inc.
Common Stock |
S - Sale | -50,481 | 1,207,919 | -4.01 | 33.50 | -1,690,896 | 40,460,092 | |
| 2024-07-30 |
|
4 | NCNO |
nCino, Inc.
Common Stock |
S - Sale | -14,768 | 281,267 | -4.99 | 33.50 | -494,664 | 9,421,235 | |
| 2024-07-30 |
|
4 | NCNO |
nCino, Inc.
Common Stock |
S - Sale | -76,345 | 1,454,022 | -4.99 | 33.50 | -2,557,229 | 48,703,485 | |
| 2024-07-30 |
|
4 | NCNO |
nCino, Inc.
Common Stock |
S - Sale | -44,836 | 607,441 | -6.87 | 33.50 | -1,501,813 | 20,346,662 | |
| 2024-07-30 |
|
4 | NCNO |
nCino, Inc.
Common Stock |
S - Sale | -4,873 | 1,705,965 | -0.28 | 33.30 | -162,257 | 56,803,687 | |
| 2024-07-30 |
|
4 | NCNO |
nCino, Inc.
Common Stock |
S - Sale | -3,960 | 1,386,097 | -0.28 | 33.30 | -131,857 | 46,153,010 | |
| 2024-07-30 |
|
4 | NCNO |
nCino, Inc.
Common Stock |
S - Sale | -4,306 | 1,507,441 | -0.28 | 33.30 | -143,377 | 50,193,414 | |
| 2024-07-30 |
|
4 | NCNO |
nCino, Inc.
Common Stock |
S - Sale | -5,357 | 1,875,062 | -0.28 | 33.30 | -178,373 | 62,434,127 | |
| 2024-07-30 |
|
4 | NCNO |
nCino, Inc.
Common Stock |
S - Sale | -89,829 | 1,710,838 | -4.99 | 33.50 | -3,008,885 | 57,305,716 | |
| 2024-07-30 |
|
4 | NCNO |
nCino, Inc.
Common Stock |
S - Sale | -72,986 | 1,390,057 | -4.99 | 33.50 | -2,444,717 | 46,560,932 | |
| 2024-07-30 |
|
4 | NCNO |
nCino, Inc.
Common Stock |
S - Sale | -79,376 | 1,511,747 | -4.99 | 33.50 | -2,658,755 | 50,637,024 | |
| 2024-07-30 |
|
4 | NCNO |
nCino, Inc.
Common Stock |
S - Sale | -98,733 | 1,880,419 | -4.99 | 33.50 | -3,307,131 | 62,985,951 | |
| 2024-07-24 |
|
4 | NCNO |
nCino, Inc.
Common Stock |
S - Sale | -8,722 | 515,986 | -1.66 | 33.53 | -292,457 | 17,301,527 | |
| 2024-07-24 |
|
4 | NCNO |
nCino, Inc.
Common Stock |
S - Sale | -40,905 | 2,419,832 | -1.66 | 33.53 | -1,371,586 | 81,139,387 | |
| 2024-07-24 |
|
4 | NCNO |
nCino, Inc.
Common Stock |
S - Sale | -1,643 | 97,214 | -1.66 | 33.53 | -55,091 | 3,259,683 | |
| 2024-07-24 |
|
4 | NCNO |
nCino, Inc.
Common Stock |
S - Sale | -82,325 | 4,870,092 | -1.66 | 33.53 | -2,760,440 | 163,299,055 | |
| 2024-07-24 |
|
4 | NCNO |
nCino, Inc.
Common Stock |
S - Sale | -10,216 | 524,708 | -1.91 | 33.16 | -338,780 | 17,400,209 | |
| 2024-07-24 |
|
4 | NCNO |
nCino, Inc.
Common Stock |
S - Sale | -47,909 | 2,460,737 | -1.91 | 33.16 | -1,588,744 | 81,602,222 | |
| 2024-07-24 |
|
4 | NCNO |
nCino, Inc.
Common Stock |
S - Sale | -1,925 | 98,857 | -1.91 | 33.16 | -63,836 | 3,278,266 | |
| 2024-07-24 |
|
4 | NCNO |
nCino, Inc.
Common Stock |
S - Sale | -96,421 | 4,952,417 | -1.91 | 33.16 | -3,197,484 | 164,230,567 | |
| 2024-07-24 |
|
4 | NCNO |
nCino, Inc.
Common Stock |
S - Sale | -17,106 | 1,258,400 | -1.34 | 33.53 | -573,581 | 42,195,410 | |
| 2024-07-24 |
|
4 | NCNO |
nCino, Inc.
Common Stock |
S - Sale | -5,004 | 296,035 | -1.66 | 33.53 | -167,789 | 9,926,350 | |
| 2024-07-24 |
|
4 | NCNO |
nCino, Inc.
Common Stock |
S - Sale | -25,869 | 1,530,367 | -1.66 | 33.53 | -867,413 | 51,314,736 | |
| 2024-07-24 |
|
4 | NCNO |
nCino, Inc.
Common Stock |
S - Sale | -15,193 | 652,277 | -2.28 | 33.53 | -509,436 | 21,871,500 | |
| 2024-07-24 |
|
4 | NCNO |
nCino, Inc.
Common Stock |
S - Sale | -20,035 | 1,275,506 | -1.55 | 33.16 | -664,395 | 42,297,947 | |
| 2024-07-24 |
|
4 | NCNO |
nCino, Inc.
Common Stock |
S - Sale | -5,861 | 301,039 | -1.91 | 33.16 | -194,361 | 9,982,965 | |
| 2024-07-24 |
|
4 | NCNO |
nCino, Inc.
Common Stock |
S - Sale | -30,299 | 1,556,236 | -1.91 | 33.16 | -1,004,766 | 51,607,431 | |
| 2024-07-24 |
|
4 | NCNO |
nCino, Inc.
Common Stock |
S - Sale | -17,794 | 667,470 | -2.60 | 33.16 | -590,079 | 22,134,440 | |
| 2024-07-24 |
|
4 | NCNO |
nCino, Inc.
Common Stock |
S - Sale | -30,439 | 1,800,667 | -1.66 | 33.53 | -1,020,650 | 60,378,165 | |
| 2024-07-24 |
|
4 | NCNO |
nCino, Inc.
Common Stock |
S - Sale | -24,731 | 1,463,043 | -1.66 | 33.53 | -829,255 | 49,057,295 | |
| 2024-07-24 |
|
4 | NCNO |
nCino, Inc.
Common Stock |
S - Sale | -26,897 | 1,591,123 | -1.66 | 33.53 | -901,883 | 53,351,945 | |
| 2024-07-24 |
|
4 | NCNO |
nCino, Inc.
Common Stock |
S - Sale | -33,456 | 1,979,152 | -1.66 | 33.53 | -1,121,813 | 66,362,946 | |
| 2024-07-24 |
|
4 | NCNO |
nCino, Inc.
Common Stock |
S - Sale | -35,651 | 1,831,106 | -1.91 | 33.16 | -1,182,248 | 60,722,588 | |
| 2024-07-24 |
|
4 | NCNO |
nCino, Inc.
Common Stock |
S - Sale | -28,966 | 1,487,774 | -1.91 | 33.16 | -960,562 | 49,337,115 | |
| 2024-07-24 |
|
4 | NCNO |
nCino, Inc.
Common Stock |
S - Sale | -31,502 | 1,618,020 | -1.91 | 33.16 | -1,044,660 | 53,656,294 | |
| 2024-07-24 |
|
4 | NCNO |
nCino, Inc.
Common Stock |
S - Sale | -39,185 | 2,012,608 | -1.91 | 33.16 | -1,299,441 | 66,741,503 | |
| 2024-07-24 |
|
4/A | NCNO |
nCino, Inc.
Common Stock |
S - Sale | -125,685 | 545,013 | -18.74 | 31.00 | -3,896,235 | 16,895,403 | |
| 2024-07-24 |
|
4/A | NCNO |
nCino, Inc.
Common Stock |
S - Sale | -589,430 | 2,555,961 | -18.74 | 31.00 | -18,272,330 | 79,234,791 | |
| 2024-07-24 |
|
4/A | NCNO |
nCino, Inc.
Common Stock |
S - Sale | -23,679 | 102,682 | -18.74 | 31.00 | -734,049 | 3,183,142 | |
| 2024-07-24 |
|
4/A | NCNO |
nCino, Inc.
Common Stock |
S - Sale | -1,186,273 | 5,144,064 | -18.74 | 31.00 | -36,774,463 | 159,465,984 | |
| 2024-07-24 |
|
4/A | NCNO |
nCino, Inc.
Common Stock |
S - Sale | -23,925 | 670,698 | -3.44 | 31.50 | -753,736 | 21,129,737 | |
| 2024-07-24 |
|
4/A | NCNO |
nCino, Inc.
Common Stock |
S - Sale | -112,201 | 3,145,391 | -3.44 | 31.50 | -3,534,792 | 99,092,713 | |
| 2024-07-24 |
|
4/A | NCNO |
nCino, Inc.
Common Stock |
S - Sale | -4,507 | 126,361 | -3.44 | 31.50 | -141,989 | 3,980,890 | |
| 2024-07-24 |
|
4/A | NCNO |
nCino, Inc.
Common Stock |
S - Sale | -225,812 | 6,330,337 | -3.44 | 31.50 | -7,114,004 | 199,431,570 | |
| 2024-07-24 |
|
4/A | NCNO |
nCino, Inc.
Common Stock |
S - Sale | -72,109 | 312,688 | -18.74 | 31.00 | -2,235,379 | 9,693,328 | |
| 2024-07-24 |
|
4/A | NCNO |
nCino, Inc.
Common Stock |
S - Sale | -372,771 | 1,616,458 | -18.74 | 31.00 | -11,555,901 | 50,110,198 | |
| 2024-07-24 |
|
4/A | NCNO |
nCino, Inc.
Common Stock |
S - Sale | -465,409 | 702,837 | -39.84 | 31.00 | -14,427,679 | 21,787,947 | |
| 2024-07-24 |
|
4/A | NCNO |
nCino, Inc.
Common Stock |
S - Sale | -46,919 | 1,315,327 | -3.44 | 31.50 | -1,478,141 | 41,438,193 | |
| 2024-07-24 |
|
4/A | NCNO |
nCino, Inc.
Common Stock |
S - Sale | -13,726 | 384,797 | -3.44 | 31.50 | -432,425 | 12,122,683 | |
| 2024-07-24 |
|
4/A | NCNO |
nCino, Inc.
Common Stock |
S - Sale | -70,958 | 1,989,229 | -3.44 | 31.50 | -2,235,468 | 62,668,869 | |
| 2024-07-24 |
|
4/A | NCNO |
nCino, Inc.
Common Stock |
S - Sale | -41,673 | 1,168,246 | -3.44 | 31.50 | -1,312,870 | 36,804,539 | |
| 2024-07-24 |
|
4/A | NCNO |
nCino, Inc.
Common Stock |
S - Sale | -438,612 | 1,901,966 | -18.74 | 31.00 | -13,596,972 | 58,960,946 | |
| 2024-07-24 |
|
4/A | NCNO |
nCino, Inc.
Common Stock |
S - Sale | -356,373 | 1,545,347 | -18.74 | 31.00 | -11,047,563 | 47,905,757 | |
| 2024-07-24 |
|
4/A | NCNO |
nCino, Inc.
Common Stock |
S - Sale | -387,571 | 1,680,633 | -18.74 | 31.00 | -12,014,701 | 52,099,623 | |
| 2024-07-24 |
|
4/A | NCNO |
nCino, Inc.
Common Stock |
S - Sale | -482,088 | 2,090,491 | -18.74 | 31.00 | -14,944,728 | 64,805,221 | |
| 2024-07-24 |
|
4/A | NCNO |
nCino, Inc.
Common Stock |
S - Sale | -83,491 | 2,340,578 | -3.44 | 31.50 | -2,630,309 | 73,737,803 | |
| 2024-07-24 |
|
4/A | NCNO |
nCino, Inc.
Common Stock |
S - Sale | -67,837 | 1,901,720 | -3.44 | 31.50 | -2,137,144 | 59,911,977 | |
| 2024-07-24 |
|
4/A | NCNO |
nCino, Inc.
Common Stock |
S - Sale | -73,775 | 2,068,204 | -3.44 | 31.50 | -2,324,215 | 65,156,906 | |
| 2024-07-24 |
|
4/A | NCNO |
nCino, Inc.
Common Stock |
S - Sale | -91,767 | 2,572,579 | -3.44 | 31.50 | -2,891,037 | 81,046,786 | |
| 2024-07-19 |
|
4 | NCNO |
nCino, Inc.
Common Stock |
S - Sale | -6,552 | 534,924 | -1.21 | 33.32 | -218,283 | 17,821,261 | |
| 2024-07-19 |
|
4 | NCNO |
nCino, Inc.
Common Stock |
S - Sale | -30,727 | 2,508,646 | -1.21 | 33.32 | -1,023,685 | 83,576,796 | |
| 2024-07-19 |
|
4 | NCNO |
nCino, Inc.
Common Stock |
S - Sale | -1,234 | 100,782 | -1.21 | 33.32 | -41,111 | 3,357,603 | |
| 2024-07-19 |
|
4 | NCNO |
nCino, Inc.
Common Stock |
S - Sale | -61,841 | 5,048,838 | -1.21 | 33.32 | -2,060,264 | 168,204,562 | |
| 2024-07-19 |
|
4 | NCNO |
nCino, Inc.
Common Stock |
S - Sale | -3,537 | 541,476 | -0.65 | 33.01 | -116,767 | 17,875,747 | |
| 2024-07-19 |
|
4 | NCNO |
nCino, Inc.
Common Stock |
S - Sale | -16,588 | 2,539,373 | -0.65 | 33.01 | -547,620 | 83,832,321 | |
| 2024-07-19 |
|
4 | NCNO |
nCino, Inc.
Common Stock |
S - Sale | -666 | 102,016 | -0.65 | 33.01 | -21,987 | 3,367,854 | |
| 2024-07-19 |
|
4 | NCNO |
nCino, Inc.
Common Stock |
S - Sale | -33,385 | 5,110,679 | -0.65 | 33.01 | -1,102,139 | 168,718,846 | |
| 2024-07-19 |
|
4 | NCNO |
nCino, Inc.
Common Stock |
S - Sale | -12,849 | 1,295,541 | -0.98 | 33.32 | -428,071 | 43,161,596 | |
| 2024-07-19 |
|
4 | NCNO |
nCino, Inc.
Common Stock |
S - Sale | -3,759 | 306,900 | -1.21 | 33.32 | -125,233 | 10,224,527 | |
| 2024-07-19 |
|
4 | NCNO |
nCino, Inc.
Common Stock |
S - Sale | -19,432 | 1,586,535 | -1.21 | 33.32 | -647,387 | 52,856,207 | |
| 2024-07-19 |
|
4 | NCNO |
nCino, Inc.
Common Stock |
S - Sale | -11,412 | 685,264 | -1.64 | 33.32 | -380,196 | 22,829,913 | |
| 2024-07-19 |
|
4 | NCNO |
nCino, Inc.
Common Stock |
S - Sale | -6,937 | 1,308,390 | -0.53 | 33.01 | -229,011 | 43,193,879 | |
| 2024-07-19 |
|
4 | NCNO |
nCino, Inc.
Common Stock |
S - Sale | -2,029 | 310,659 | -0.65 | 33.01 | -66,983 | 10,255,786 | |
| 2024-07-19 |
|
4 | NCNO |
nCino, Inc.
Common Stock |
S - Sale | -10,491 | 1,605,967 | -0.65 | 33.01 | -346,339 | 53,017,789 | |
| 2024-07-19 |
|
4 | NCNO |
nCino, Inc.
Common Stock |
S - Sale | -6,161 | 696,676 | -0.88 | 33.01 | -203,393 | 22,999,365 | |
| 2024-07-19 |
|
4 | NCNO |
nCino, Inc.
Common Stock |
S - Sale | -22,865 | 1,866,757 | -1.21 | 33.32 | -761,759 | 62,191,943 | |
| 2024-07-19 |
|
4 | NCNO |
nCino, Inc.
Common Stock |
S - Sale | -18,578 | 1,516,740 | -1.21 | 33.32 | -618,935 | 50,530,951 | |
| 2024-07-19 |
|
4 | NCNO |
nCino, Inc.
Common Stock |
S - Sale | -20,204 | 1,649,522 | -1.21 | 33.32 | -673,106 | 54,954,650 | |
| 2024-07-19 |
|
4 | NCNO |
nCino, Inc.
Common Stock |
S - Sale | -25,131 | 2,051,793 | -1.21 | 33.32 | -837,252 | 68,356,510 | |
| 2024-07-19 |
|
4 | NCNO |
nCino, Inc.
Common Stock |
S - Sale | -12,344 | 1,889,622 | -0.65 | 33.01 | -407,512 | 62,382,091 | |
| 2024-07-19 |
|
4 | NCNO |
nCino, Inc.
Common Stock |
S - Sale | -10,029 | 1,535,318 | -0.65 | 33.01 | -331,087 | 50,685,453 | |
| 2024-07-19 |
|
4 | NCNO |
nCino, Inc.
Common Stock |
S - Sale | -10,907 | 1,669,726 | -0.65 | 33.01 | -360,073 | 55,122,664 | |
| 2024-07-19 |
|
4 | NCNO |
nCino, Inc.
Common Stock |
S - Sale | -13,567 | 2,076,924 | -0.65 | 33.01 | -447,887 | 68,565,492 | |
| 2024-07-15 |
|
4 | NCNO |
nCino, Inc.
Common Stock |
S - Sale | -438,612 | 1,901,966 | -18.74 | 31.00 | -13,596,972 | 58,960,946 | |
| 2024-07-15 |
|
4 | NCNO |
nCino, Inc.
Common Stock |
S - Sale | -356,373 | 1,545,347 | -18.74 | 31.00 | -11,047,563 | 47,905,757 | |
| 2024-07-15 |
|
4 | NCNO |
nCino, Inc.
Common Stock |
S - Sale | -387,571 | 1,680,633 | -18.74 | 31.00 | -12,014,701 | 52,099,623 | |
| 2024-07-15 |
|
4 | NCNO |
nCino, Inc.
Common Stock |
S - Sale | -482,088 | 2,090,491 | -18.74 | 31.00 | -14,944,728 | 64,805,221 | |
| 2024-07-15 |
|
4 | NCNO |
nCino, Inc.
Common Stock |
S - Sale | -83,491 | 2,340,578 | -3.44 | 31.50 | -2,630,309 | 73,737,803 | |
| 2024-07-15 |
|
4 | NCNO |
nCino, Inc.
Common Stock |
S - Sale | -67,837 | 1,901,720 | -3.44 | 31.50 | -2,137,144 | 59,911,977 | |
| 2024-07-15 |
|
4 | NCNO |
nCino, Inc.
Common Stock |
S - Sale | -73,775 | 2,068,204 | -3.44 | 31.50 | -2,324,215 | 65,156,906 | |
| 2024-07-15 |
|
4 | NCNO |
nCino, Inc.
Common Stock |
S - Sale | -91,767 | 2,572,579 | -3.44 | 31.50 | -2,891,037 | 81,046,786 | |
| 2024-07-15 |
|
4 | NCNO |
nCino, Inc.
Common Stock |
S - Sale | -125,685 | 259,112 | -32.66 | 31.00 | -3,896,235 | 8,032,472 | |
| 2024-07-15 |
|
4 | NCNO |
nCino, Inc.
Common Stock |
S - Sale | -372,771 | 1,616,458 | -18.74 | 31.00 | -11,555,901 | 50,110,198 | |
| 2024-07-15 |
|
4 | NCNO |
nCino, Inc.
Common Stock |
S - Sale | -465,409 | 702,837 | -39.84 | 31.00 | -14,427,679 | 21,787,947 | |
| 2024-07-15 |
|
4 | NCNO |
nCino, Inc.
Common Stock |
S - Sale | -46,919 | 1,315,327 | -3.44 | 31.50 | -1,478,141 | 41,438,193 | |
| 2024-07-15 |
|
4 | NCNO |
nCino, Inc.
Common Stock |
S - Sale | -13,726 | 384,797 | -3.44 | 31.50 | -432,425 | 12,122,683 | |
| 2024-07-15 |
|
4 | NCNO |
nCino, Inc.
Common Stock |
S - Sale | -70,958 | 1,989,229 | -3.44 | 31.50 | -2,235,468 | 62,668,869 | |
| 2024-07-15 |
|
4 | NCNO |
nCino, Inc.
Common Stock |
S - Sale | -41,673 | 1,168,246 | -3.44 | 31.50 | -1,312,870 | 36,804,539 | |
| 2024-07-15 |
|
4 | NCNO |
nCino, Inc.
Common Stock |
S - Sale | -125,685 | 545,013 | -18.74 | 31.00 | -3,896,235 | 16,895,403 | |
| 2024-07-15 |
|
4 | NCNO |
nCino, Inc.
Common Stock |
S - Sale | -589,430 | 2,555,961 | -18.74 | 31.00 | -18,272,330 | 79,234,791 | |
| 2024-07-15 |
|
4 | NCNO |
nCino, Inc.
Common Stock |
S - Sale | -23,679 | 102,682 | -18.74 | 31.00 | -734,049 | 3,183,142 | |
| 2024-07-15 |
|
4 | NCNO |
nCino, Inc.
Common Stock |
S - Sale | -1,186,273 | 5,144,064 | -18.74 | 31.00 | -36,774,463 | 159,465,984 | |
| 2024-07-15 |
|
4 | NCNO |
nCino, Inc.
Common Stock |
S - Sale | -23,925 | 670,698 | -3.44 | 31.50 | -753,736 | 21,129,737 | |
| 2024-07-15 |
|
4 | NCNO |
nCino, Inc.
Common Stock |
S - Sale | -112,201 | 3,145,391 | -3.44 | 31.50 | -3,534,792 | 99,092,713 | |
| 2024-07-15 |
|
4 | NCNO |
nCino, Inc.
Common Stock |
S - Sale | -4,507 | 126,361 | -3.44 | 31.50 | -141,989 | 3,980,890 | |
| 2024-07-15 |
|
4 | NCNO |
nCino, Inc.
Common Stock |
S - Sale | -225,812 | 6,330,337 | -3.44 | 31.50 | -7,114,004 | 199,431,570 | |
| 2024-07-03 |
|
4 | NCNO |
nCino, Inc.
Common Stock |
S - Sale | -543 | 1,362,246 | -0.04 | 31.51 | -17,109 | 42,921,919 | |
| 2024-07-03 |
|
4 | NCNO |
nCino, Inc.
Common Stock |
S - Sale | -159 | 398,523 | -0.04 | 31.51 | -5,010 | 12,556,742 | |
| 2024-07-03 |
|
4 | NCNO |
nCino, Inc.
Common Stock |
S - Sale | -822 | 2,060,187 | -0.04 | 31.51 | -25,900 | 64,912,784 | |
| 2024-07-03 |
|
4 | NCNO |
nCino, Inc.
Common Stock |
S - Sale | -483 | 1,209,919 | -0.04 | 31.51 | -15,218 | 38,122,370 | |
| 2024-07-03 |
|
4 | NCNO |
nCino, Inc.
Common Stock |
S - Sale | -7,312 | 1,362,789 | -0.53 | 31.51 | -230,370 | 42,935,758 | |
| 2024-07-03 |
|
4 | NCNO |
nCino, Inc.
Common Stock |
S - Sale | -2,139 | 398,682 | -0.53 | 31.51 | -67,391 | 12,560,795 | |
| 2024-07-03 |
|
4 | NCNO |
nCino, Inc.
Common Stock |
S - Sale | -11,058 | 2,061,009 | -0.53 | 31.51 | -348,391 | 64,933,737 | |
| 2024-07-03 |
|
4 | NCNO |
nCino, Inc.
Common Stock |
S - Sale | -6,494 | 1,210,402 | -0.53 | 31.51 | -204,599 | 38,134,683 | |
| 2024-07-03 |
|
4 | NCNO |
nCino, Inc.
Common Stock |
S - Sale | -277 | 694,623 | -0.04 | 31.51 | -8,728 | 21,886,320 | |
| 2024-07-03 |
|
4 | NCNO |
nCino, Inc.
Common Stock |
S - Sale | -1,300 | 3,257,592 | -0.04 | 31.51 | -40,961 | 102,640,860 | |
| 2024-07-03 |
|
4 | NCNO |
nCino, Inc.
Common Stock |
S - Sale | -52 | 130,868 | -0.04 | 31.51 | -1,638 | 4,123,415 | |
| 2024-07-03 |
|
4 | NCNO |
nCino, Inc.
Common Stock |
S - Sale | -2,615 | 6,556,149 | -0.04 | 31.51 | -82,394 | 206,572,454 | |
| 2024-07-03 |
|
4 | NCNO |
nCino, Inc.
Common Stock |
S - Sale | -3,728 | 694,900 | -0.53 | 31.51 | -117,454 | 21,893,380 | |
| 2024-07-03 |
|
4 | NCNO |
nCino, Inc.
Common Stock |
S - Sale | -17,485 | 3,258,892 | -0.53 | 31.51 | -550,879 | 102,674,000 | |
| 2024-07-03 |
|
4 | NCNO |
nCino, Inc.
Common Stock |
S - Sale | -702 | 130,920 | -0.53 | 31.51 | -22,117 | 4,124,739 | |
| 2024-07-03 |
|
4 | NCNO |
nCino, Inc.
Common Stock |
S - Sale | -35,189 | 6,558,764 | -0.53 | 31.51 | -1,108,658 | 206,639,107 | |
| 2024-07-03 |
|
4 | NCNO |
nCino, Inc.
Common Stock |
S - Sale | -967 | 2,424,069 | -0.04 | 31.51 | -30,468 | 76,378,051 | |
| 2024-07-03 |
|
4 | NCNO |
nCino, Inc.
Common Stock |
S - Sale | -786 | 1,969,557 | -0.04 | 31.51 | -24,765 | 62,057,196 | |
| 2024-07-03 |
|
4 | NCNO |
nCino, Inc.
Common Stock |
S - Sale | -855 | 2,141,979 | -0.04 | 31.51 | -26,940 | 67,489,903 | |
| 2024-07-03 |
|
4 | NCNO |
nCino, Inc.
Common Stock |
S - Sale | -1,063 | 2,664,346 | -0.04 | 31.51 | -33,493 | 83,948,747 | |
| 2024-07-03 |
|
4 | NCNO |
nCino, Inc.
Common Stock |
S - Sale | -13,011 | 2,425,036 | -0.53 | 31.51 | -409,922 | 76,402,699 | |
| 2024-07-03 |
|
4 | NCNO |
nCino, Inc.
Common Stock |
S - Sale | -10,571 | 1,970,343 | -0.53 | 31.51 | -333,048 | 62,077,232 | |
| 2024-07-03 |
|
4 | NCNO |
nCino, Inc.
Common Stock |
S - Sale | -11,497 | 2,142,834 | -0.53 | 31.51 | -362,222 | 67,511,699 | |
| 2024-07-03 |
|
4 | NCNO |
nCino, Inc.
Common Stock |
S - Sale | -14,301 | 2,665,409 | -0.53 | 31.51 | -450,564 | 83,975,843 | |
| 2024-06-27 |
|
4 | NCNO |
nCino, Inc.
Common Stock |
S - Sale | -15,898 | 698,628 | -2.22 | 31.50 | -500,787 | 22,006,782 | |
| 2024-06-27 |
|
4 | NCNO |
nCino, Inc.
Common Stock |
S - Sale | -74,556 | 3,276,377 | -2.22 | 31.50 | -2,348,514 | 103,205,876 | |
| 2024-06-27 |
|
4 | NCNO |
nCino, Inc.
Common Stock |
S - Sale | -2,995 | 131,622 | -2.22 | 31.50 | -94,342 | 4,146,093 | |
| 2024-06-27 |
|
4 | NCNO |
nCino, Inc.
Common Stock |
S - Sale | -150,051 | 6,593,953 | -2.22 | 31.50 | -4,726,606 | 207,709,520 | |
| 2024-06-27 |
|
4 | NCNO |
nCino, Inc.
Common Stock |
S - Sale | -189 | 714,526 | -0.03 | 31.51 | -5,955 | 22,513,714 | |
| 2024-06-27 |
|
4 | NCNO |
nCino, Inc.
Common Stock |
S - Sale | -885 | 3,350,933 | -0.03 | 31.51 | -27,885 | 105,583,208 | |
| 2024-06-27 |
|
4 | NCNO |
nCino, Inc.
Common Stock |
S - Sale | -36 | 134,617 | -0.03 | 31.51 | -1,134 | 4,241,593 | |
| 2024-06-27 |
|
4 | NCNO |
nCino, Inc.
Common Stock |
S - Sale | -1,779 | 6,744,004 | -0.03 | 31.51 | -56,054 | 212,494,124 | |
| 2024-06-27 |
|
4 | NCNO |
nCino, Inc.
Common Stock |
S - Sale | -1,921 | 714,715 | -0.27 | 31.51 | -60,521 | 22,517,239 | |
| 2024-06-27 |
|
4 | NCNO |
nCino, Inc.
Common Stock |
S - Sale | -9,007 | 3,351,818 | -0.27 | 31.51 | -283,767 | 105,599,696 | |
| 2024-06-27 |
|
4 | NCNO |
nCino, Inc.
Common Stock |
S - Sale | -362 | 134,653 | -0.27 | 31.51 | -11,405 | 4,242,270 | |
| 2024-06-27 |
|
4 | NCNO |
nCino, Inc.
Common Stock |
S - Sale | -18,127 | 6,745,783 | -0.27 | 31.51 | -571,095 | 212,527,243 | |
| 2024-06-27 |
|
4 | NCNO |
nCino, Inc.
Common Stock |
S - Sale | -31,178 | 1,370,101 | -2.22 | 31.50 | -982,107 | 43,158,182 | |
| 2024-06-27 |
|
4 | NCNO |
nCino, Inc.
Common Stock |
S - Sale | -9,121 | 400,821 | -2.22 | 31.50 | -287,312 | 12,625,862 | |
| 2024-06-27 |
|
4 | NCNO |
nCino, Inc.
Common Stock |
S - Sale | -47,151 | 2,072,067 | -2.22 | 31.50 | -1,485,256 | 65,270,110 | |
| 2024-06-27 |
|
4 | NCNO |
nCino, Inc.
Common Stock |
S - Sale | -27,691 | 1,216,896 | -2.22 | 31.50 | -872,266 | 38,332,224 | |
| 2024-06-27 |
|
4 | NCNO |
nCino, Inc.
Common Stock |
S - Sale | -370 | 1,401,279 | -0.03 | 31.51 | -11,658 | 44,152,339 | |
| 2024-06-27 |
|
4 | NCNO |
nCino, Inc.
Common Stock |
S - Sale | -108 | 409,942 | -0.03 | 31.51 | -3,403 | 12,916,699 | |
| 2024-06-27 |
|
4 | NCNO |
nCino, Inc.
Common Stock |
S - Sale | -559 | 2,119,218 | -0.03 | 31.51 | -17,613 | 66,773,592 | |
| 2024-06-27 |
|
4 | NCNO |
nCino, Inc.
Common Stock |
S - Sale | -329 | 1,244,587 | -0.03 | 31.51 | -10,366 | 39,215,194 | |
| 2024-06-27 |
|
4 | NCNO |
nCino, Inc.
Common Stock |
S - Sale | -3,767 | 1,401,649 | -0.27 | 31.51 | -118,680 | 44,159,232 | |
| 2024-06-27 |
|
4 | NCNO |
nCino, Inc.
Common Stock |
S - Sale | -1,102 | 410,050 | -0.27 | 31.51 | -34,719 | 12,918,707 | |
| 2024-06-27 |
|
4 | NCNO |
nCino, Inc.
Common Stock |
S - Sale | -5,696 | 2,119,777 | -0.27 | 31.51 | -179,454 | 66,783,998 | |
| 2024-06-27 |
|
4 | NCNO |
nCino, Inc.
Common Stock |
S - Sale | -3,345 | 1,244,916 | -0.27 | 31.51 | -105,385 | 39,221,328 | |
| 2024-06-27 |
|
4 | NCNO |
nCino, Inc.
Common Stock |
S - Sale | -55,480 | 2,438,047 | -2.22 | 31.50 | -1,747,620 | 76,798,480 | |
| 2024-06-27 |
|
4 | NCNO |
nCino, Inc.
Common Stock |
S - Sale | -45,077 | 1,980,914 | -2.22 | 31.50 | -1,419,926 | 62,398,791 | |
| 2024-06-27 |
|
4 | NCNO |
nCino, Inc.
Common Stock |
S - Sale | -49,023 | 2,154,331 | -2.22 | 31.50 | -1,544,224 | 67,861,426 | |
| 2024-06-27 |
|
4 | NCNO |
nCino, Inc.
Common Stock |
S - Sale | -60,979 | 2,679,710 | -2.22 | 31.50 | -1,920,838 | 84,410,865 | |
| 2024-06-27 |
|
4 | NCNO |
nCino, Inc.
Common Stock |
S - Sale | -658 | 2,493,527 | -0.03 | 31.51 | -20,733 | 78,567,545 | |
| 2024-06-27 |
|
4 | NCNO |
nCino, Inc.
Common Stock |
S - Sale | -535 | 2,025,991 | -0.03 | 31.51 | -16,857 | 63,836,140 | |
| 2024-06-27 |
|
4 | NCNO |
nCino, Inc.
Common Stock |
S - Sale | -582 | 2,203,354 | -0.03 | 31.51 | -18,338 | 69,424,600 | |
| 2024-06-27 |
|
4 | NCNO |
nCino, Inc.
Common Stock |
S - Sale | -723 | 2,740,689 | -0.03 | 31.51 | -22,781 | 86,355,273 | |
| 2024-06-27 |
|
4 | NCNO |
nCino, Inc.
Common Stock |
S - Sale | -6,703 | 2,494,185 | -0.27 | 31.51 | -211,179 | 78,579,797 | |
| 2024-06-27 |
|
4 | NCNO |
nCino, Inc.
Common Stock |
S - Sale | -5,446 | 2,026,526 | -0.27 | 31.51 | -171,577 | 63,846,107 | |
| 2024-06-27 |
|
4 | NCNO |
nCino, Inc.
Common Stock |
S - Sale | -5,923 | 2,203,936 | -0.27 | 31.51 | -186,605 | 69,435,444 | |
| 2024-06-27 |
|
4 | NCNO |
nCino, Inc.
Common Stock |
S - Sale | -7,367 | 2,741,412 | -0.27 | 31.51 | -232,099 | 86,368,733 | |
| 2024-06-26 |
|
4 | NCNO |
nCino, Inc.
Common Stock |
S - Sale | -17,710 | 1,405,416 | -1.24 | 31.53 | -558,391 | 44,312,345 | |
| 2024-06-26 |
|
4 | NCNO |
nCino, Inc.
Common Stock |
S - Sale | -5,181 | 411,152 | -1.24 | 31.53 | -163,355 | 12,963,499 | |
| 2024-06-26 |
|
4 | NCNO |
nCino, Inc.
Common Stock |
S - Sale | -26,784 | 2,125,473 | -1.24 | 31.53 | -844,491 | 67,015,526 | |
| 2024-06-26 |
|
4 | NCNO |
nCino, Inc.
Common Stock |
S - Sale | -15,730 | 1,248,261 | -1.24 | 31.53 | -495,962 | 39,357,295 | |
| 2024-06-26 |
|
4 | NCNO |
nCino, Inc.
Common Stock |
S - Sale | -24,986 | 1,423,126 | -1.73 | 31.60 | -789,553 | 44,970,497 | |
| 2024-06-26 |
|
4 | NCNO |
nCino, Inc.
Common Stock |
S - Sale | -7,310 | 416,333 | -1.73 | 31.60 | -230,995 | 13,156,040 | |
| 2024-06-26 |
|
4 | NCNO |
nCino, Inc.
Common Stock |
S - Sale | -37,788 | 2,152,257 | -1.73 | 31.60 | -1,194,093 | 68,010,891 | |
| 2024-06-26 |
|
4 | NCNO |
nCino, Inc.
Common Stock |
S - Sale | -22,192 | 1,263,991 | -1.73 | 31.60 | -701,263 | 39,941,863 | |
| 2024-06-25 |
|
4 | NCNO |
nCino, Inc.
Common Stock |
S - Sale | -9,031 | 716,636 | -1.24 | 31.53 | -284,745 | 22,595,318 | |
| 2024-06-25 |
|
4 | NCNO |
nCino, Inc.
Common Stock |
S - Sale | -42,351 | 3,360,825 | -1.24 | 31.53 | -1,335,314 | 105,965,804 | |
| 2024-06-25 |
|
4 | NCNO |
nCino, Inc.
Common Stock |
S - Sale | -1,701 | 135,015 | -1.24 | 31.53 | -53,632 | 4,256,982 | |
| 2024-06-25 |
|
4 | NCNO |
nCino, Inc.
Common Stock |
S - Sale | -85,236 | 6,763,910 | -1.24 | 31.53 | -2,687,466 | 213,264,053 | |
| 2024-06-25 |
|
4 | NCNO |
nCino, Inc.
Common Stock |
S - Sale | -12,741 | 725,667 | -1.73 | 31.60 | -402,613 | 22,930,932 | |
| 2024-06-25 |
|
4 | NCNO |
nCino, Inc.
Common Stock |
S - Sale | -59,751 | 3,403,176 | -1.73 | 31.60 | -1,888,120 | 107,539,681 | |
| 2024-06-25 |
|
4 | NCNO |
nCino, Inc.
Common Stock |
S - Sale | -2,400 | 136,716 | -1.73 | 31.60 | -75,840 | 4,320,198 | |
| 2024-06-25 |
|
4 | NCNO |
nCino, Inc.
Common Stock |
S - Sale | -120,254 | 6,849,146 | -1.73 | 31.60 | -3,800,002 | 216,431,644 | |
| 2024-06-25 |
|
4 | NCNO |
nCino, Inc.
Common Stock |
S - Sale | -31,515 | 2,500,888 | -1.24 | 31.53 | -993,658 | 78,852,248 | |
| 2024-06-25 |
|
4 | NCNO |
nCino, Inc.
Common Stock |
S - Sale | -25,606 | 2,031,972 | -1.24 | 31.53 | -807,349 | 64,067,468 | |
| 2024-06-25 |
|
4 | NCNO |
nCino, Inc.
Common Stock |
S - Sale | -27,848 | 2,209,859 | -1.24 | 31.53 | -878,039 | 69,676,191 | |
| 2024-06-25 |
|
4 | NCNO |
nCino, Inc.
Common Stock |
S - Sale | -34,639 | 2,748,779 | -1.24 | 31.53 | -1,092,157 | 86,668,177 | |
| 2024-06-25 |
|
4 | NCNO |
nCino, Inc.
Common Stock |
S - Sale | -44,463 | 2,532,403 | -1.73 | 31.60 | -1,405,022 | 80,023,428 | |
| 2024-06-25 |
|
4 | NCNO |
nCino, Inc.
Common Stock |
S - Sale | -36,126 | 2,057,578 | -1.73 | 31.60 | -1,141,574 | 65,019,053 | |
| 2024-06-25 |
|
4 | NCNO |
nCino, Inc.
Common Stock |
S - Sale | -39,288 | 2,237,707 | -1.73 | 31.60 | -1,241,493 | 70,711,094 | |
| 2024-06-25 |
|
4 | NCNO |
nCino, Inc.
Common Stock |
S - Sale | -75,415 | 2,756,873 | -2.66 | 31.60 | -2,383,099 | 87,116,635 | |
| 2024-06-20 |
|
4 | NCNO |
nCino, Inc.
Common Stock |
S - Sale | -19,661 | 738,408 | -2.59 | 31.55 | -620,238 | 23,294,262 | |
| 2024-06-20 |
|
4 | NCNO |
nCino, Inc.
Common Stock |
S - Sale | -92,207 | 3,462,927 | -2.59 | 31.55 | -2,908,817 | 109,243,573 | |
| 2024-06-20 |
|
4 | NCNO |
nCino, Inc.
Common Stock |
S - Sale | -3,704 | 139,116 | -2.59 | 31.55 | -116,849 | 4,388,637 | |
| 2024-06-20 |
|
4 | NCNO |
nCino, Inc.
Common Stock |
S - Sale | -185,573 | 6,969,400 | -2.59 | 31.55 | -5,854,197 | 219,860,874 | |
| 2024-06-20 |
|
4 | NCNO |
nCino, Inc.
Common Stock |
S - Sale | -38,559 | 1,448,112 | -2.59 | 31.55 | -1,216,405 | 45,683,010 | |
| 2024-06-20 |
|
4 | NCNO |
nCino, Inc.
Common Stock |
S - Sale | -11,280 | 423,643 | -2.59 | 31.55 | -355,846 | 13,364,496 | |
| 2024-06-20 |
|
4 | NCNO |
nCino, Inc.
Common Stock |
S - Sale | -58,314 | 2,190,045 | -2.59 | 31.55 | -1,839,608 | 69,088,474 | |
| 2024-06-20 |
|
4 | NCNO |
nCino, Inc.
Common Stock |
S - Sale | -34,247 | 1,286,183 | -2.59 | 31.55 | -1,080,376 | 40,574,701 | |
| 2024-06-20 |
|
4 | NCNO |
nCino, Inc.
Common Stock |
S - Sale | -68,614 | 2,576,866 | -2.59 | 31.55 | -2,164,538 | 81,291,361 | |
| 2024-06-20 |
|
4 | NCNO |
nCino, Inc.
Common Stock |
S - Sale | -55,749 | 2,093,704 | -2.59 | 31.55 | -1,758,691 | 66,049,243 | |
| 2024-06-20 |
|
4 | NCNO |
nCino, Inc.
Common Stock |
S - Sale | -60,629 | 2,276,995 | -2.59 | 31.55 | -1,912,639 | 71,831,450 | |
| 2024-06-20 |
|
4 | NCNO |
nCino, Inc.
Common Stock |
S - Sale | -75,415 | 2,832,288 | -2.59 | 31.55 | -2,379,087 | 89,349,057 | |
| 2024-06-14 |
|
4 | NCNO |
nCino, Inc.
Common Stock |
S - Sale | -52,280 | 758,069 | -6.45 | 31.51 | -1,647,186 | 23,884,480 | |
| 2024-06-14 |
|
4 | NCNO |
nCino, Inc.
Common Stock |
S - Sale | -245,180 | 3,555,134 | -6.45 | 31.51 | -7,724,886 | 112,011,607 | |
| 2024-06-14 |
|
4 | NCNO |
nCino, Inc.
Common Stock |
S - Sale | -9,850 | 142,820 | -6.45 | 31.51 | -310,344 | 4,499,830 | |
| 2024-06-14 |
|
4 | NCNO |
nCino, Inc.
Common Stock |
S - Sale | -493,445 | 7,154,973 | -6.45 | 31.51 | -15,546,972 | 225,431,734 | |
| 2024-06-14 |
|
4 | NCNO |
nCino, Inc.
Common Stock |
S - Sale | -102,528 | 1,486,671 | -6.45 | 31.51 | -3,230,350 | 46,840,543 | |
| 2024-06-14 |
|
4 | NCNO |
nCino, Inc.
Common Stock |
S - Sale | -29,995 | 434,923 | -6.45 | 31.51 | -945,052 | 13,703,119 | |
| 2024-06-14 |
|
4 | NCNO |
nCino, Inc.
Common Stock |
S - Sale | -155,058 | 2,248,359 | -6.45 | 31.51 | -4,885,412 | 70,839,047 | |
| 2024-06-14 |
|
4 | NCNO |
nCino, Inc.
Common Stock |
S - Sale | -91,064 | 1,320,430 | -6.45 | 31.51 | -2,869,153 | 41,602,788 | |
| 2024-06-14 |
|
4 | NCNO |
nCino, Inc.
Common Stock |
S - Sale | -182,446 | 2,645,480 | -6.45 | 31.51 | -5,748,326 | 83,351,138 | |
| 2024-06-14 |
|
4 | NCNO |
nCino, Inc.
Common Stock |
S - Sale | -148,237 | 2,149,453 | -6.45 | 31.51 | -4,670,503 | 67,722,816 | |
| 2024-06-14 |
|
4 | NCNO |
nCino, Inc.
Common Stock |
S - Sale | -161,215 | 2,337,624 | -6.45 | 31.51 | -5,079,401 | 73,651,519 | |
| 2024-06-14 |
|
4 | NCNO |
nCino, Inc.
Common Stock |
S - Sale | -200,530 | 2,907,703 | -6.45 | 31.51 | -6,318,099 | 91,612,998 | |
| 2024-06-05 |
|
4 | DIBS |
1stdibs.com, Inc.
Common Stock |
S - Sale | -48,984 | 0 | -100.00 | 5.20 | -254,820 | ||
| 2024-06-05 |
|
4 | DIBS |
1stdibs.com, Inc.
Common Stock |
S - Sale | -260,009 | 0 | -100.00 | 5.20 | -1,352,593 | ||
| 2024-06-05 |
|
4 | DIBS |
1stdibs.com, Inc.
Common Stock |
S - Sale | -1,219,371 | 0 | -100.00 | 5.20 | -6,343,290 | ||
| 2024-06-05 |
|
4 | DIBS |
1stdibs.com, Inc.
Common Stock |
S - Sale | -2,454,082 | 0 | -100.00 | 5.20 | -12,766,380 | ||
| 2024-05-22 |
|
4 | DIBS |
1stdibs.com, Inc.
Common Stock |
S - Sale | -225 | 48,984 | -0.46 | 5.55 | -1,248 | 271,719 | |
| 2024-05-22 |
|
4 | DIBS |
1stdibs.com, Inc.
Common Stock |
S - Sale | -1,191 | 260,009 | -0.46 | 5.55 | -6,607 | 1,442,296 | |
| 2024-05-22 |
|
4 | DIBS |
1stdibs.com, Inc.
Common Stock |
S - Sale | -5,583 | 1,219,371 | -0.46 | 5.55 | -30,969 | 6,763,973 | |
| 2024-05-22 |
|
4 | DIBS |
1stdibs.com, Inc.
Common Stock |
S - Sale | -11,233 | 2,454,082 | -0.46 | 5.55 | -62,311 | 13,613,038 | |
| 2024-05-17 |
|
4 | DIBS |
1stdibs.com, Inc.
Common Stock |
S - Sale | -152 | 49,209 | -0.31 | 5.63 | -856 | 277,081 | |
| 2024-05-17 |
|
4 | DIBS |
1stdibs.com, Inc.
Common Stock |
S - Sale | -806 | 261,200 | -0.31 | 5.63 | -4,538 | 1,470,739 | |
| 2024-05-17 |
|
4 | DIBS |
1stdibs.com, Inc.
Common Stock |
S - Sale | -3,779 | 1,224,954 | -0.31 | 5.63 | -21,278 | 6,897,348 | |
| 2024-05-17 |
|
4 | DIBS |
1stdibs.com, Inc.
Common Stock |
S - Sale | -7,606 | 2,465,315 | -0.31 | 5.63 | -42,827 | 13,881,449 | |
| 2024-05-17 |
|
4 | DIBS |
1stdibs.com, Inc.
Common Stock |
S - Sale | -87 | 49,361 | -0.18 | 5.84 | -508 | 288,214 | |
| 2024-05-17 |
|
4 | DIBS |
1stdibs.com, Inc.
Common Stock |
S - Sale | -464 | 262,006 | -0.18 | 5.84 | -2,709 | 1,529,827 | |
| 2024-05-17 |
|
4 | DIBS |
1stdibs.com, Inc.
Common Stock |
S - Sale | -2,177 | 1,228,733 | -0.18 | 5.84 | -12,711 | 7,174,449 | |
| 2024-05-17 |
|
4 | DIBS |
1stdibs.com, Inc.
Common Stock |
S - Sale | -4,383 | 2,472,921 | -0.18 | 5.84 | -25,592 | 14,439,138 | |
| 2024-05-17 |
|
4 | DIBS |
1stdibs.com, Inc.
Common Stock |
S - Sale | -31 | 49,448 | -0.06 | 6.02 | -187 | 297,514 | |
| 2024-05-17 |
|
4 | DIBS |
1stdibs.com, Inc.
Common Stock |
S - Sale | -165 | 262,470 | -0.06 | 6.02 | -993 | 1,579,203 | |
| 2024-05-17 |
|
4 | DIBS |
1stdibs.com, Inc.
Common Stock |
S - Sale | -775 | 1,230,910 | -0.06 | 6.02 | -4,663 | 7,406,016 | |
| 2024-05-17 |
|
4 | DIBS |
1stdibs.com, Inc.
Common Stock |
S - Sale | -1,559 | 2,477,304 | -0.06 | 6.02 | -9,380 | 14,905,195 | |
| 2024-05-10 |
|
4 | DIBS |
1stdibs.com, Inc.
Common Stock |
S - Sale | -138 | 49,479 | -0.28 | 6.00 | -828 | 296,933 | |
| 2024-05-10 |
|
4 | DIBS |
1stdibs.com, Inc.
Common Stock |
S - Sale | -734 | 262,635 | -0.28 | 6.00 | -4,405 | 1,576,125 | |
| 2024-05-10 |
|
4 | DIBS |
1stdibs.com, Inc.
Common Stock |
S - Sale | -3,442 | 1,231,685 | -0.28 | 6.00 | -20,656 | 7,391,588 | |
| 2024-05-10 |
|
4 | DIBS |
1stdibs.com, Inc.
Common Stock |
S - Sale | -6,929 | 2,478,863 | -0.28 | 6.00 | -41,582 | 14,876,153 | |
| 2024-05-10 |
|
4 | DIBS |
1stdibs.com, Inc.
Common Stock |
S - Sale | -402 | 49,617 | -0.80 | 5.99 | -2,407 | 297,032 | |
| 2024-05-10 |
|
4 | DIBS |
1stdibs.com, Inc.
Common Stock |
S - Sale | -2,133 | 263,369 | -0.80 | 5.99 | -12,769 | 1,576,659 | |
| 2024-05-10 |
|
4 | DIBS |
1stdibs.com, Inc.
Common Stock |
S - Sale | -10,004 | 1,235,127 | -0.80 | 5.99 | -59,889 | 7,394,088 | |
| 2024-05-10 |
|
4 | DIBS |
1stdibs.com, Inc.
Common Stock |
S - Sale | -20,134 | 2,485,792 | -0.80 | 5.99 | -120,532 | 14,881,194 | |
| 2024-05-10 |
|
4 | DIBS |
1stdibs.com, Inc.
Common Stock |
S - Sale | -216 | 50,019 | -0.43 | 5.86 | -1,267 | 293,361 | |
| 2024-05-10 |
|
4 | DIBS |
1stdibs.com, Inc.
Common Stock |
S - Sale | -1,144 | 265,502 | -0.43 | 5.86 | -6,710 | 1,557,169 | |
| 2024-05-10 |
|
4 | DIBS |
1stdibs.com, Inc.
Common Stock |
S - Sale | -5,366 | 1,245,131 | -0.43 | 5.86 | -31,472 | 7,302,693 | |
| 2024-05-10 |
|
4 | DIBS |
1stdibs.com, Inc.
Common Stock |
S - Sale | -10,798 | 2,505,926 | -0.43 | 5.86 | -63,330 | 14,697,256 | |
| 2024-04-17 |
|
4 | DIBS |
1stdibs.com, Inc.
Common Stock |
S - Sale | -559 | 50,235 | -1.10 | 5.00 | -2,797 | 251,346 | |
| 2024-04-17 |
|
4 | DIBS |
1stdibs.com, Inc.
Common Stock |
S - Sale | -2,965 | 266,646 | -1.10 | 5.00 | -14,835 | 1,334,137 | |
| 2024-04-17 |
|
4 | DIBS |
1stdibs.com, Inc.
Common Stock |
S - Sale | -13,907 | 1,250,497 | -1.10 | 5.00 | -69,582 | 6,256,737 | |
| 2024-04-17 |
|
4 | DIBS |
1stdibs.com, Inc.
Common Stock |
S - Sale | -27,989 | 2,516,724 | -1.10 | 5.00 | -140,040 | 12,592,177 | |
| 2024-04-17 |
|
4 | DIBS |
1stdibs.com, Inc.
Common Stock |
S - Sale | -331 | 50,794 | -0.65 | 5.00 | -1,656 | 254,193 | |
| 2024-04-17 |
|
4 | DIBS |
1stdibs.com, Inc.
Common Stock |
S - Sale | -1,759 | 269,611 | -0.65 | 5.00 | -8,803 | 1,349,241 | |
| 2024-04-17 |
|
4 | DIBS |
1stdibs.com, Inc.
Common Stock |
S - Sale | -8,249 | 1,264,404 | -0.65 | 5.00 | -41,281 | 6,327,583 | |
| 2024-04-17 |
|
4 | DIBS |
1stdibs.com, Inc.
Common Stock |
S - Sale | -16,603 | 2,544,713 | -0.65 | 5.00 | -83,088 | 12,734,762 | |
| 2024-04-17 |
|
4 | DIBS |
1stdibs.com, Inc.
Common Stock |
S - Sale | -434 | 51,125 | -0.84 | 5.05 | -2,193 | 258,355 | |
| 2024-04-17 |
|
4 | DIBS |
1stdibs.com, Inc.
Common Stock |
S - Sale | -2,306 | 271,370 | -0.84 | 5.05 | -11,653 | 1,371,341 | |
| 2024-04-17 |
|
4 | DIBS |
1stdibs.com, Inc.
Common Stock |
S - Sale | -10,812 | 1,272,653 | -0.84 | 5.05 | -54,637 | 6,431,225 | |
| 2024-04-17 |
|
4 | DIBS |
1stdibs.com, Inc.
Common Stock |
S - Sale | -21,761 | 2,561,316 | -0.84 | 5.05 | -109,967 | 12,943,354 | |
| 2024-04-11 |
|
4 | NCNO |
nCino, Inc.
Common Stock |
J - Other | -139,650 | 810,349 | -14.70 | ||||
| 2024-04-11 |
|
4 | NCNO |
nCino, Inc.
Common Stock |
J - Other | -654,922 | 3,800,314 | -14.70 | ||||
| 2024-04-11 |
|
4 | NCNO |
nCino, Inc.
Common Stock |
J - Other | -26,310 | 152,670 | -14.70 | ||||
| 2024-04-11 |
|
4 | NCNO |
nCino, Inc.
Common Stock |
J - Other | -1,318,083 | 7,648,418 | -14.70 | ||||
| 2024-04-11 |
|
4 | NCNO |
nCino, Inc.
Common Stock |
J - Other | -61,626 | 0 | -100.00 | ||||
| 2024-04-11 |
|
4 | NCNO |
nCino, Inc.
Common Stock |
J - Other | -80,121 | 464,918 | -14.70 | ||||
| 2024-04-11 |
|
4 | NCNO |
nCino, Inc.
Common Stock |
J - Other | -414,190 | 2,403,417 | -14.70 | ||||
| 2024-04-11 |
|
4 | NCNO |
nCino, Inc.
Common Stock |
J - Other | -517,120 | 1,411,494 | -26.81 | ||||
| 2024-04-11 |
|
4 | NCNO |
nCino, Inc.
Common Stock |
J - Other | -487,347 | 2,827,926 | -14.70 | ||||
| 2024-04-11 |
|
4 | NCNO |
nCino, Inc.
Common Stock |
J - Other | -395,970 | 2,297,690 | -14.70 | ||||
| 2024-04-11 |
|
4 | NCNO |
nCino, Inc.
Common Stock |
J - Other | -430,634 | 2,498,839 | -14.70 | ||||
| 2024-04-11 |
|
4 | NCNO |
nCino, Inc.
Common Stock |
J - Other | -535,653 | 3,108,233 | -14.70 | ||||
| 2024-04-08 |
|
4 | DIBS |
1stdibs.com, Inc.
Common Stock |
S - Sale | -23 | 51,559 | -0.04 | 6.00 | -138 | 309,395 | |
| 2024-04-08 |
|
4 | DIBS |
1stdibs.com, Inc.
Common Stock |
S - Sale | -119 | 273,676 | -0.04 | 6.00 | -714 | 1,642,275 | |
| 2024-04-08 |
|
4 | DIBS |
1stdibs.com, Inc.
Common Stock |
S - Sale | -560 | 1,283,465 | -0.04 | 6.00 | -3,360 | 7,701,817 | |
| 2024-04-08 |
|
4 | DIBS |
1stdibs.com, Inc.
Common Stock |
S - Sale | -1,128 | 2,583,077 | -0.04 | 6.00 | -6,769 | 15,500,528 | |
| 2024-04-04 |
|
4 | NCNO |
nCino, Inc.
Common Stock |
S - Sale | -81,723 | 545,039 | -13.04 | 35.20 | -2,876,650 | 19,185,373 | |
| 2024-04-04 |
|
4 | NCNO |
nCino, Inc.
Common Stock |
S - Sale | -422,474 | 2,817,607 | -13.04 | 35.20 | -14,871,085 | 99,179,766 | |
| 2024-04-04 |
|
4 | NCNO |
nCino, Inc.
Common Stock |
S - Sale | -238,285 | 1,589,199 | -13.04 | 35.20 | -8,387,632 | 55,939,805 | |
| 2024-04-04 |
|
4 | NCNO |
nCino, Inc.
Common Stock |
S - Sale | -289,177 | 1,928,614 | -13.04 | 35.20 | -10,179,030 | 67,887,213 | |
| 2024-04-04 |
|
4 | NCNO |
nCino, Inc.
Common Stock |
S - Sale | -26,836 | 178,980 | -13.04 | 35.20 | -944,627 | 6,300,096 | |
| 2024-04-04 |
|
4 | NCNO |
nCino, Inc.
Common Stock |
S - Sale | -142,444 | 949,999 | -13.04 | 35.20 | -5,014,029 | 33,439,965 | |
| 2024-04-04 |
|
4 | NCNO |
nCino, Inc.
Common Stock |
S - Sale | -668,021 | 4,455,236 | -13.04 | 35.20 | -23,514,339 | 156,824,307 | |
| 2024-04-04 |
|
4 | NCNO |
nCino, Inc.
Common Stock |
S - Sale | -1,344,443 | 8,966,501 | -13.04 | 35.20 | -47,324,394 | 315,620,835 | |
| 2024-04-03 |
|
4 | DIBS |
1stdibs.com, Inc.
Common Stock |
S - Sale | -41 | 51,582 | -0.08 | 6.00 | -246 | 309,642 | |
| 2024-04-03 |
|
4 | DIBS |
1stdibs.com, Inc.
Common Stock |
S - Sale | -218 | 273,795 | -0.08 | 6.00 | -1,309 | 1,643,564 | |
| 2024-04-03 |
|
4 | DIBS |
1stdibs.com, Inc.
Common Stock |
S - Sale | -1,021 | 1,284,025 | -0.08 | 6.00 | -6,129 | 7,707,874 | |
| 2024-04-03 |
|
4 | DIBS |
1stdibs.com, Inc.
Common Stock |
S - Sale | -2,053 | 2,584,205 | -0.08 | 6.00 | -12,324 | 15,512,724 | |
| 2024-04-03 |
|
4 | DIBS |
1stdibs.com, Inc.
Common Stock |
S - Sale | -132 | 51,623 | -0.26 | 6.02 | -795 | 310,827 | |
| 2024-04-03 |
|
4 | DIBS |
1stdibs.com, Inc.
Common Stock |
S - Sale | -701 | 274,013 | -0.26 | 6.02 | -4,221 | 1,649,860 | |
| 2024-04-03 |
|
4 | DIBS |
1stdibs.com, Inc.
Common Stock |
S - Sale | -3,287 | 1,285,046 | -0.26 | 6.02 | -19,791 | 7,737,390 | |
| 2024-04-03 |
|
4 | DIBS |
1stdibs.com, Inc.
Common Stock |
S - Sale | -6,615 | 2,586,258 | -0.26 | 6.02 | -39,830 | 15,572,118 | |
| 2024-04-03 |
|
4 | DIBS |
1stdibs.com, Inc.
Common Stock |
S - Sale | -79 | 51,755 | -0.15 | 6.01 | -474 | 310,804 | |
| 2024-04-03 |
|
4 | DIBS |
1stdibs.com, Inc.
Common Stock |
S - Sale | -420 | 274,714 | -0.15 | 6.01 | -2,522 | 1,649,740 | |
| 2024-04-03 |
|
4 | DIBS |
1stdibs.com, Inc.
Common Stock |
S - Sale | -1,968 | 1,288,333 | -0.15 | 6.01 | -11,818 | 7,736,826 | |
| 2024-04-03 |
|
4 | DIBS |
1stdibs.com, Inc.
Common Stock |
S - Sale | -3,960 | 2,592,873 | -0.15 | 6.01 | -23,781 | 15,570,980 | |
| 2024-04-03 |
|
4 | S |
SentinelOne, Inc.
Class A Common Stock |
S - Sale | -21 | 5,764 | -0.36 | 23.10 | -485 | 133,148 | |
| 2024-04-03 |
|
4 | S |
SentinelOne, Inc.
Class A Common Stock |
S - Sale | -38 | 10,418 | -0.36 | 23.10 | -878 | 240,656 | |
| 2024-04-03 |
|
4 | S |
SentinelOne, Inc.
Class A Common Stock |
S - Sale | -312 | 85,089 | -0.37 | 23.10 | -7,207 | 1,965,556 | |
| 2024-04-03 |
|
4 | S |
SentinelOne, Inc.
Class A Common Stock |
S - Sale | -219 | 59,769 | -0.37 | 23.10 | -5,059 | 1,380,664 | |
| 2024-04-03 |
|
4 | S |
SentinelOne, Inc.
Class A Common Stock |
S - Sale | -1,092 | 92,501 | -1.17 | 23.10 | -25,225 | 2,136,773 | |
| 2024-04-03 |
|
4 | S |
SentinelOne, Inc.
Class A Common Stock |
S - Sale | -7,279 | 616,675 | -1.17 | 23.10 | -168,145 | 14,245,192 | |
| 2024-04-03 |
|
4 | S |
SentinelOne, Inc.
Class A Common Stock |
S - Sale | -37,632 | 3,187,931 | -1.17 | 23.10 | -869,299 | 73,641,206 | |
| 2024-04-03 |
|
4 | S |
SentinelOne, Inc.
Class A Common Stock |
S - Sale | -45,892 | 3,887,664 | -1.17 | 23.10 | -1,060,105 | 89,805,038 | |
| 2024-04-03 |
|
4 | S |
SentinelOne, Inc.
Class A Common Stock |
C - Conversion | 93,593 | 93,593 | |||||
| 2024-04-03 |
|
4 | S |
SentinelOne, Inc.
Class A Common Stock |
C - Conversion | 623,954 | 623,954 | |||||
| 2024-04-03 |
|
4 | S |
SentinelOne, Inc.
Class A Common Stock |
C - Conversion | 3,225,563 | 3,225,563 | |||||
| 2024-04-03 |
|
4 | S |
SentinelOne, Inc.
Class A Common Stock |
C - Conversion | 3,933,556 | 3,933,556 | |||||
| 2024-04-03 |
|
4 | S |
SentinelOne, Inc.
Class A Common Stock |
S - Sale | -463 | 39,208 | -1.17 | 23.10 | -10,695 | 905,705 | |
| 2024-04-03 |
|
4 | S |
SentinelOne, Inc.
Class A Common Stock |
S - Sale | -82 | 6,925 | -1.17 | 23.10 | -1,894 | 159,968 | |
| 2024-04-03 |
|
4 | S |
SentinelOne, Inc.
Class A Common Stock |
S - Sale | -59 | 5,025 | -1.16 | 23.10 | -1,363 | 116,078 | |
| 2024-04-03 |
|
4 | S |
SentinelOne, Inc.
Class A Common Stock |
S - Sale | -498 | 42,209 | -1.17 | 23.10 | -11,504 | 975,028 | |
| 2024-04-03 |
|
4 | S |
SentinelOne, Inc.
Class A Common Stock |
S - Sale | -3,902 | 330,576 | -1.17 | 23.10 | -90,136 | 7,636,306 | |
| 2024-04-03 |
|
4 | S |
SentinelOne, Inc.
Class A Common Stock |
S - Sale | -3,562 | 301,744 | -1.17 | 23.10 | -82,282 | 6,970,286 | |
| 2024-04-03 |
|
4 | S |
SentinelOne, Inc.
Class A Common Stock |
C - Conversion | 39,671 | 39,671 | |||||
| 2024-04-03 |
|
4 | S |
SentinelOne, Inc.
Class A Common Stock |
C - Conversion | 7,007 | 7,007 | |||||
| 2024-04-03 |
|
4 | S |
SentinelOne, Inc.
Class A Common Stock |
C - Conversion | 5,084 | 5,084 | |||||
| 2024-04-03 |
|
4 | S |
SentinelOne, Inc.
Class A Common Stock |
C - Conversion | 42,707 | 42,707 | |||||
| 2024-04-03 |
|
4 | S |
SentinelOne, Inc.
Class A Common Stock |
C - Conversion | 334,478 | 334,478 | |||||
| 2024-04-03 |
|
4 | S |
SentinelOne, Inc.
Class A Common Stock |
C - Conversion | 305,306 | 305,306 | |||||
| 2024-04-03 |
|
4 | NCNO |
nCino, Inc.
Common Stock |
S - Sale | -497,094 | 3,315,273 | -13.04 | 35.20 | -17,497,709 | 116,697,610 | |
| 2024-04-03 |
|
4 | NCNO |
nCino, Inc.
Common Stock |
S - Sale | -403,889 | 2,693,660 | -13.04 | 35.20 | -14,216,893 | 94,816,832 | |
| 2024-04-03 |
|
4 | NCNO |
nCino, Inc.
Common Stock |
S - Sale | -439,247 | 2,929,473 | -13.04 | 35.20 | -15,461,494 | 103,117,450 | |
| 2024-04-03 |
|
4 | NCNO |
nCino, Inc.
Common Stock |
S - Sale | -546,367 | 3,643,886 | -13.04 | 35.20 | -19,232,118 | 128,264,787 | |
| 2024-03-29 |
|
4 | DIBS |
1stdibs.com, Inc.
Common Stock |
S - Sale | -1,348 | 51,834 | -2.53 | 6.02 | -8,115 | 312,056 | |
| 2024-03-29 |
|
4 | DIBS |
1stdibs.com, Inc.
Common Stock |
S - Sale | -7,150 | 275,134 | -2.53 | 6.02 | -43,045 | 1,656,389 | |
| 2024-03-29 |
|
4 | DIBS |
1stdibs.com, Inc.
Common Stock |
S - Sale | -33,540 | 1,290,301 | -2.53 | 6.02 | -201,921 | 7,767,999 | |
| 2024-03-29 |
|
4 | DIBS |
1stdibs.com, Inc.
Common Stock |
S - Sale | -67,506 | 2,596,833 | -2.53 | 6.02 | -406,406 | 15,633,714 | |
| 2024-03-29 |
|
4 | DIBS |
1stdibs.com, Inc.
Common Stock |
S - Sale | -412 | 53,182 | -0.77 | 6.03 | -2,486 | 320,921 | |
| 2024-03-29 |
|
4 | DIBS |
1stdibs.com, Inc.
Common Stock |
S - Sale | -2,189 | 282,284 | -0.77 | 6.03 | -13,209 | 1,703,415 | |
| 2024-03-29 |
|
4 | DIBS |
1stdibs.com, Inc.
Common Stock |
S - Sale | -10,264 | 1,323,841 | -0.77 | 6.03 | -61,937 | 7,988,586 | |
| 2024-03-29 |
|
4 | DIBS |
1stdibs.com, Inc.
Common Stock |
S - Sale | -20,657 | 2,664,339 | -0.77 | 6.03 | -124,653 | 16,077,687 | |
| 2024-03-26 |
|
4 | DIBS |
1stdibs.com, Inc.
Common Stock |
S - Sale | -611 | 53,594 | -1.13 | 6.11 | -3,731 | 327,293 | |
| 2024-03-26 |
|
4 | DIBS |
1stdibs.com, Inc.
Common Stock |
S - Sale | -3,245 | 284,473 | -1.13 | 6.11 | -19,817 | 1,737,248 | |
| 2024-03-26 |
|
4 | DIBS |
1stdibs.com, Inc.
Common Stock |
S - Sale | -15,218 | 1,334,105 | -1.13 | 6.11 | -92,935 | 8,147,246 | |
| 2024-03-26 |
|
4 | DIBS |
1stdibs.com, Inc.
Common Stock |
S - Sale | -30,627 | 2,684,996 | -1.13 | 6.11 | -187,036 | 16,397,002 | |
| 2024-03-26 |
|
4 | DIBS |
1stdibs.com, Inc.
Common Stock |
S - Sale | -396 | 54,205 | -0.73 | 6.06 | -2,400 | 328,564 | |
| 2024-03-26 |
|
4 | DIBS |
1stdibs.com, Inc.
Common Stock |
S - Sale | -2,102 | 287,718 | -0.73 | 6.06 | -12,741 | 1,744,003 | |
| 2024-03-26 |
|
4 | DIBS |
1stdibs.com, Inc.
Common Stock |
S - Sale | -9,857 | 1,349,323 | -0.73 | 6.06 | -59,748 | 8,178,921 | |
| 2024-03-26 |
|
4 | DIBS |
1stdibs.com, Inc.
Common Stock |
S - Sale | -19,838 | 2,715,623 | -0.73 | 6.06 | -120,248 | 16,460,749 | |
| 2024-03-26 |
|
4 | DIBS |
1stdibs.com, Inc.
Common Stock |
S - Sale | -293 | 54,601 | -0.53 | 6.19 | -1,814 | 338,040 | |
| 2024-03-26 |
|
4 | DIBS |
1stdibs.com, Inc.
Common Stock |
S - Sale | -1,557 | 289,820 | -0.53 | 6.19 | -9,640 | 1,794,305 | |
| 2024-03-26 |
|
4 | DIBS |
1stdibs.com, Inc.
Common Stock |
S - Sale | -7,302 | 1,359,180 | -0.53 | 6.19 | -45,207 | 8,414,819 | |
| 2024-03-26 |
|
4 | DIBS |
1stdibs.com, Inc.
Common Stock |
S - Sale | -14,695 | 2,735,461 | -0.53 | 6.19 | -90,978 | 16,935,513 | |
| 2024-03-21 |
|
4 | DIBS |
1stdibs.com, Inc.
Common Stock |
S - Sale | -396 | 54,894 | -0.72 | 6.04 | -2,391 | 331,455 | |
| 2024-03-21 |
|
4 | DIBS |
1stdibs.com, Inc.
Common Stock |
S - Sale | -2,102 | 291,377 | -0.72 | 6.04 | -12,692 | 1,759,363 | |
| 2024-03-21 |
|
4 | DIBS |
1stdibs.com, Inc.
Common Stock |
S - Sale | -9,858 | 1,366,482 | -0.72 | 6.04 | -59,524 | 8,250,955 | |
| 2024-03-21 |
|
4 | DIBS |
1stdibs.com, Inc.
Common Stock |
S - Sale | -19,841 | 2,750,156 | -0.72 | 6.04 | -119,802 | 16,605,717 | |
| 2024-03-21 |
|
4 | DIBS |
1stdibs.com, Inc.
Common Stock |
S - Sale | -714 | 55,290 | -1.27 | 6.02 | -4,301 | 333,067 | |
| 2024-03-21 |
|
4 | DIBS |
1stdibs.com, Inc.
Common Stock |
S - Sale | -3,789 | 293,479 | -1.27 | 6.02 | -22,825 | 1,767,917 | |
| 2024-03-21 |
|
4 | DIBS |
1stdibs.com, Inc.
Common Stock |
S - Sale | -17,769 | 1,376,340 | -1.27 | 6.02 | -107,040 | 8,291,072 | |
| 2024-03-21 |
|
4 | DIBS |
1stdibs.com, Inc.
Common Stock |
S - Sale | -35,760 | 2,769,997 | -1.27 | 6.02 | -215,418 | 16,686,462 | |
| 2024-03-21 |
|
4 | DIBS |
1stdibs.com, Inc.
Common Stock |
S - Sale | -108 | 56,004 | -0.19 | 6.01 | -649 | 336,746 | |
| 2024-03-21 |
|
4 | DIBS |
1stdibs.com, Inc.
Common Stock |
S - Sale | -572 | 297,268 | -0.19 | 6.01 | -3,439 | 1,787,443 | |
| 2024-03-21 |
|
4 | DIBS |
1stdibs.com, Inc.
Common Stock |
S - Sale | -2,680 | 1,394,109 | -0.19 | 6.01 | -16,115 | 8,382,638 | |
| 2024-03-21 |
|
4 | DIBS |
1stdibs.com, Inc.
Common Stock |
S - Sale | -5,394 | 2,805,757 | -0.19 | 6.01 | -32,434 | 16,870,736 | |
| 2024-03-18 |
|
4 | DIBS |
1stdibs.com, Inc.
Common Stock |
S - Sale | -218 | 56,112 | -0.39 | 6.02 | -1,313 | 337,856 | |
| 2024-03-18 |
|
4 | DIBS |
1stdibs.com, Inc.
Common Stock |
S - Sale | -1,156 | 297,840 | -0.39 | 6.02 | -6,960 | 1,793,324 | |
| 2024-03-18 |
|
4 | DIBS |
1stdibs.com, Inc.
Common Stock |
S - Sale | -5,423 | 1,396,789 | -0.39 | 6.02 | -32,652 | 8,410,206 | |
| 2024-03-18 |
|
4 | DIBS |
1stdibs.com, Inc.
Common Stock |
S - Sale | -10,913 | 2,811,151 | -0.39 | 6.02 | -65,708 | 16,926,221 | |
| 2024-03-18 |
|
4 | DIBS |
1stdibs.com, Inc.
Common Stock |
S - Sale | -178 | 56,330 | -0.31 | 6.06 | -1,079 | 341,433 | |
| 2024-03-18 |
|
4 | DIBS |
1stdibs.com, Inc.
Common Stock |
S - Sale | -943 | 298,996 | -0.31 | 6.06 | -5,716 | 1,812,304 | |
| 2024-03-18 |
|
4 | DIBS |
1stdibs.com, Inc.
Common Stock |
S - Sale | -4,422 | 1,402,212 | -0.31 | 6.06 | -26,803 | 8,499,228 | |
| 2024-03-18 |
|
4 | DIBS |
1stdibs.com, Inc.
Common Stock |
S - Sale | -8,898 | 2,822,064 | -0.31 | 6.06 | -53,933 | 17,105,377 | |
| 2024-03-18 |
|
4 | DIBS |
1stdibs.com, Inc.
Common Stock |
S - Sale | -370 | 56,508 | -0.65 | 6.14 | -2,271 | 346,840 | |
| 2024-03-18 |
|
4 | DIBS |
1stdibs.com, Inc.
Common Stock |
S - Sale | -1,963 | 299,939 | -0.65 | 6.14 | -12,049 | 1,840,996 | |
| 2024-03-18 |
|
4 | DIBS |
1stdibs.com, Inc.
Common Stock |
S - Sale | -9,204 | 1,406,634 | -0.65 | 6.14 | -56,493 | 8,633,779 | |
| 2024-03-18 |
|
4 | DIBS |
1stdibs.com, Inc.
Common Stock |
S - Sale | -18,522 | 2,830,962 | -0.65 | 6.14 | -113,686 | 17,376,162 | |
| 2024-01-09 |
|
4 | S |
SentinelOne, Inc.
Class A Common Stock |
S - Sale | -65,913 | 0 | -100.00 | 22.76 | -1,500,180 | ||
| 2024-01-09 |
|
4 | S |
SentinelOne, Inc.
Class A Common Stock |
S - Sale | -439,426 | 0 | -100.00 | 22.76 | -10,001,336 | ||
| 2024-01-09 |
|
4 | S |
SentinelOne, Inc.
Class A Common Stock |
S - Sale | -2,271,642 | 0 | -100.00 | 22.76 | -51,702,572 | ||
| 2024-01-09 |
|
4 | S |
SentinelOne, Inc.
Class A Common Stock |
S - Sale | -2,770,254 | 0 | -100.00 | 22.76 | -63,050,981 | ||
| 2024-01-09 |
|
4 | S |
SentinelOne, Inc.
Class A Common Stock |
C - Conversion | 764 | 65,913 | 1.17 | ||||
| 2024-01-09 |
|
4 | S |
SentinelOne, Inc.
Class A Common Stock |
C - Conversion | 5,098 | 439,426 | 1.17 | ||||
| 2024-01-09 |
|
4 | S |
SentinelOne, Inc.
Class A Common Stock |
C - Conversion | 26,350 | 2,271,642 | 1.17 | ||||
| 2024-01-09 |
|
4 | S |
SentinelOne, Inc.
Class A Common Stock |
C - Conversion | 32,134 | 2,770,254 | 1.17 | ||||
| 2024-01-09 |
|
4 | S |
SentinelOne, Inc.
Class A Common Stock |
S - Sale | -1,277 | 5,785 | -18.08 | 22.76 | -29,065 | 131,667 | |
| 2024-01-09 |
|
4 | S |
SentinelOne, Inc.
Class A Common Stock |
S - Sale | -2,307 | 10,456 | -18.08 | 22.76 | -52,507 | 237,979 | |
| 2024-01-09 |
|
4 | S |
SentinelOne, Inc.
Class A Common Stock |
S - Sale | -18,843 | 85,401 | -18.08 | 22.76 | -428,867 | 1,943,727 | |
| 2024-01-09 |
|
4 | S |
SentinelOne, Inc.
Class A Common Stock |
S - Sale | -13,235 | 59,988 | -18.07 | 22.76 | -301,229 | 1,365,327 | |
| 2024-01-09 |
|
4 | S |
SentinelOne, Inc.
Class A Common Stock |
S - Sale | -27,939 | 0 | -100.00 | 22.76 | -635,892 | ||
| 2024-01-09 |
|
4 | S |
SentinelOne, Inc.
Class A Common Stock |
S - Sale | -4,934 | 0 | -100.00 | 22.76 | -112,298 | ||
| 2024-01-09 |
|
4 | S |
SentinelOne, Inc.
Class A Common Stock |
S - Sale | -3,580 | 0 | -100.00 | 22.76 | -81,481 | ||
| 2024-01-09 |
|
4 | S |
SentinelOne, Inc.
Class A Common Stock |
S - Sale | -30,076 | 0 | -100.00 | 22.76 | -684,530 | ||
| 2024-01-09 |
|
4 | S |
SentinelOne, Inc.
Class A Common Stock |
S - Sale | -235,560 | 0 | -100.00 | 22.76 | -5,361,346 | ||
| 2024-01-09 |
|
4 | S |
SentinelOne, Inc.
Class A Common Stock |
S - Sale | -215,014 | 0 | -100.00 | 22.76 | -4,893,719 | ||
| 2024-01-09 |
|
4 | S |
SentinelOne, Inc.
Class A Common Stock |
C - Conversion | 326 | 27,939 | 1.18 | ||||
| 2024-01-09 |
|
4 | S |
SentinelOne, Inc.
Class A Common Stock |
C - Conversion | 58 | 4,934 | 1.19 | ||||
| 2024-01-09 |
|
4 | S |
SentinelOne, Inc.
Class A Common Stock |
C - Conversion | 42 | 3,580 | 1.19 | ||||
| 2024-01-09 |
|
4 | S |
SentinelOne, Inc.
Class A Common Stock |
C - Conversion | 350 | 30,076 | 1.18 | ||||
| 2024-01-09 |
|
4 | S |
SentinelOne, Inc.
Class A Common Stock |
C - Conversion | 2,732 | 235,560 | 1.17 | ||||
| 2024-01-09 |
|
4 | S |
SentinelOne, Inc.
Class A Common Stock |
C - Conversion | 2,494 | 215,014 | 1.17 | ||||
| 2024-01-05 |
|
4 | S |
SentinelOne, Inc.
Class A Common Stock |
S - Sale | -4,993 | 65,149 | -7.12 | 23.85 | -119,083 | 1,553,804 | |
| 2024-01-05 |
|
4 | S |
SentinelOne, Inc.
Class A Common Stock |
S - Sale | -33,290 | 434,328 | -7.12 | 23.85 | -793,966 | 10,358,723 | |
| 2024-01-05 |
|
4 | S |
SentinelOne, Inc.
Class A Common Stock |
S - Sale | -172,092 | 2,245,292 | -7.12 | 23.85 | -4,104,394 | 53,550,214 | |
| 2024-01-05 |
|
4 | S |
SentinelOne, Inc.
Class A Common Stock |
S - Sale | -209,865 | 2,738,120 | -7.12 | 23.85 | -5,005,280 | 65,304,162 | |
| 2024-01-05 |
|
4 | S |
SentinelOne, Inc.
Class A Common Stock |
S - Sale | -4,732 | 70,142 | -6.32 | 24.56 | -116,218 | 1,722,688 | |
| 2024-01-05 |
|
4 | S |
SentinelOne, Inc.
Class A Common Stock |
S - Sale | -31,544 | 467,618 | -6.32 | 24.56 | -774,721 | 11,484,698 | |
| 2024-01-05 |
|
4 | S |
SentinelOne, Inc.
Class A Common Stock |
S - Sale | -163,066 | 2,417,384 | -6.32 | 24.56 | -4,004,901 | 59,370,951 | |
| 2024-01-05 |
|
4 | S |
SentinelOne, Inc.
Class A Common Stock |
S - Sale | -198,859 | 2,947,985 | -6.32 | 24.56 | -4,883,977 | 72,402,512 | |
| 2024-01-05 |
|
4 | S |
SentinelOne, Inc.
Class A Common Stock |
S - Sale | -97 | 7,062 | -1.35 | 23.85 | -2,313 | 168,429 | |
| 2024-01-05 |
|
4 | S |
SentinelOne, Inc.
Class A Common Stock |
S - Sale | -175 | 12,763 | -1.35 | 23.85 | -4,174 | 304,398 | |
| 2024-01-05 |
|
4 | S |
SentinelOne, Inc.
Class A Common Stock |
S - Sale | -1,428 | 104,244 | -1.35 | 23.85 | -34,058 | 2,486,219 | |
| 2024-01-05 |
|
4 | S |
SentinelOne, Inc.
Class A Common Stock |
S - Sale | -1,003 | 73,223 | -1.35 | 23.85 | -23,922 | 1,746,369 | |
| 2024-01-05 |
|
4 | S |
SentinelOne, Inc.
Class A Common Stock |
S - Sale | -92 | 7,159 | -1.27 | 24.56 | -2,260 | 175,825 | |
| 2024-01-05 |
|
4 | S |
SentinelOne, Inc.
Class A Common Stock |
S - Sale | -166 | 12,938 | -1.27 | 24.56 | -4,077 | 317,757 | |
| 2024-01-05 |
|
4 | S |
SentinelOne, Inc.
Class A Common Stock |
S - Sale | -1,353 | 105,672 | -1.26 | 24.56 | -33,230 | 2,595,304 | |
| 2024-01-05 |
|
4 | S |
SentinelOne, Inc.
Class A Common Stock |
S - Sale | -950 | 74,226 | -1.26 | 24.56 | -23,332 | 1,822,991 | |
| 2024-01-05 |
|
4 | S |
SentinelOne, Inc.
Class A Common Stock |
S - Sale | -2,117 | 27,613 | -7.12 | 23.85 | -50,490 | 658,570 | |
| 2024-01-05 |
|
4 | S |
SentinelOne, Inc.
Class A Common Stock |
S - Sale | -374 | 4,876 | -7.12 | 23.85 | -8,920 | 116,293 | |
| 2024-01-05 |
|
4 | S |
SentinelOne, Inc.
Class A Common Stock |
S - Sale | -271 | 3,538 | -7.11 | 23.85 | -6,463 | 84,381 | |
| 2024-01-05 |
|
4 | S |
SentinelOne, Inc.
Class A Common Stock |
S - Sale | -2,279 | 29,726 | -7.12 | 23.85 | -54,354 | 708,965 | |
| 2024-01-05 |
|
4 | S |
SentinelOne, Inc.
Class A Common Stock |
S - Sale | -17,845 | 232,828 | -7.12 | 23.85 | -425,603 | 5,552,948 | |
| 2024-01-05 |
|
4 | S |
SentinelOne, Inc.
Class A Common Stock |
S - Sale | -16,289 | 212,520 | -7.12 | 23.85 | -388,493 | 5,068,602 | |
| 2024-01-05 |
|
4 | S |
SentinelOne, Inc.
Class A Common Stock |
S - Sale | -2,006 | 29,730 | -6.32 | 24.56 | -49,267 | 730,169 | |
| 2024-01-05 |
|
4 | S |
SentinelOne, Inc.
Class A Common Stock |
S - Sale | -354 | 5,250 | -6.32 | 24.56 | -8,694 | 128,940 | |
| 2024-01-05 |
|
4 | S |
SentinelOne, Inc.
Class A Common Stock |
S - Sale | -257 | 3,809 | -6.32 | 24.56 | -6,312 | 93,549 | |
| 2024-01-05 |
|
4 | S |
SentinelOne, Inc.
Class A Common Stock |
S - Sale | -2,159 | 32,005 | -6.32 | 24.56 | -53,025 | 786,043 | |
| 2024-01-05 |
|
4 | S |
SentinelOne, Inc.
Class A Common Stock |
S - Sale | -16,909 | 250,673 | -6.32 | 24.56 | -415,285 | 6,156,529 | |
| 2024-01-05 |
|
4 | S |
SentinelOne, Inc.
Class A Common Stock |
S - Sale | -15,435 | 228,809 | -6.32 | 24.56 | -379,084 | 5,619,549 | |
| 2023-12-18 |
|
4 | UDMY |
Udemy, Inc.
Common Stock |
J - Other | -2,552,139 | 24,203,192 | -9.54 | ||||
| 2023-12-18 |
|
4 | UDMY |
Udemy, Inc.
Common Stock |
J - Other | -59,071 | 560,198 | -9.54 | ||||
| 2023-12-18 |
|
4 | UDMY |
Udemy, Inc.
Common Stock |
J - Other | -161,430 | 1,530,921 | -9.54 | ||||
| 2023-12-18 |
|
4 | UDMY |
Udemy, Inc.
Common Stock |
J - Other | -1,123,505 | 10,654,754 | -9.54 | ||||
| 2023-12-18 |
|
4 | UDMY |
Udemy, Inc.
Common Stock |
J - Other | -103,855 | 984,909 | -9.54 | ||||
| 2023-12-05 |
|
4 | DIBS |
1stdibs.com, Inc.
Common Stock |
S - Sale | -297 | 56,878 | -0.52 | 4.32 | -1,282 | 245,451 | |
| 2023-12-05 |
|
4 | DIBS |
1stdibs.com, Inc.
Common Stock |
S - Sale | -1,570 | 301,902 | -0.52 | 4.32 | -6,775 | 1,302,828 | |
| 2023-12-05 |
|
4 | DIBS |
1stdibs.com, Inc.
Common Stock |
S - Sale | -7,371 | 1,415,838 | -0.52 | 4.32 | -31,809 | 6,109,907 | |
| 2023-12-05 |
|
4 | DIBS |
1stdibs.com, Inc.
Common Stock |
S - Sale | -14,836 | 2,849,484 | -0.52 | 4.32 | -64,023 | 12,296,663 | |
| 2023-12-05 |
|
4 | DIBS |
1stdibs.com, Inc.
Common Stock |
S - Sale | -463 | 57,175 | -0.80 | 4.34 | -2,007 | 247,882 | |
| 2023-12-05 |
|
4 | DIBS |
1stdibs.com, Inc.
Common Stock |
S - Sale | -2,458 | 303,472 | -0.80 | 4.34 | -10,657 | 1,315,703 | |
| 2023-12-05 |
|
4 | DIBS |
1stdibs.com, Inc.
Common Stock |
S - Sale | -11,526 | 1,423,209 | -0.80 | 4.34 | -49,971 | 6,170,323 | |
| 2023-12-05 |
|
4 | DIBS |
1stdibs.com, Inc.
Common Stock |
S - Sale | -23,196 | 2,864,320 | -0.80 | 4.34 | -100,566 | 12,418,259 | |
| 2023-12-01 |
|
4 | DIBS |
1stdibs.com, Inc.
Common Stock |
S - Sale | -215 | 57,638 | -0.37 | 4.28 | -919 | 246,426 | |
| 2023-12-01 |
|
4 | DIBS |
1stdibs.com, Inc.
Common Stock |
S - Sale | -1,143 | 305,930 | -0.37 | 4.28 | -4,887 | 1,307,973 | |
| 2023-12-01 |
|
4 | DIBS |
1stdibs.com, Inc.
Common Stock |
S - Sale | -5,359 | 1,434,735 | -0.37 | 4.28 | -22,912 | 6,134,066 | |
| 2023-12-01 |
|
4 | DIBS |
1stdibs.com, Inc.
Common Stock |
S - Sale | -10,786 | 2,887,516 | -0.37 | 4.28 | -46,114 | 12,345,286 | |
| 2023-12-01 |
|
4 | DIBS |
1stdibs.com, Inc.
Common Stock |
S - Sale | -251 | 57,853 | -0.43 | 4.28 | -1,074 | 247,559 | |
| 2023-12-01 |
|
4 | DIBS |
1stdibs.com, Inc.
Common Stock |
S - Sale | -1,332 | 307,073 | -0.43 | 4.28 | -5,700 | 1,313,996 | |
| 2023-12-01 |
|
4 | DIBS |
1stdibs.com, Inc.
Common Stock |
S - Sale | -6,248 | 1,440,094 | -0.43 | 4.28 | -26,736 | 6,162,306 | |
| 2023-12-01 |
|
4 | DIBS |
1stdibs.com, Inc.
Common Stock |
S - Sale | -12,574 | 2,898,302 | -0.43 | 4.28 | -53,805 | 12,402,124 | |
| 2023-12-01 |
|
4 | DIBS |
1stdibs.com, Inc.
Common Stock |
S - Sale | -679 | 58,104 | -1.16 | 4.29 | -2,913 | 249,231 | |
| 2023-12-01 |
|
4 | DIBS |
1stdibs.com, Inc.
Common Stock |
S - Sale | -3,605 | 308,405 | -1.16 | 4.29 | -15,463 | 1,322,872 | |
| 2023-12-01 |
|
4 | DIBS |
1stdibs.com, Inc.
Common Stock |
S - Sale | -16,904 | 1,446,342 | -1.16 | 4.29 | -72,508 | 6,203,939 | |
| 2023-12-01 |
|
4 | DIBS |
1stdibs.com, Inc.
Common Stock |
S - Sale | -34,021 | 2,910,876 | -1.16 | 4.29 | -145,930 | 12,485,912 | |
| 2023-11-30 |
|
4 | S |
SentinelOne, Inc.
Class A Common Stock |
C - Conversion | 15,868 | 31,736 | 100.00 | ||||
| 2023-11-30 |
|
4 | S |
SentinelOne, Inc.
Class A Common Stock |
C - Conversion | 2,802 | 5,604 | 100.00 | ||||
| 2023-11-30 |
|
4 | S |
SentinelOne, Inc.
Class A Common Stock |
C - Conversion | 2,033 | 4,066 | 100.00 | ||||
| 2023-11-30 |
|
4 | S |
SentinelOne, Inc.
Class A Common Stock |
C - Conversion | 17,082 | 34,164 | 100.00 | ||||
| 2023-11-30 |
|
4 | S |
SentinelOne, Inc.
Class A Common Stock |
C - Conversion | 133,791 | 267,582 | 100.00 | ||||
| 2023-11-30 |
|
4 | S |
SentinelOne, Inc.
Class A Common Stock |
C - Conversion | 122,122 | 244,244 | 100.00 | ||||
| 2023-11-30 |
|
4 | S |
SentinelOne, Inc.
Class A Common Stock |
C - Conversion | 37,437 | 74,874 | 100.00 | ||||
| 2023-11-30 |
|
4 | S |
SentinelOne, Inc.
Class A Common Stock |
C - Conversion | 249,581 | 499,162 | 100.00 | ||||
| 2023-11-30 |
|
4 | S |
SentinelOne, Inc.
Class A Common Stock |
C - Conversion | 1,290,225 | 2,580,450 | 100.00 | ||||
| 2023-11-30 |
|
4 | S |
SentinelOne, Inc.
Class A Common Stock |
C - Conversion | 1,573,422 | 3,146,844 | 100.00 | ||||
| 2023-11-28 |
|
4 | DIBS |
1stdibs.com, Inc.
Common Stock |
S - Sale | -413 | 58,783 | -0.70 | 4.29 | -1,771 | 252,103 | |
| 2023-11-28 |
|
4 | DIBS |
1stdibs.com, Inc.
Common Stock |
S - Sale | -2,194 | 312,010 | -0.70 | 4.29 | -9,409 | 1,338,117 | |
| 2023-11-28 |
|
4 | DIBS |
1stdibs.com, Inc.
Common Stock |
S - Sale | -10,289 | 1,463,246 | -0.70 | 4.29 | -44,126 | 6,275,423 | |
| 2023-11-28 |
|
4 | DIBS |
1stdibs.com, Inc.
Common Stock |
S - Sale | -20,709 | 2,944,897 | -0.70 | 4.29 | -88,815 | 12,629,780 | |
| 2023-11-28 |
|
4 | DIBS |
1stdibs.com, Inc.
Common Stock |
S - Sale | -384 | 59,196 | -0.64 | 4.28 | -1,645 | 253,631 | |
| 2023-11-28 |
|
4 | DIBS |
1stdibs.com, Inc.
Common Stock |
S - Sale | -2,038 | 314,204 | -0.64 | 4.28 | -8,732 | 1,346,238 | |
| 2023-11-28 |
|
4 | DIBS |
1stdibs.com, Inc.
Common Stock |
S - Sale | -9,558 | 1,473,535 | -0.64 | 4.28 | -40,952 | 6,313,508 | |
| 2023-11-28 |
|
4 | DIBS |
1stdibs.com, Inc.
Common Stock |
S - Sale | -19,237 | 2,965,606 | -0.64 | 4.28 | -82,423 | 12,706,435 | |
| 2023-11-28 |
|
4 | DIBS |
1stdibs.com, Inc.
Common Stock |
S - Sale | -380 | 59,580 | -0.63 | 4.31 | -1,639 | 257,052 | |
| 2023-11-28 |
|
4 | DIBS |
1stdibs.com, Inc.
Common Stock |
S - Sale | -2,019 | 316,242 | -0.63 | 4.31 | -8,711 | 1,364,394 | |
| 2023-11-28 |
|
4 | DIBS |
1stdibs.com, Inc.
Common Stock |
S - Sale | -9,468 | 1,483,093 | -0.63 | 4.31 | -40,849 | 6,398,656 | |
| 2023-11-28 |
|
4 | DIBS |
1stdibs.com, Inc.
Common Stock |
S - Sale | -19,055 | 2,984,843 | -0.63 | 4.31 | -82,211 | 12,877,807 | |
| 2023-11-22 |
|
4 | DIBS |
1stdibs.com, Inc.
Common Stock |
S - Sale | -1,650 | 59,960 | -2.68 | 4.31 | -7,109 | 258,344 | |
| 2023-11-22 |
|
4 | DIBS |
1stdibs.com, Inc.
Common Stock |
S - Sale | -8,759 | 318,261 | -2.68 | 4.31 | -37,739 | 1,371,259 | |
| 2023-11-22 |
|
4 | DIBS |
1stdibs.com, Inc.
Common Stock |
S - Sale | -41,075 | 1,492,561 | -2.68 | 4.31 | -176,976 | 6,430,848 | |
| 2023-11-22 |
|
4 | DIBS |
1stdibs.com, Inc.
Common Stock |
S - Sale | -82,667 | 3,003,898 | -2.68 | 4.31 | -356,179 | 12,942,595 | |
| 2023-11-22 |
|
4 | DIBS |
1stdibs.com, Inc.
Common Stock |
S - Sale | -185 | 61,610 | -0.30 | 4.30 | -796 | 265,145 | |
| 2023-11-22 |
|
4 | DIBS |
1stdibs.com, Inc.
Common Stock |
S - Sale | -984 | 327,020 | -0.30 | 4.30 | -4,235 | 1,407,363 | |
| 2023-11-22 |
|
4 | DIBS |
1stdibs.com, Inc.
Common Stock |
S - Sale | -4,613 | 1,533,636 | -0.30 | 4.30 | -19,853 | 6,600,156 | |
| 2023-11-22 |
|
4 | DIBS |
1stdibs.com, Inc.
Common Stock |
S - Sale | -9,283 | 3,086,565 | -0.30 | 4.30 | -39,950 | 13,283,341 | |
| 2023-11-20 |
|
4 | DIBS |
1stdibs.com, Inc.
Common Stock |
S - Sale | -291 | 61,795 | -0.47 | 4.47 | -1,301 | 276,304 | |
| 2023-11-20 |
|
4 | DIBS |
1stdibs.com, Inc.
Common Stock |
S - Sale | -1,544 | 328,004 | -0.47 | 4.47 | -6,904 | 1,466,604 | |
| 2023-11-20 |
|
4 | DIBS |
1stdibs.com, Inc.
Common Stock |
S - Sale | -7,243 | 1,538,249 | -0.47 | 4.47 | -32,386 | 6,877,973 | |
| 2023-11-20 |
|
4 | DIBS |
1stdibs.com, Inc.
Common Stock |
S - Sale | -14,577 | 3,095,848 | -0.47 | 4.47 | -65,178 | 13,842,465 | |
| 2023-11-20 |
|
4 | DIBS |
1stdibs.com, Inc.
Common Stock |
S - Sale | -108 | 62,086 | -0.17 | 4.54 | -490 | 281,603 | |
| 2023-11-20 |
|
4 | DIBS |
1stdibs.com, Inc.
Common Stock |
S - Sale | -574 | 329,548 | -0.17 | 4.54 | -2,603 | 1,494,731 | |
| 2023-11-20 |
|
4 | DIBS |
1stdibs.com, Inc.
Common Stock |
S - Sale | -2,690 | 1,545,492 | -0.17 | 4.54 | -12,201 | 7,009,888 | |
| 2023-11-20 |
|
4 | DIBS |
1stdibs.com, Inc.
Common Stock |
S - Sale | -5,413 | 3,110,425 | -0.17 | 4.54 | -24,552 | 14,107,955 | |
| 2023-11-20 |
|
4 | DIBS |
1stdibs.com, Inc.
Common Stock |
S - Sale | -100 | 62,194 | -0.16 | 4.67 | -467 | 290,154 | |
| 2023-11-20 |
|
4 | DIBS |
1stdibs.com, Inc.
Common Stock |
S - Sale | -530 | 330,122 | -0.16 | 4.67 | -2,473 | 1,540,118 | |
| 2023-11-20 |
|
4 | DIBS |
1stdibs.com, Inc.
Common Stock |
S - Sale | -2,486 | 1,548,182 | -0.16 | 4.67 | -11,598 | 7,222,733 | |
| 2023-11-20 |
|
4 | DIBS |
1stdibs.com, Inc.
Common Stock |
S - Sale | -5,002 | 3,115,838 | -0.16 | 4.67 | -23,336 | 14,536,319 | |
| 2022-03-07 |
|
4 | USER |
UserTesting, Inc.
Common Stock |
P - Purchase | 34,896 | 10,500,190 | 0.33 | 9.91 | 345,837 | 104,062,133 | |
| 2022-03-07 |
|
4 | USER |
UserTesting, Inc.
Common Stock |
P - Purchase | 581 | 174,847 | 0.33 | 9.91 | 5,758 | 1,732,821 | |
| 2022-03-07 |
|
4 | USER |
UserTesting, Inc.
Common Stock |
P - Purchase | 801 | 240,988 | 0.33 | 9.91 | 7,938 | 2,388,312 | |
| 2022-03-07 |
|
4 | USER |
UserTesting, Inc.
Common Stock |
P - Purchase | 4,534 | 1,364,391 | 0.33 | 9.91 | 44,934 | 13,521,797 | |
| 2022-03-07 |
|
4 | USER |
UserTesting, Inc.
Common Stock |
P - Purchase | 4,881 | 1,468,794 | 0.33 | 9.91 | 48,373 | 14,556,483 | |
| 2022-03-07 |
|
4 | USER |
UserTesting, Inc.
Common Stock |
P - Purchase | 38,232 | 11,503,494 | 0.33 | 9.91 | 378,898 | 114,005,377 | |
| 2022-03-07 |
|
4 | USER |
UserTesting, Inc.
Common Stock |
P - Purchase | 343 | 10,465,294 | 0.00 | 10.00 | 3,430 | 104,652,940 | |
| 2022-03-07 |
|
4 | USER |
UserTesting, Inc.
Common Stock |
P - Purchase | 6 | 174,266 | 0.00 | 10.00 | 60 | 1,742,660 | |
| 2022-03-07 |
|
4 | USER |
UserTesting, Inc.
Common Stock |
P - Purchase | 8 | 240,187 | 0.00 | 10.00 | 80 | 2,401,870 | |
| 2022-03-07 |
|
4 | USER |
UserTesting, Inc.
Common Stock |
P - Purchase | 45 | 1,359,857 | 0.00 | 10.00 | 450 | 13,598,570 | |
| 2022-03-07 |
|
4 | USER |
UserTesting, Inc.
Common Stock |
P - Purchase | 48 | 1,463,913 | 0.00 | 10.00 | 480 | 14,639,130 | |
| 2022-03-07 |
|
4 | USER |
UserTesting, Inc.
Common Stock |
P - Purchase | 375 | 11,465,262 | 0.00 | 10.00 | 3,750 | 114,652,620 | |
| 2022-03-07 |
|
4 | USER |
UserTesting, Inc.
Common Stock |
P - Purchase | 36,927 | 10,464,951 | 0.35 | 9.42 | 347,982 | 98,616,466 | |
| 2022-03-07 |
|
4 | USER |
UserTesting, Inc.
Common Stock |
P - Purchase | 615 | 174,260 | 0.35 | 9.42 | 5,795 | 1,642,139 | |
| 2022-03-07 |
|
4 | USER |
UserTesting, Inc.
Common Stock |
P - Purchase | 847 | 240,179 | 0.35 | 9.42 | 7,982 | 2,263,327 | |
| 2022-03-07 |
|
4 | USER |
UserTesting, Inc.
Common Stock |
P - Purchase | 4,798 | 1,359,812 | 0.35 | 9.42 | 45,214 | 12,814,188 | |
| 2022-03-07 |
|
4 | USER |
UserTesting, Inc.
Common Stock |
P - Purchase | 5,165 | 1,463,865 | 0.35 | 9.42 | 48,672 | 13,794,732 | |
| 2022-03-07 |
|
4 | USER |
UserTesting, Inc.
Common Stock |
P - Purchase | 40,456 | 11,464,887 | 0.35 | 9.42 | 381,237 | 108,039,363 | |
| 2022-03-02 |
|
4 | USER |
UserTesting, Inc.
Common Stock |
P - Purchase | 73,571 | 10,428,024 | 0.71 | 9.65 | 709,901 | 100,622,089 | |
| 2022-03-02 |
|
4 | USER |
UserTesting, Inc.
Common Stock |
P - Purchase | 1,225 | 173,645 | 0.71 | 9.65 | 11,820 | 1,675,535 | |
| 2022-03-02 |
|
4 | USER |
UserTesting, Inc.
Common Stock |
P - Purchase | 1,689 | 239,332 | 0.71 | 9.65 | 16,297 | 2,309,362 | |
| 2022-03-02 |
|
4 | USER |
UserTesting, Inc.
Common Stock |
P - Purchase | 9,560 | 1,355,014 | 0.71 | 9.65 | 92,246 | 13,074,801 | |
| 2022-03-02 |
|
4 | USER |
UserTesting, Inc.
Common Stock |
P - Purchase | 10,291 | 1,458,700 | 0.71 | 9.65 | 99,300 | 14,075,288 | |
| 2022-03-02 |
|
4 | USER |
UserTesting, Inc.
Common Stock |
P - Purchase | 80,600 | 11,424,431 | 0.71 | 9.65 | 777,726 | 110,236,620 | |
| 2022-03-02 |
|
4 | USER |
UserTesting, Inc.
Common Stock |
P - Purchase | 829 | 10,354,453 | 0.01 | 9.77 | 8,101 | 101,187,856 | |
| 2022-03-02 |
|
4 | USER |
UserTesting, Inc.
Common Stock |
P - Purchase | 14 | 172,420 | 0.01 | 9.77 | 137 | 1,684,957 | |
| 2022-03-02 |
|
4 | USER |
UserTesting, Inc.
Common Stock |
P - Purchase | 19 | 237,643 | 0.01 | 9.77 | 186 | 2,322,342 | |
| 2022-03-02 |
|
4 | USER |
UserTesting, Inc.
Common Stock |
P - Purchase | 107 | 1,345,454 | 0.01 | 9.77 | 1,046 | 13,148,315 | |
| 2022-03-02 |
|
4 | USER |
UserTesting, Inc.
Common Stock |
P - Purchase | 116 | 1,448,409 | 0.01 | 9.77 | 1,134 | 14,154,432 | |
| 2022-03-02 |
|
4 | USER |
UserTesting, Inc.
Common Stock |
P - Purchase | 909 | 11,343,831 | 0.01 | 9.77 | 8,883 | 110,856,454 | |
| 2022-03-02 |
|
4 | USER |
UserTesting, Inc.
Common Stock |
P - Purchase | 567 | 10,353,624 | 0.01 | 8.49 | 4,814 | 87,902,268 | |
| 2022-03-02 |
|
4 | USER |
UserTesting, Inc.
Common Stock |
P - Purchase | 9 | 172,406 | 0.01 | 8.49 | 76 | 1,463,727 | |
| 2022-03-02 |
|
4 | USER |
UserTesting, Inc.
Common Stock |
P - Purchase | 13 | 237,624 | 0.01 | 8.49 | 110 | 2,017,428 | |
| 2022-03-02 |
|
4 | USER |
UserTesting, Inc.
Common Stock |
P - Purchase | 74 | 1,345,347 | 0.01 | 8.49 | 628 | 11,421,996 | |
| 2022-03-02 |
|
4 | USER |
UserTesting, Inc.
Common Stock |
P - Purchase | 79 | 1,448,293 | 0.01 | 8.49 | 671 | 12,296,008 | |
| 2022-03-02 |
|
4 | USER |
UserTesting, Inc.
Common Stock |
P - Purchase | 621 | 11,342,922 | 0.01 | 8.49 | 5,272 | 96,301,408 | |
| 2022-03-02 |
|
4 | USER |
UserTesting, Inc.
Common Stock |
P - Purchase | 41,819 | 10,353,057 | 0.41 | 8.13 | 339,922 | 84,153,789 | |
| 2022-03-02 |
|
4 | USER |
UserTesting, Inc.
Common Stock |
P - Purchase | 696 | 172,397 | 0.41 | 8.13 | 5,657 | 1,401,312 | |
| 2022-03-02 |
|
4 | USER |
UserTesting, Inc.
Common Stock |
P - Purchase | 960 | 237,611 | 0.41 | 8.13 | 7,803 | 1,931,397 | |
| 2022-03-02 |
|
4 | USER |
UserTesting, Inc.
Common Stock |
P - Purchase | 5,434 | 1,345,273 | 0.41 | 8.13 | 44,170 | 10,934,917 | |
| 2022-03-02 |
|
4 | USER |
UserTesting, Inc.
Common Stock |
P - Purchase | 5,850 | 1,448,214 | 0.41 | 8.13 | 47,551 | 11,771,663 | |
| 2022-03-02 |
|
4 | USER |
UserTesting, Inc.
Common Stock |
P - Purchase | 45,815 | 11,342,301 | 0.41 | 8.13 | 372,403 | 92,194,759 | |
| 2022-02-25 |
|
4 | USER |
UserTesting, Inc.
Common Stock |
P - Purchase | 33,624 | 10,311,238 | 0.33 | 8.08 | 271,749 | 83,335,426 | |
| 2022-02-25 |
|
4 | USER |
UserTesting, Inc.
Common Stock |
P - Purchase | 560 | 171,701 | 0.33 | 8.08 | 4,526 | 1,387,687 | |
| 2022-02-25 |
|
4 | USER |
UserTesting, Inc.
Common Stock |
P - Purchase | 772 | 236,651 | 0.33 | 8.08 | 6,239 | 1,912,613 | |
| 2022-02-25 |
|
4 | USER |
UserTesting, Inc.
Common Stock |
P - Purchase | 4,369 | 1,339,839 | 0.33 | 8.08 | 35,310 | 10,828,579 | |
| 2022-02-25 |
|
4 | USER |
UserTesting, Inc.
Common Stock |
P - Purchase | 4,703 | 1,442,364 | 0.33 | 8.08 | 38,010 | 11,657,186 | |
| 2022-02-25 |
|
4 | USER |
UserTesting, Inc.
Common Stock |
P - Purchase | 36,836 | 11,296,486 | 0.33 | 8.08 | 297,709 | 91,298,200 | |
| 2022-02-25 |
|
4 | USER |
UserTesting, Inc.
Common Stock |
P - Purchase | 31,300 | 10,277,614 | 0.31 | 7.91 | 247,611 | 81,305,177 | |
| 2022-02-25 |
|
4 | USER |
UserTesting, Inc.
Common Stock |
P - Purchase | 521 | 171,141 | 0.31 | 7.91 | 4,122 | 1,353,879 | |
| 2022-02-25 |
|
4 | USER |
UserTesting, Inc.
Common Stock |
P - Purchase | 718 | 235,879 | 0.31 | 7.91 | 5,680 | 1,866,015 | |
| 2022-02-25 |
|
4 | USER |
UserTesting, Inc.
Common Stock |
P - Purchase | 4,067 | 1,335,470 | 0.31 | 7.91 | 32,174 | 10,564,770 | |
| 2022-02-25 |
|
4 | USER |
UserTesting, Inc.
Common Stock |
P - Purchase | 4,378 | 1,437,661 | 0.31 | 7.91 | 34,634 | 11,373,192 | |
| 2022-02-25 |
|
4 | USER |
UserTesting, Inc.
Common Stock |
P - Purchase | 34,292 | 11,259,650 | 0.31 | 7.91 | 271,281 | 89,073,965 | |
| 2022-02-25 |
|
4 | USER |
UserTesting, Inc.
Common Stock |
P - Purchase | 38,674 | 10,246,314 | 0.38 | 8.01 | 309,659 | 82,041,212 | |
| 2022-02-25 |
|
4 | USER |
UserTesting, Inc.
Common Stock |
P - Purchase | 644 | 170,620 | 0.38 | 8.01 | 5,156 | 1,366,137 | |
| 2022-02-25 |
|
4 | USER |
UserTesting, Inc.
Common Stock |
P - Purchase | 888 | 235,161 | 0.38 | 8.01 | 7,110 | 1,882,911 | |
| 2022-02-25 |
|
4 | USER |
UserTesting, Inc.
Common Stock |
P - Purchase | 5,025 | 1,331,403 | 0.38 | 8.01 | 40,235 | 10,660,411 | |
| 2022-02-25 |
|
4 | USER |
UserTesting, Inc.
Common Stock |
P - Purchase | 5,410 | 1,433,283 | 0.38 | 8.01 | 43,317 | 11,476,154 | |
| 2022-02-25 |
|
4 | USER |
UserTesting, Inc.
Common Stock |
P - Purchase | 42,368 | 11,225,358 | 0.38 | 8.01 | 339,236 | 89,880,319 | |
| 2022-02-22 |
|
4 | USER |
UserTesting, Inc.
Common Stock |
P - Purchase | 16,715 | 10,207,640 | 0.16 | 8.11 | 135,634 | 82,829,895 | |
| 2022-02-22 |
|
4 | USER |
UserTesting, Inc.
Common Stock |
P - Purchase | 278 | 169,976 | 0.16 | 8.11 | 2,256 | 1,379,270 | |
| 2022-02-22 |
|
4 | USER |
UserTesting, Inc.
Common Stock |
P - Purchase | 384 | 234,273 | 0.16 | 8.11 | 3,116 | 1,901,008 | |
| 2022-02-22 |
|
4 | USER |
UserTesting, Inc.
Common Stock |
P - Purchase | 2,172 | 1,326,378 | 0.16 | 8.11 | 17,625 | 10,762,894 | |
| 2022-02-22 |
|
4 | USER |
UserTesting, Inc.
Common Stock |
P - Purchase | 2,338 | 1,427,873 | 0.16 | 8.11 | 18,972 | 11,586,475 | |
| 2022-02-22 |
|
4 | USER |
UserTesting, Inc.
Common Stock |
P - Purchase | 18,313 | 11,182,990 | 0.16 | 8.11 | 148,601 | 90,744,372 | |
| 2022-02-22 |
|
4 | USER |
UserTesting, Inc.
Common Stock |
P - Purchase | 14,966 | 10,190,925 | 0.15 | 8.47 | 126,725 | 86,291,657 | |
| 2022-02-22 |
|
4 | USER |
UserTesting, Inc.
Common Stock |
P - Purchase | 249 | 169,698 | 0.15 | 8.47 | 2,108 | 1,436,918 | |
| 2022-02-22 |
|
4 | USER |
UserTesting, Inc.
Common Stock |
P - Purchase | 343 | 233,889 | 0.15 | 8.47 | 2,904 | 1,980,455 | |
| 2022-02-22 |
|
4 | USER |
UserTesting, Inc.
Common Stock |
P - Purchase | 1,945 | 1,324,206 | 0.15 | 8.47 | 16,469 | 11,212,714 | |
| 2022-02-22 |
|
4 | USER |
UserTesting, Inc.
Common Stock |
P - Purchase | 2,094 | 1,425,535 | 0.15 | 8.47 | 17,731 | 12,070,718 | |
| 2022-02-22 |
|
4 | USER |
UserTesting, Inc.
Common Stock |
P - Purchase | 16,397 | 11,164,677 | 0.15 | 8.47 | 138,842 | 94,536,902 | |
| 2022-02-22 |
|
4 | USER |
UserTesting, Inc.
Common Stock |
P - Purchase | 28,251 | 10,175,959 | 0.28 | 8.75 | 247,095 | 89,003,008 | |
| 2022-02-22 |
|
4 | USER |
UserTesting, Inc.
Common Stock |
P - Purchase | 470 | 169,449 | 0.28 | 8.75 | 4,111 | 1,482,069 | |
| 2022-02-22 |
|
4 | USER |
UserTesting, Inc.
Common Stock |
P - Purchase | 648 | 233,546 | 0.28 | 8.75 | 5,668 | 2,042,687 | |
| 2022-02-22 |
|
4 | USER |
UserTesting, Inc.
Common Stock |
P - Purchase | 3,671 | 1,322,261 | 0.28 | 8.75 | 32,108 | 11,565,024 | |
| 2022-02-22 |
|
4 | USER |
UserTesting, Inc.
Common Stock |
P - Purchase | 3,952 | 1,423,441 | 0.28 | 8.75 | 34,566 | 12,449,984 | |
| 2022-02-22 |
|
4 | USER |
UserTesting, Inc.
Common Stock |
P - Purchase | 30,952 | 11,148,280 | 0.28 | 8.75 | 270,719 | 97,507,316 | |
| 2022-02-16 |
|
4 | USER |
UserTesting, Inc.
Common Stock |
P - Purchase | 20,843 | 10,147,708 | 0.21 | 9.20 | 191,804 | 93,382,253 | |
| 2022-02-16 |
|
4 | USER |
UserTesting, Inc.
Common Stock |
P - Purchase | 347 | 168,979 | 0.21 | 9.20 | 3,193 | 1,554,995 | |
| 2022-02-16 |
|
4 | USER |
UserTesting, Inc.
Common Stock |
P - Purchase | 478 | 232,898 | 0.21 | 9.20 | 4,399 | 2,143,197 | |
| 2022-02-16 |
|
4 | USER |
UserTesting, Inc.
Common Stock |
P - Purchase | 2,708 | 1,318,590 | 0.21 | 9.20 | 24,920 | 12,134,061 | |
| 2022-02-16 |
|
4 | USER |
UserTesting, Inc.
Common Stock |
P - Purchase | 2,916 | 1,419,489 | 0.21 | 9.20 | 26,834 | 13,062,564 | |
| 2022-02-16 |
|
4 | USER |
UserTesting, Inc.
Common Stock |
P - Purchase | 22,834 | 11,117,328 | 0.21 | 9.20 | 210,125 | 102,304,987 | |
| 2022-02-16 |
|
4 | USER |
UserTesting, Inc.
Common Stock |
P - Purchase | 14,692 | 10,126,865 | 0.15 | 9.38 | 137,799 | 94,981,892 | |
| 2022-02-16 |
|
4 | USER |
UserTesting, Inc.
Common Stock |
P - Purchase | 245 | 168,632 | 0.15 | 9.38 | 2,298 | 1,581,633 | |
| 2022-02-16 |
|
4 | USER |
UserTesting, Inc.
Common Stock |
P - Purchase | 337 | 232,420 | 0.15 | 9.38 | 3,161 | 2,179,914 | |
| 2022-02-16 |
|
4 | USER |
UserTesting, Inc.
Common Stock |
P - Purchase | 1,909 | 1,315,882 | 0.15 | 9.38 | 17,905 | 12,341,920 | |
| 2022-02-16 |
|
4 | USER |
UserTesting, Inc.
Common Stock |
P - Purchase | 2,055 | 1,416,573 | 0.15 | 9.38 | 19,274 | 13,286,321 | |
| 2022-02-16 |
|
4 | USER |
UserTesting, Inc.
Common Stock |
P - Purchase | 16,096 | 11,094,494 | 0.15 | 9.38 | 150,968 | 104,057,478 | |
| 2022-02-16 |
|
4 | USER |
UserTesting, Inc.
Common Stock |
P - Purchase | 2,094 | 10,112,173 | 0.02 | 8.82 | 18,475 | 89,215,658 | |
| 2022-02-16 |
|
4 | USER |
UserTesting, Inc.
Common Stock |
P - Purchase | 35 | 168,387 | 0.02 | 8.82 | 309 | 1,485,611 | |
| 2022-02-16 |
|
4 | USER |
UserTesting, Inc.
Common Stock |
P - Purchase | 48 | 232,083 | 0.02 | 8.82 | 423 | 2,047,575 | |
| 2022-02-16 |
|
4 | USER |
UserTesting, Inc.
Common Stock |
P - Purchase | 272 | 1,313,973 | 0.02 | 8.82 | 2,400 | 11,592,658 | |
| 2022-02-16 |
|
4 | USER |
UserTesting, Inc.
Common Stock |
P - Purchase | 293 | 1,414,518 | 0.02 | 8.82 | 2,585 | 12,479,727 | |
| 2022-02-16 |
|
4 | USER |
UserTesting, Inc.
Common Stock |
P - Purchase | 2,293 | 11,078,398 | 0.02 | 8.82 | 20,230 | 97,740,274 | |
| 2022-02-11 |
|
4 | USER |
UserTesting, Inc.
Common Stock |
P - Purchase | 41,181 | 10,110,079 | 0.41 | 8.61 | 354,704 | 87,081,143 | |
| 2022-02-11 |
|
4 | USER |
UserTesting, Inc.
Common Stock |
P - Purchase | 686 | 168,352 | 0.41 | 8.61 | 5,909 | 1,450,066 | |
| 2022-02-11 |
|
4 | USER |
UserTesting, Inc.
Common Stock |
P - Purchase | 945 | 232,035 | 0.41 | 8.61 | 8,140 | 1,998,587 | |
| 2022-02-11 |
|
4 | USER |
UserTesting, Inc.
Common Stock |
P - Purchase | 5,351 | 1,313,701 | 0.41 | 8.61 | 46,090 | 11,315,301 | |
| 2022-02-11 |
|
4 | USER |
UserTesting, Inc.
Common Stock |
P - Purchase | 5,760 | 1,414,225 | 0.41 | 8.61 | 49,613 | 12,181,144 | |
| 2022-02-11 |
|
4 | USER |
UserTesting, Inc.
Common Stock |
P - Purchase | 45,116 | 11,076,105 | 0.41 | 8.61 | 388,598 | 95,401,815 | |
| 2022-02-11 |
|
4 | USER |
UserTesting, Inc.
Common Stock |
P - Purchase | 27,397 | 10,068,898 | 0.27 | 9.02 | 247,252 | 90,869,791 | |
| 2022-02-11 |
|
4 | USER |
UserTesting, Inc.
Common Stock |
P - Purchase | 456 | 167,666 | 0.27 | 9.02 | 4,115 | 1,513,152 | |
| 2022-02-11 |
|
4 | USER |
UserTesting, Inc.
Common Stock |
P - Purchase | 629 | 231,090 | 0.27 | 9.02 | 5,677 | 2,085,541 | |
| 2022-02-11 |
|
4 | USER |
UserTesting, Inc.
Common Stock |
P - Purchase | 3,560 | 1,308,350 | 0.27 | 9.02 | 32,128 | 11,807,597 | |
| 2022-02-11 |
|
4 | USER |
UserTesting, Inc.
Common Stock |
P - Purchase | 3,832 | 1,408,465 | 0.27 | 9.02 | 34,583 | 12,711,115 | |
| 2022-02-11 |
|
4 | USER |
UserTesting, Inc.
Common Stock |
P - Purchase | 30,014 | 11,030,989 | 0.27 | 9.02 | 270,870 | 99,552,470 | |
| 2022-02-11 |
|
4 | USER |
UserTesting, Inc.
Common Stock |
P - Purchase | 14,916 | 10,041,501 | 0.15 | 8.50 | 126,740 | 85,321,630 | |
| 2022-02-11 |
|
4 | USER |
UserTesting, Inc.
Common Stock |
P - Purchase | 248 | 167,210 | 0.15 | 8.50 | 2,107 | 1,420,767 | |
| 2022-02-11 |
|
4 | USER |
UserTesting, Inc.
Common Stock |
P - Purchase | 342 | 230,461 | 0.15 | 8.50 | 2,906 | 1,958,204 | |
| 2022-02-11 |
|
4 | USER |
UserTesting, Inc.
Common Stock |
P - Purchase | 1,938 | 1,304,790 | 0.15 | 8.50 | 16,467 | 11,086,670 | |
| 2022-02-11 |
|
4 | USER |
UserTesting, Inc.
Common Stock |
P - Purchase | 2,086 | 1,404,633 | 0.15 | 8.50 | 17,725 | 11,935,026 | |
| 2022-02-11 |
|
4 | USER |
UserTesting, Inc.
Common Stock |
P - Purchase | 16,342 | 11,000,975 | 0.15 | 8.50 | 138,856 | 93,474,184 | |
| 2022-02-08 |
|
4 | USER |
UserTesting, Inc.
Common Stock |
P - Purchase | 17,455 | 10,026,585 | 0.17 | 8.16 | 142,462 | 81,833,979 | |
| 2022-02-08 |
|
4 | USER |
UserTesting, Inc.
Common Stock |
P - Purchase | 291 | 166,962 | 0.17 | 8.16 | 2,375 | 1,362,694 | |
| 2022-02-08 |
|
4 | USER |
UserTesting, Inc.
Common Stock |
P - Purchase | 401 | 230,119 | 0.17 | 8.16 | 3,273 | 1,878,162 | |
| 2022-02-08 |
|
4 | USER |
UserTesting, Inc.
Common Stock |
P - Purchase | 2,268 | 1,302,852 | 0.17 | 8.16 | 18,511 | 10,633,487 | |
| 2022-02-08 |
|
4 | USER |
UserTesting, Inc.
Common Stock |
P - Purchase | 2,442 | 1,402,547 | 0.17 | 8.16 | 19,931 | 11,447,168 | |
| 2022-02-08 |
|
4 | USER |
UserTesting, Inc.
Common Stock |
P - Purchase | 19,122 | 10,984,633 | 0.17 | 8.16 | 156,068 | 89,653,279 | |
| 2022-02-08 |
|
4 | USER |
UserTesting, Inc.
Common Stock |
P - Purchase | 33,754 | 10,009,130 | 0.34 | 7.69 | 259,508 | 76,952,193 | |
| 2022-02-08 |
|
4 | USER |
UserTesting, Inc.
Common Stock |
P - Purchase | 562 | 166,671 | 0.34 | 7.69 | 4,321 | 1,281,400 | |
| 2022-02-08 |
|
4 | USER |
UserTesting, Inc.
Common Stock |
P - Purchase | 775 | 229,718 | 0.34 | 7.69 | 5,958 | 1,766,118 | |
| 2022-02-08 |
|
4 | USER |
UserTesting, Inc.
Common Stock |
P - Purchase | 4,386 | 1,300,584 | 0.34 | 7.69 | 33,720 | 9,999,150 | |
| 2022-02-08 |
|
4 | USER |
UserTesting, Inc.
Common Stock |
P - Purchase | 4,722 | 1,400,105 | 0.34 | 7.69 | 36,304 | 10,764,287 | |
| 2022-02-08 |
|
4 | USER |
UserTesting, Inc.
Common Stock |
P - Purchase | 36,978 | 10,965,511 | 0.34 | 7.69 | 284,294 | 84,305,042 | |
| 2022-02-08 |
|
4 | USER |
UserTesting, Inc.
Common Stock |
P - Purchase | 106,932 | 9,975,376 | 1.08 | 7.49 | 801,177 | 74,739,507 | |
| 2022-02-08 |
|
4 | USER |
UserTesting, Inc.
Common Stock |
P - Purchase | 1,781 | 166,109 | 1.08 | 7.49 | 13,344 | 1,244,555 | |
| 2022-02-08 |
|
4 | USER |
UserTesting, Inc.
Common Stock |
P - Purchase | 2,454 | 228,943 | 1.08 | 7.49 | 18,386 | 1,715,333 | |
| 2022-02-08 |
|
4 | USER |
UserTesting, Inc.
Common Stock |
P - Purchase | 13,895 | 1,296,198 | 1.08 | 7.49 | 104,107 | 9,711,634 | |
| 2022-02-08 |
|
4 | USER |
UserTesting, Inc.
Common Stock |
P - Purchase | 14,958 | 1,395,383 | 1.08 | 7.49 | 112,071 | 10,454,768 | |
| 2022-02-08 |
|
4 | USER |
UserTesting, Inc.
Common Stock |
P - Purchase | 117,148 | 10,928,533 | 1.08 | 7.49 | 877,720 | 81,880,941 | |
| 2022-02-03 |
|
4 | USER |
UserTesting, Inc.
Common Stock |
P - Purchase | 97,608 | 9,868,444 | 1.00 | 6.78 | 661,558 | 66,885,353 | |
| 2022-02-03 |
|
4 | USER |
UserTesting, Inc.
Common Stock |
P - Purchase | 1,625 | 164,328 | 1.00 | 6.78 | 11,014 | 1,113,766 | |
| 2022-02-03 |
|
4 | USER |
UserTesting, Inc.
Common Stock |
P - Purchase | 2,240 | 226,489 | 1.00 | 6.78 | 15,182 | 1,535,074 | |
| 2022-02-03 |
|
4 | USER |
UserTesting, Inc.
Common Stock |
P - Purchase | 12,683 | 1,282,303 | 1.00 | 6.78 | 85,962 | 8,691,065 | |
| 2022-02-03 |
|
4 | USER |
UserTesting, Inc.
Common Stock |
P - Purchase | 13,654 | 1,380,425 | 1.00 | 6.78 | 92,543 | 9,356,107 | |
| 2022-02-03 |
|
4 | USER |
UserTesting, Inc.
Common Stock |
P - Purchase | 106,936 | 10,811,385 | 1.00 | 6.78 | 724,780 | 73,276,324 | |
| 2022-02-03 |
|
4 | USER |
UserTesting, Inc.
Common Stock |
P - Purchase | 17,346 | 9,770,836 | 0.18 | 6.41 | 111,221 | 62,649,623 | |
| 2022-02-03 |
|
4 | USER |
UserTesting, Inc.
Common Stock |
P - Purchase | 290 | 162,703 | 0.18 | 6.41 | 1,859 | 1,043,235 | |
| 2022-02-03 |
|
4 | USER |
UserTesting, Inc.
Common Stock |
P - Purchase | 398 | 224,249 | 0.18 | 6.41 | 2,552 | 1,437,862 | |
| 2022-02-03 |
|
4 | USER |
UserTesting, Inc.
Common Stock |
P - Purchase | 2,254 | 1,269,620 | 0.18 | 6.41 | 14,452 | 8,140,676 | |
| 2022-02-03 |
|
4 | USER |
UserTesting, Inc.
Common Stock |
P - Purchase | 2,426 | 1,366,771 | 0.18 | 6.41 | 15,555 | 8,763,599 | |
| 2022-02-03 |
|
4 | USER |
UserTesting, Inc.
Common Stock |
P - Purchase | 19,002 | 10,704,449 | 0.18 | 6.41 | 121,839 | 68,635,857 | |
| 2022-02-03 |
|
4 | USER |
UserTesting, Inc.
Common Stock |
P - Purchase | 424,640 | 9,753,490 | 4.55 | 6.13 | 2,603,638 | 59,802,549 | |
| 2022-02-03 |
|
4 | USER |
UserTesting, Inc.
Common Stock |
P - Purchase | 7,070 | 162,413 | 4.55 | 6.13 | 43,349 | 995,819 | |
| 2022-02-03 |
|
4 | USER |
UserTesting, Inc.
Common Stock |
P - Purchase | 9,746 | 223,851 | 4.55 | 6.13 | 59,757 | 1,372,520 | |
| 2022-02-03 |
|
4 | USER |
UserTesting, Inc.
Common Stock |
P - Purchase | 55,178 | 1,267,366 | 4.55 | 6.13 | 338,318 | 7,770,728 | |
| 2022-02-03 |
|
4 | USER |
UserTesting, Inc.
Common Stock |
P - Purchase | 59,400 | 1,364,345 | 4.55 | 6.13 | 364,205 | 8,365,345 | |
| 2022-02-03 |
|
4 | USER |
UserTesting, Inc.
Common Stock |
P - Purchase | 465,215 | 10,685,447 | 4.55 | 6.13 | 2,852,419 | 65,516,750 | |
| 2022-01-11 |
|
4 | NCNO |
nCino OpCo, Inc.
Common Stock |
D - Sale to Issuer | -9,547 | 0 | -100.00 | ||||
| 2022-01-11 |
|
4 | NCNO |
nCino OpCo, Inc.
Common Stock |
D - Sale to Issuer | -205,816 | 0 | -100.00 | ||||
| 2022-01-11 |
|
4 | NCNO |
nCino OpCo, Inc.
Common Stock |
D - Sale to Issuer | -1,092,443 | 0 | -100.00 | ||||
| 2022-01-11 |
|
4 | NCNO |
nCino OpCo, Inc.
Common Stock |
D - Sale to Issuer | -5,123,257 | 0 | -100.00 | ||||
| 2022-01-11 |
|
4 | NCNO |
nCino OpCo, Inc.
Common Stock |
D - Sale to Issuer | -10,310,944 | 0 | -100.00 | ||||
| 2022-01-11 |
|
4 | NCNO |
nCino OpCo, Inc.
Common Stock |
D - Sale to Issuer | -3,812,367 | 0 | -100.00 | ||||
| 2022-01-11 |
|
4 | NCNO |
nCino OpCo, Inc.
Common Stock |
D - Sale to Issuer | -3,097,549 | 0 | -100.00 | ||||
| 2022-01-11 |
|
4 | NCNO |
nCino OpCo, Inc.
Common Stock |
D - Sale to Issuer | -3,368,720 | 0 | -100.00 | ||||
| 2022-01-11 |
|
4 | NCNO |
nCino OpCo, Inc.
Common Stock |
D - Sale to Issuer | -4,190,253 | 0 | -100.00 | ||||
| 2022-01-11 | 3 | NCNO |
nCino, Inc.
Common Stock |
4,190,253 | ||||||||
| 2022-01-11 | 3 | NCNO |
nCino, Inc.
Common Stock |
3,368,720 | ||||||||
| 2022-01-11 | 3 | NCNO |
nCino, Inc.
Common Stock |
3,097,549 | ||||||||
| 2022-01-11 | 3 | NCNO |
nCino, Inc.
Common Stock |
3,812,367 | ||||||||
| 2022-01-11 | 3 | NCNO |
nCino, Inc.
Common Stock |
2,217,791 | ||||||||
| 2022-01-11 | 3 | NCNO |
nCino, Inc.
Common Stock |
1,827,484 | ||||||||
| 2022-01-11 | 3 | NCNO |
nCino, Inc.
Common Stock |
3,240,081 | ||||||||
| 2022-01-11 | 3 | NCNO |
nCino, Inc.
Common Stock |
626,762 | ||||||||
| 2022-01-11 | 3 | NCNO |
nCino, Inc.
Common Stock |
10,310,944 | ||||||||
| 2022-01-11 | 3 | NCNO |
nCino, Inc.
Common Stock |
5,123,257 | ||||||||
| 2022-01-11 | 3 | NCNO |
nCino, Inc.
Common Stock |
1,092,443 | ||||||||
| 2022-01-11 | 3 | NCNO |
nCino, Inc.
Common Stock |
205,816 | ||||||||
| 2022-01-11 | 3 | NCNO |
nCino, Inc.
Common Stock |
9,547 | ||||||||
| 2022-01-11 |
|
4 | NCNO |
nCino, Inc.
Common Stock |
A - Award | 9,547 | 9,547 | |||||
| 2022-01-11 |
|
4 | NCNO |
nCino, Inc.
Common Stock |
A - Award | 205,816 | 205,816 | |||||
| 2022-01-11 |
|
4 | NCNO |
nCino, Inc.
Common Stock |
A - Award | 1,092,443 | 1,092,443 | |||||
| 2022-01-11 |
|
4 | NCNO |
nCino, Inc.
Common Stock |
A - Award | 5,123,257 | 5,123,257 | |||||
| 2022-01-11 |
|
4 | NCNO |
nCino, Inc.
Common Stock |
A - Award | 10,310,944 | 10,310,944 | |||||
| 2022-01-11 |
|
4 | NCNO |
nCino, Inc.
Common Stock |
A - Award | 3,812,367 | 3,812,367 | |||||
| 2022-01-11 |
|
4 | NCNO |
nCino, Inc.
Common Stock |
A - Award | 3,097,549 | 3,097,549 | |||||
| 2022-01-11 |
|
4 | NCNO |
nCino, Inc.
Common Stock |
A - Award | 3,368,720 | 3,368,720 | |||||
| 2022-01-11 |
|
4 | NCNO |
nCino, Inc.
Common Stock |
A - Award | 4,190,253 | 4,190,253 | |||||
| 2022-01-11 |
|
4 | NCNO |
nCino, Inc.
Common Stock |
A - Award | 626,762 | 626,762 | |||||
| 2022-01-11 |
|
4 | NCNO |
nCino, Inc.
Common Stock |
A - Award | 3,240,081 | 3,240,081 | |||||
| 2022-01-11 |
|
4 | NCNO |
nCino, Inc.
Common Stock |
A - Award | 1,827,484 | 1,827,484 | |||||
| 2022-01-11 |
|
4 | NCNO |
nCino, Inc.
Common Stock |
A - Award | 2,217,791 | 2,217,791 | |||||
| 2021-11-22 |
|
4 | USER |
UserTesting, Inc.
Series F Convertible Preferred Stock |
C - Conversion | -9,328,850 | 0 | -100.00 | ||||
| 2021-11-22 |
|
4 | USER |
UserTesting, Inc.
Series F Convertible Preferred Stock |
C - Conversion | -155,343 | 0 | -100.00 | ||||
| 2021-11-22 |
|
4 | USER |
UserTesting, Inc.
Series F Convertible Preferred Stock |
C - Conversion | -214,105 | 0 | -100.00 | ||||
| 2021-11-22 |
|
4 | USER |
UserTesting, Inc.
Series F Convertible Preferred Stock |
C - Conversion | -1,212,188 | 0 | -100.00 | ||||
| 2021-11-22 |
|
4 | USER |
UserTesting, Inc.
Series F Convertible Preferred Stock |
C - Conversion | -1,304,945 | 0 | -100.00 | ||||
| 2021-11-22 |
|
4 | USER |
UserTesting, Inc.
Series F Convertible Preferred Stock |
C - Conversion | -10,220,232 | 0 | -100.00 | ||||
| 2021-11-22 |
|
4 | USER |
UserTesting, Inc.
Common Stock |
C - Conversion | 9,328,850 | 9,328,850 | |||||
| 2021-11-22 |
|
4 | USER |
UserTesting, Inc.
Common Stock |
C - Conversion | 155,343 | 155,343 | |||||
| 2021-11-22 |
|
4 | USER |
UserTesting, Inc.
Common Stock |
C - Conversion | 214,105 | 214,105 | |||||
| 2021-11-22 |
|
4 | USER |
UserTesting, Inc.
Common Stock |
C - Conversion | 1,212,188 | 1,212,188 | |||||
| 2021-11-22 |
|
4 | USER |
UserTesting, Inc.
Common Stock |
C - Conversion | 1,304,945 | 1,304,945 | |||||
| 2021-11-22 |
|
4 | USER |
UserTesting, Inc.
Common Stock |
C - Conversion | 10,220,232 | 10,220,232 | |||||
| 2021-11-02 |
|
4 | UDMY |
Udemy, Inc.
Series D Convertible Preferred Stock |
C - Conversion | -60,961 | 0 | -100.00 | ||||
| 2021-11-02 |
|
4 | UDMY |
Udemy, Inc.
Series D Convertible Preferred Stock |
C - Conversion | -166,594 | 0 | -100.00 | ||||
| 2021-11-02 |
|
4 | UDMY |
Udemy, Inc.
Series D Convertible Preferred Stock |
C - Conversion | -1,159,445 | 0 | -100.00 | ||||
| 2021-11-02 |
|
4 | UDMY |
Udemy, Inc.
Series C Convertible Preferred Stock |
C - Conversion | -70,454 | 0 | -100.00 | ||||
| 2021-11-02 |
|
4 | UDMY |
Udemy, Inc.
Series C Convertible Preferred Stock |
C - Conversion | -192,536 | 0 | -100.00 | ||||
| 2021-11-02 |
|
4 | UDMY |
Udemy, Inc.
Series C Convertible Preferred Stock |
C - Conversion | -1,339,998 | 0 | -100.00 | ||||
| 2021-11-02 |
|
4 | UDMY |
Udemy, Inc.
Series B Convertible Preferred Stock |
C - Conversion | -310,985 | 0 | -100.00 | ||||
| 2021-11-02 |
|
4 | UDMY |
Udemy, Inc.
Series B Convertible Preferred Stock |
C - Conversion | -849,866 | 0 | -100.00 | ||||
| 2021-11-02 |
|
4 | UDMY |
Udemy, Inc.
Series B Convertible Preferred Stock |
C - Conversion | -5,914,814 | 0 | -100.00 | ||||
| 2021-11-02 |
|
4 | UDMY |
Udemy, Inc.
Series A-1 Convertible Preferred Stock |
C - Conversion | -23,093 | 0 | -100.00 | ||||
| 2021-11-02 |
|
4 | UDMY |
Udemy, Inc.
Series A-1 Convertible Preferred Stock |
C - Conversion | -63,110 | 0 | -100.00 | ||||
| 2021-11-02 |
|
4 | UDMY |
Udemy, Inc.
Series A-1 Convertible Preferred Stock |
C - Conversion | -439,224 | 0 | -100.00 | ||||
| 2021-11-02 |
|
4 | UDMY |
Udemy, Inc.
Common Stock |
C - Conversion | 60,961 | 619,269 | 10.92 | ||||
| 2021-11-02 |
|
4 | UDMY |
Udemy, Inc.
Common Stock |
C - Conversion | 166,594 | 1,692,351 | 10.92 | ||||
| 2021-11-02 |
|
4 | UDMY |
Udemy, Inc.
Common Stock |
C - Conversion | 1,159,445 | 11,778,259 | 10.92 | ||||
| 2021-11-02 |
|
4 | UDMY |
Udemy, Inc.
Common Stock |
C - Conversion | 70,454 | 558,308 | 14.44 | ||||
| 2021-11-02 |
|
4 | UDMY |
Udemy, Inc.
Common Stock |
C - Conversion | 192,536 | 1,525,757 | 14.44 | ||||
| 2021-11-02 |
|
4 | UDMY |
Udemy, Inc.
Common Stock |
C - Conversion | 1,339,998 | 10,618,814 | 14.44 | ||||
| 2021-11-02 |
|
4 | UDMY |
Udemy, Inc.
Common Stock |
C - Conversion | 310,985 | 487,854 | 175.83 | ||||
| 2021-11-02 |
|
4 | UDMY |
Udemy, Inc.
Common Stock |
C - Conversion | 849,866 | 1,333,221 | 175.83 | ||||
| 2021-11-02 |
|
4 | UDMY |
Udemy, Inc.
Common Stock |
C - Conversion | 5,914,814 | 9,278,816 | 175.83 | ||||
| 2021-11-02 |
|
4 | UDMY |
Udemy, Inc.
Common Stock |
C - Conversion | 23,093 | 176,869 | 15.02 | ||||
| 2021-11-02 |
|
4 | UDMY |
Udemy, Inc.
Common Stock |
C - Conversion | 63,110 | 483,355 | 15.02 | ||||
| 2021-11-02 |
|
4 | UDMY |
Udemy, Inc.
Common Stock |
C - Conversion | 439,224 | 3,364,002 | 15.02 | ||||
| 2021-11-02 |
|
4 | UDMY |
Udemy, Inc.
Series D Convertible Preferred Stock |
C - Conversion | -2,633,779 | 0 | -100.00 | ||||
| 2021-11-02 |
|
4 | UDMY |
Udemy, Inc.
Series C Convertible Preferred Stock |
C - Conversion | -3,043,923 | 0 | -100.00 | ||||
| 2021-11-02 |
|
4 | UDMY |
Udemy, Inc.
Series B Convertible Preferred Stock |
C - Conversion | -13,436,008 | 0 | -100.00 | ||||
| 2021-11-02 |
|
4 | UDMY |
Udemy, Inc.
Series A-1 Convertible Preferred Stock |
C - Conversion | -997,735 | 0 | -100.00 | ||||
| 2021-11-02 |
|
4 | UDMY |
Udemy, Inc.
Common Stock |
C - Conversion | 2,633,779 | 26,755,331 | 10.92 | ||||
| 2021-11-02 |
|
4 | UDMY |
Udemy, Inc.
Common Stock |
C - Conversion | 3,043,923 | 24,121,552 | 14.44 | ||||
| 2021-11-02 |
|
4 | UDMY |
Udemy, Inc.
Common Stock |
C - Conversion | 13,436,008 | 21,077,629 | 175.83 | ||||
| 2021-11-02 |
|
4 | UDMY |
Udemy, Inc.
Common Stock |
C - Conversion | 997,735 | 7,641,621 | 15.02 | ||||
| 2021-10-28 | 3 | UDMY |
Udemy, Inc.
Common Stock |
2,924,778 | ||||||||
| 2021-10-28 | 3 | UDMY |
Udemy, Inc.
Common Stock |
420,245 | ||||||||
| 2021-10-28 | 3 | UDMY |
Udemy, Inc.
Common Stock |
153,776 | ||||||||
| 2021-10-28 | 3 | UDMY |
Udemy, Inc.
Common Stock |
6,643,886 | ||||||||
| 2021-10-28 | 3 | UDMY |
Udemy, Inc.
Common Stock |
1,088,764 | ||||||||
| 2021-10-28 | 3 | UDMY |
Udemy, Inc.
Common Stock |
98,286 | ||||||||
| 2021-09-23 |
|
4 | S |
SentinelOne, Inc.
Class B Common Stock |
C - Conversion | -15,868 | 142,817 | -10.00 | ||||
| 2021-09-23 |
|
4 | S |
SentinelOne, Inc.
Class B Common Stock |
C - Conversion | -2,802 | 25,226 | -10.00 | ||||
| 2021-09-23 |
|
4 | S |
SentinelOne, Inc.
Class B Common Stock |
C - Conversion | -2,033 | 18,302 | -10.00 | ||||
| 2021-09-23 |
|
4 | S |
SentinelOne, Inc.
Class B Common Stock |
C - Conversion | -17,082 | 153,745 | -10.00 | ||||
| 2021-09-23 |
|
4 | S |
SentinelOne, Inc.
Class B Common Stock |
C - Conversion | -133,791 | 1,204,121 | -10.00 | ||||
| 2021-09-23 |
|
4 | S |
SentinelOne, Inc.
Class B Common Stock |
C - Conversion | -122,122 | 1,099,100 | -10.00 | ||||
| 2021-09-23 |
|
4 | S |
SentinelOne, Inc.
Class A Common Stock |
C - Conversion | 15,868 | 15,868 | |||||
| 2021-09-23 |
|
4 | S |
SentinelOne, Inc.
Class A Common Stock |
C - Conversion | 2,802 | 2,802 | |||||
| 2021-09-23 |
|
4 | S |
SentinelOne, Inc.
Class A Common Stock |
C - Conversion | 2,033 | 2,033 | |||||
| 2021-09-23 |
|
4 | S |
SentinelOne, Inc.
Class A Common Stock |
C - Conversion | 17,082 | 17,082 | |||||
| 2021-09-23 |
|
4 | S |
SentinelOne, Inc.
Class A Common Stock |
C - Conversion | 133,791 | 133,791 | |||||
| 2021-09-23 |
|
4 | S |
SentinelOne, Inc.
Class A Common Stock |
C - Conversion | 122,122 | 122,122 | |||||
| 2021-09-23 |
|
4 | S |
SentinelOne, Inc.
Class B Common Stock |
C - Conversion | -37,437 | 336,935 | -10.00 | ||||
| 2021-09-23 |
|
4 | S |
SentinelOne, Inc.
Class B Common Stock |
C - Conversion | -249,581 | 2,246,234 | -10.00 | ||||
| 2021-09-23 |
|
4 | S |
SentinelOne, Inc.
Class B Common Stock |
C - Conversion | -1,290,225 | 11,612,028 | -10.00 | ||||
| 2021-09-23 |
|
4 | S |
SentinelOne, Inc.
Class B Common Stock |
C - Conversion | -1,573,422 | 14,160,803 | -10.00 | ||||
| 2021-09-23 |
|
4 | S |
SentinelOne, Inc.
Class A Common Stock |
C - Conversion | 37,437 | 37,437 | |||||
| 2021-09-23 |
|
4 | S |
SentinelOne, Inc.
Class A Common Stock |
C - Conversion | 249,581 | 249,581 | |||||
| 2021-09-23 |
|
4 | S |
SentinelOne, Inc.
Class A Common Stock |
C - Conversion | 1,290,225 | 1,290,225 | |||||
| 2021-09-23 |
|
4 | S |
SentinelOne, Inc.
Class A Common Stock |
C - Conversion | 1,573,422 | 1,573,422 | |||||
| 2021-07-08 |
|
4 | ETWO |
E2open Parent Holdings, Inc.
Common Units |
J - Other | 72,618 | 29,628,506 | 0.25 | ||||
| 2021-07-08 |
|
4 | ETWO |
E2open Parent Holdings, Inc.
Class A Common Stock |
J - Other | 11,766 | 4,800,596 | 0.25 | ||||
| 2021-07-08 |
|
4 | ETWO |
E2open Parent Holdings, Inc.
Class A Common Stock |
J - Other | 12,796 | 5,220,857 | 0.25 | ||||
| 2021-07-08 |
|
4 | ETWO |
E2open Parent Holdings, Inc.
Class A Common Stock |
J - Other | 4,385 | 1,789,373 | 0.25 | ||||
| 2021-07-08 |
|
4 | ETWO |
E2open Parent Holdings, Inc.
Class A Common Stock |
J - Other | 20,567 | 8,391,675 | 0.25 | ||||
| 2021-07-06 | 3 | S |
SentinelOne, Inc.
Class A Common Stock |
84,734 | ||||||||
| 2021-07-06 | 3 | S |
SentinelOne, Inc.
Class A Common Stock |
106,492 | ||||||||
| 2021-07-06 | 3 | S |
SentinelOne, Inc.
Class A Common Stock |
4,140 | ||||||||
| 2021-07-06 | 3 | S |
SentinelOne, Inc.
Class A Common Stock |
7,190 | ||||||||
| 2021-07-06 |
|
4 | S |
SentinelOne, Inc.
Class A Common Stock |
P - Purchase | 7,190 | 7,190 | 35.00 | 251,650 | 251,650 | ||
| 2021-07-06 |
|
4 | S |
SentinelOne, Inc.
Class A Common Stock |
P - Purchase | 4,140 | 4,140 | 35.00 | 144,900 | 144,900 | ||
| 2021-07-06 |
|
4 | S |
SentinelOne, Inc.
Class A Common Stock |
P - Purchase | 106,492 | 106,492 | 35.00 | 3,727,220 | 3,727,220 | ||
| 2021-07-06 |
|
4 | S |
SentinelOne, Inc.
Class A Common Stock |
P - Purchase | 84,734 | 84,734 | 35.00 | 2,965,690 | 2,965,690 | ||
| 2021-07-06 |
|
4 | S |
SentinelOne, Inc.
Class B Common Stock |
C - Conversion | 339,410 | 374,372 | 970.80 | ||||
| 2021-07-06 |
|
4 | S |
SentinelOne, Inc.
Class B Common Stock |
C - Conversion | 2,262,736 | 2,495,815 | 970.80 | ||||
| 2021-07-06 |
|
4 | S |
SentinelOne, Inc.
Class B Common Stock |
C - Conversion | 11,697,335 | 12,902,253 | 970.80 | ||||
| 2021-07-06 |
|
4 | S |
SentinelOne, Inc.
Class B Common Stock |
C - Conversion | 14,264,836 | 15,734,225 | 970.80 | ||||
| 2021-07-06 |
|
4 | S |
SentinelOne, Inc.
Series F Preferred Stock |
C - Conversion | -17,161 | 0 | -100.00 | ||||
| 2021-07-06 |
|
4 | S |
SentinelOne, Inc.
Series F Preferred Stock |
C - Conversion | -114,410 | 0 | -100.00 | ||||
| 2021-07-06 |
|
4 | S |
SentinelOne, Inc.
Series F Preferred Stock |
C - Conversion | -591,448 | 0 | -100.00 | ||||
| 2021-07-06 |
|
4 | S |
SentinelOne, Inc.
Series F Preferred Stock |
C - Conversion | -721,267 | 0 | -100.00 | ||||
| 2021-07-06 |
|
4 | S |
SentinelOne, Inc.
Series E Preferred Stock |
C - Conversion | -146,644 | 0 | -100.00 | ||||
| 2021-07-06 |
|
4 | S |
SentinelOne, Inc.
Series E Preferred Stock |
C - Conversion | -977,627 | 0 | -100.00 | ||||
| 2021-07-06 |
|
4 | S |
SentinelOne, Inc.
Series E Preferred Stock |
C - Conversion | -5,053,895 | 0 | -100.00 | ||||
| 2021-07-06 |
|
4 | S |
SentinelOne, Inc.
Series E Preferred Stock |
C - Conversion | -6,163,196 | 0 | -100.00 | ||||
| 2021-07-06 |
|
4 | S |
SentinelOne, Inc.
Series D Preferred Stock |
C - Conversion | -162,855 | 0 | -100.00 | ||||
| 2021-07-06 |
|
4 | S |
SentinelOne, Inc.
Series D Preferred Stock |
C - Conversion | -1,085,694 | 0 | -100.00 | ||||
| 2021-07-06 |
|
4 | S |
SentinelOne, Inc.
Series D Preferred Stock |
C - Conversion | -5,612,553 | 0 | -100.00 | ||||
| 2021-07-06 |
|
4 | S |
SentinelOne, Inc.
Series D Preferred Stock |
C - Conversion | -6,844,479 | 0 | -100.00 | ||||
| 2021-06-11 |
|
4 | ETWO |
E2open Parent Holdings, Inc.
Series B-1 Common Stock |
C - Conversion | -484,365 | 0 | -100.00 | ||||
| 2021-06-11 |
|
4 | ETWO |
E2open Parent Holdings, Inc.
Series B-1 Common Stock |
C - Conversion | -526,768 | 0 | -100.00 | ||||
| 2021-06-11 |
|
4 | ETWO |
E2open Parent Holdings, Inc.
Series B-1 Common Stock |
C - Conversion | -180,542 | 0 | -100.00 | ||||
| 2021-06-11 |
|
4 | ETWO |
E2open Parent Holdings, Inc.
Series B-1 Common Stock |
C - Conversion | -846,693 | 0 | -100.00 | ||||
| 2021-06-11 |
|
4 | ETWO |
E2open Parent Holdings, Inc.
Series 1 Restricted Common Units |
C - Conversion | -2,989,422 | 0 | -100.00 | ||||
| 2021-06-11 |
|
4 | ETWO |
E2open Parent Holdings, Inc.
Common Units |
C - Conversion | 2,989,422 | 29,555,888 | 11.25 | ||||
| 2021-06-11 |
|
4 | ETWO |
E2open Parent Holdings, Inc.
Class A Common Stock |
C - Conversion | 484,365 | 4,788,830 | 11.25 | ||||
| 2021-06-11 |
|
4 | ETWO |
E2open Parent Holdings, Inc.
Class A Common Stock |
C - Conversion | 526,768 | 5,208,061 | 11.25 | ||||
| 2021-06-11 |
|
4 | ETWO |
E2open Parent Holdings, Inc.
Class A Common Stock |
C - Conversion | 180,542 | 1,784,988 | 11.25 | ||||
| 2021-06-11 |
|
4 | ETWO |
E2open Parent Holdings, Inc.
Class A Common Stock |
C - Conversion | 846,693 | 8,371,108 | 11.25 | ||||
| 2021-06-09 | 3 | DIBS |
1stdibs.com, Inc.
Common Stock |
3,120,840 | ||||||||
| 2021-06-09 | 3 | DIBS |
1stdibs.com, Inc.
Common Stock |
1,550,668 | ||||||||
| 2021-06-09 | 3 | DIBS |
1stdibs.com, Inc.
Common Stock |
330,652 | ||||||||
| 2021-06-09 | 3 | DIBS |
1stdibs.com, Inc.
Common Stock |
62,294 | ||||||||
| 2021-02-19 |
|
4 | TENB |
Tenable Holdings, Inc.
Common Stock |
J - Other | -18,450 | 62,114 | -22.90 | ||||
| 2021-02-19 |
|
4 | TENB |
Tenable Holdings, Inc.
Common Stock |
J - Other | -97,928 | 329,702 | -22.90 | ||||
| 2021-02-19 |
|
4 | TENB |
Tenable Holdings, Inc.
Common Stock |
J - Other | -459,257 | 1,546,213 | -22.90 | ||||
| 2021-02-19 |
|
4 | TENB |
Tenable Holdings, Inc.
Common Stock |
J - Other | -924,289 | 3,111,873 | -22.90 | ||||
| 2021-02-19 |
|
4 | TENB |
Tenable Holdings, Inc.
Common Stock |
J - Other | -395,251 | 1,330,719 | -22.90 | ||||
| 2021-02-19 |
|
4 | TENB |
Tenable Holdings, Inc.
Common Stock |
J - Other | -321,141 | 1,081,210 | -22.90 | ||||
| 2021-02-19 |
|
4 | TENB |
Tenable Holdings, Inc.
Common Stock |
J - Other | -349,255 | 1,175,861 | -22.90 | ||||
| 2021-02-19 |
|
4 | TENB |
Tenable Holdings, Inc.
Common Stock |
J - Other | -434,429 | 1,462,620 | -22.90 | ||||
| 2021-02-12 | 3 | ETWO |
E2open Parent Holdings, Inc.
Class A common stock |
7,524,415 | ||||||||
| 2021-02-12 | 3 | ETWO |
E2open Parent Holdings, Inc.
Class A common stock |
1,604,446 | ||||||||
| 2021-02-12 | 3 | ETWO |
E2open Parent Holdings, Inc.
Class A common stock |
4,681,293 | ||||||||
| 2021-02-12 | 3 | ETWO |
E2open Parent Holdings, Inc.
Class A common stock |
4,304,465 | ||||||||
| 2021-02-08 |
|
4 | TENB |
Tenable Holdings, Inc.
Common Stock |
S - Sale | -48 | 80,564 | -0.06 | 38.80 | -1,862 | 3,125,730 | |
| 2021-02-08 |
|
4 | TENB |
Tenable Holdings, Inc.
Common Stock |
S - Sale | -254 | 427,630 | -0.06 | 38.80 | -9,855 | 16,591,232 | |
| 2021-02-08 |
|
4 | TENB |
Tenable Holdings, Inc.
Common Stock |
S - Sale | -1,189 | 2,005,470 | -0.06 | 38.80 | -46,131 | 77,808,426 | |
| 2021-02-08 |
|
4 | TENB |
Tenable Holdings, Inc.
Common Stock |
S - Sale | -2,393 | 4,036,162 | -0.06 | 38.80 | -92,844 | 156,595,417 | |
| 2021-02-08 |
|
4 | TENB |
Tenable Holdings, Inc.
Common Stock |
S - Sale | -25,699 | 0 | -100.00 | 36.04 | -926,146 | ||
| 2021-02-08 |
|
4 | TENB |
Tenable Holdings, Inc.
Common Stock |
S - Sale | -1,024 | 1,725,970 | -0.06 | 38.80 | -39,729 | 66,964,357 | |
| 2021-02-08 |
|
4 | TENB |
Tenable Holdings, Inc.
Common Stock |
S - Sale | -832 | 1,402,351 | -0.06 | 38.80 | -32,280 | 54,408,554 | |
| 2021-02-08 |
|
4 | TENB |
Tenable Holdings, Inc.
Common Stock |
S - Sale | -904 | 1,525,116 | -0.06 | 38.80 | -35,073 | 59,171,603 | |
| 2021-02-08 |
|
4 | TENB |
Tenable Holdings, Inc.
Common Stock |
S - Sale | -1,125 | 1,897,049 | -0.06 | 38.80 | -43,648 | 73,601,897 | |
| 2021-02-08 |
|
4 | TENB |
Tenable Holdings, Inc.
Common Stock |
S - Sale | -7,614 | 0 | -100.00 | 36.04 | -274,395 | ||
| 2021-02-08 |
|
4 | TENB |
Tenable Holdings, Inc.
Common Stock |
J - Other | 7,614 | 7,614 | |||||
| 2021-02-08 |
|
4 | TENB |
Tenable Holdings, Inc.
Common Stock |
J - Other | -7,614 | 1,726,994 | -0.44 | ||||
| 2021-02-08 |
|
4/A | TENB |
Tenable Holdings, Inc.
Common Stock |
J - Other | -255,887 | 3,481,193 | -6.85 | ||||
| 2021-01-15 |
|
4 | NCNO |
NCINO, INC.
Common Stock |
J - Other | 9,547 | 9,547 | |||||
| 2021-01-15 |
|
4 | NCNO |
NCINO, INC.
Common Stock |
J - Other | -13,193 | 205,816 | -6.02 | ||||
| 2021-01-15 |
|
4 | NCNO |
NCINO, INC.
Common Stock |
J - Other | -70,025 | 1,092,443 | -6.02 | ||||
| 2021-01-15 |
|
4 | NCNO |
NCINO, INC.
Common Stock |
J - Other | -328,400 | 5,123,257 | -6.02 | ||||
| 2021-01-15 |
|
4 | NCNO |
NCINO, INC.
Common Stock |
J - Other | -660,929 | 10,310,944 | -6.02 | ||||
| 2021-01-15 |
|
4 | NCNO |
NCINO, INC.
Common Stock |
J - Other | -244,372 | 3,812,367 | -6.02 | ||||
| 2021-01-15 |
|
4 | NCNO |
NCINO, INC.
Common Stock |
J - Other | -198,552 | 3,097,549 | -6.02 | ||||
| 2021-01-15 |
|
4 | NCNO |
NCINO, INC.
Common Stock |
J - Other | -215,934 | 3,368,720 | -6.02 | ||||
| 2021-01-15 |
|
4 | NCNO |
NCINO, INC.
Common Stock |
J - Other | -268,595 | 4,190,253 | -6.02 | ||||
| 2020-10-13 |
|
4 | NCNO |
NCINO, INC.
Common Stock |
S - Sale | -588,302 | 4,056,739 | -12.67 | 72.00 | -42,357,744 | 292,085,208 | |
| 2020-10-13 |
|
4 | NCNO |
NCINO, INC.
Common Stock |
S - Sale | -477,995 | 3,296,101 | -12.67 | 72.00 | -34,415,640 | 237,319,272 | |
| 2020-10-13 |
|
4 | NCNO |
NCINO, INC.
Common Stock |
S - Sale | -519,840 | 3,584,654 | -12.67 | 72.00 | -37,428,480 | 258,095,088 | |
| 2020-10-13 |
|
4 | NCNO |
NCINO, INC.
Common Stock |
S - Sale | -646,614 | 4,458,848 | -12.67 | 72.00 | -46,556,208 | 321,037,056 | |
| 2020-10-13 |
|
4 | NCNO |
NCINO, INC.
Common Stock |
S - Sale | -31,761 | 219,009 | -12.67 | 72.00 | -2,286,792 | 15,768,648 | |
| 2020-10-13 |
|
4 | NCNO |
NCINO, INC.
Common Stock |
S - Sale | -168,580 | 1,162,468 | -12.67 | 72.00 | -12,137,760 | 83,697,696 | |
| 2020-10-13 |
|
4 | NCNO |
NCINO, INC.
Common Stock |
S - Sale | -790,589 | 5,451,657 | -12.67 | 72.00 | -56,922,408 | 392,519,304 | |
| 2020-10-13 |
|
4 | NCNO |
NCINO, INC.
Common Stock |
S - Sale | -1,591,121 | 10,971,873 | -12.67 | 72.00 | -114,560,712 | 789,974,856 | |
| 2020-08-04 |
|
4 | TENB |
Tenable Holdings, Inc.
Common Stock |
S - Sale | -1,212,102 | 1,726,994 | -41.24 | 31.95 | -38,726,659 | 55,177,458 | |
| 2020-08-04 |
|
4 | TENB |
Tenable Holdings, Inc.
Common Stock |
S - Sale | -984,833 | 1,403,183 | -41.24 | 31.95 | -31,465,414 | 44,831,697 | |
| 2020-08-04 |
|
4 | TENB |
Tenable Holdings, Inc.
Common Stock |
S - Sale | -1,071,049 | 1,526,020 | -41.24 | 31.95 | -34,220,016 | 48,756,339 | |
| 2020-08-04 |
|
4 | TENB |
Tenable Holdings, Inc.
Common Stock |
S - Sale | -1,332,248 | 1,898,174 | -41.24 | 31.95 | -42,565,324 | 60,646,659 | |
| 2020-08-04 |
|
4 | TENB |
Tenable Holdings, Inc.
Common Stock |
S - Sale | -56,579 | 80,612 | -41.24 | 31.95 | -1,807,699 | 2,575,553 | |
| 2020-08-04 |
|
4 | TENB |
Tenable Holdings, Inc.
Common Stock |
S - Sale | -300,313 | 427,884 | -41.24 | 31.95 | -9,595,000 | 13,670,894 | |
| 2020-08-04 |
|
4 | TENB |
Tenable Holdings, Inc.
Common Stock |
S - Sale | -1,408,388 | 2,006,659 | -41.24 | 31.95 | -44,997,997 | 64,112,755 | |
| 2020-08-04 |
|
4 | TENB |
Tenable Holdings, Inc.
Common Stock |
S - Sale | -2,834,488 | 4,038,555 | -41.24 | 31.95 | -90,561,892 | 129,031,832 | |
| 2020-07-22 |
|
4 | TENB |
Tenable Holdings, Inc.
Common Stock |
S - Sale | -167,500 | 2,939,096 | -5.39 | 31.35 | -5,251,360 | 92,144,774 | |
| 2020-07-22 |
|
4 | TENB |
Tenable Holdings, Inc.
Common Stock |
S - Sale | -136,094 | 2,388,016 | -5.39 | 31.35 | -4,266,737 | 74,867,645 | |
| 2020-07-22 |
|
4 | TENB |
Tenable Holdings, Inc.
Common Stock |
S - Sale | -148,007 | 2,597,069 | -5.39 | 31.35 | -4,640,227 | 81,421,749 | |
| 2020-07-22 |
|
4 | TENB |
Tenable Holdings, Inc.
Common Stock |
S - Sale | -184,104 | 3,230,422 | -5.39 | 31.35 | -5,771,918 | 101,278,252 | |
| 2020-07-22 |
|
4 | TENB |
Tenable Holdings, Inc.
Common Stock |
S - Sale | -39,525 | 3,106,596 | -1.26 | 31.57 | -1,247,753 | 98,071,197 | |
| 2020-07-22 |
|
4 | TENB |
Tenable Holdings, Inc.
Common Stock |
S - Sale | -32,114 | 2,524,110 | -1.26 | 31.57 | -1,013,797 | 79,682,871 | |
| 2020-07-22 |
|
4 | TENB |
Tenable Holdings, Inc.
Common Stock |
S - Sale | -34,926 | 2,745,076 | -1.26 | 31.57 | -1,102,568 | 86,658,481 | |
| 2020-07-22 |
|
4 | TENB |
Tenable Holdings, Inc.
Common Stock |
S - Sale | -43,443 | 3,414,526 | -1.26 | 31.57 | -1,371,439 | 107,792,147 | |
| 2020-07-22 |
|
4 | TENB |
Tenable Holdings, Inc.
Common Stock |
S - Sale | -16,469 | 3,146,121 | -0.52 | 31.25 | -514,727 | 98,329,810 | |
| 2020-07-22 |
|
4 | TENB |
Tenable Holdings, Inc.
Common Stock |
S - Sale | -13,381 | 2,556,224 | -0.52 | 31.25 | -418,214 | 79,892,992 | |
| 2020-07-22 |
|
4 | TENB |
Tenable Holdings, Inc.
Common Stock |
S - Sale | -14,552 | 2,780,002 | -0.52 | 31.25 | -454,813 | 86,887,017 | |
| 2020-07-22 |
|
4 | TENB |
Tenable Holdings, Inc.
Common Stock |
S - Sale | -18,101 | 3,457,969 | -0.52 | 31.25 | -565,734 | 108,076,401 | |
| 2020-07-22 |
|
4 | TENB |
Tenable Holdings, Inc.
Common Stock |
S - Sale | -7,819 | 137,191 | -5.39 | 31.35 | -245,137 | 4,301,130 | |
| 2020-07-22 |
|
4 | TENB |
Tenable Holdings, Inc.
Common Stock |
S - Sale | -41,500 | 728,197 | -5.39 | 31.35 | -1,301,083 | 22,829,995 | |
| 2020-07-22 |
|
4 | TENB |
Tenable Holdings, Inc.
Common Stock |
S - Sale | -194,623 | 3,415,047 | -5.39 | 31.35 | -6,101,704 | 107,066,505 | |
| 2020-07-22 |
|
4 | TENB |
Tenable Holdings, Inc.
Common Stock |
S - Sale | -391,698 | 6,873,043 | -5.39 | 31.35 | -12,280,281 | 215,479,520 | |
| 2020-07-22 |
|
4 | TENB |
Tenable Holdings, Inc.
Common Stock |
S - Sale | -1,845 | 145,010 | -1.26 | 31.57 | -58,244 | 4,577,777 | |
| 2020-07-22 |
|
4 | TENB |
Tenable Holdings, Inc.
Common Stock |
S - Sale | -9,793 | 769,697 | -1.26 | 31.57 | -309,152 | 24,298,334 | |
| 2020-07-22 |
|
4 | TENB |
Tenable Holdings, Inc.
Common Stock |
S - Sale | -45,926 | 3,609,670 | -1.26 | 31.57 | -1,449,824 | 113,952,589 | |
| 2020-07-22 |
|
4 | TENB |
Tenable Holdings, Inc.
Common Stock |
S - Sale | -92,428 | 7,264,741 | -1.26 | 31.57 | -2,917,832 | 229,338,429 | |
| 2020-07-22 |
|
4 | TENB |
Tenable Holdings, Inc.
Common Stock |
S - Sale | -769 | 146,855 | -0.52 | 31.25 | -24,035 | 4,589,850 | |
| 2020-07-22 |
|
4 | TENB |
Tenable Holdings, Inc.
Common Stock |
S - Sale | -4,080 | 779,490 | -0.52 | 31.25 | -127,518 | 24,362,414 | |
| 2020-07-22 |
|
4 | TENB |
Tenable Holdings, Inc.
Common Stock |
S - Sale | -19,136 | 3,655,596 | -0.52 | 31.25 | -598,082 | 114,253,094 | |
| 2020-07-22 |
|
4 | TENB |
Tenable Holdings, Inc.
Common Stock |
S - Sale | -38,512 | 7,357,169 | -0.52 | 31.25 | -1,203,666 | 229,943,167 | |
| 2020-07-13 | 3 | NCNO |
NCINO, INC.
Common Stock |
22,734,555 | ||||||||
| 2020-07-13 | 3 | NCNO |
NCINO, INC.
Common Stock |
22,274,134 | ||||||||
| 2020-07-13 | 3 | NCNO |
NCINO, INC.
Common Stock |
21,733,587 | ||||||||
| 2020-07-13 | 3 | NCNO |
NCINO, INC.
Common Stock |
21,403,189 | ||||||||
| 2020-07-13 | 3 | NCNO |
NCINO, INC.
Common Stock |
22,734,555 | ||||||||
| 2020-07-13 | 3 | NCNO |
NCINO, INC.
Common Stock |
22,274,134 | ||||||||
| 2020-07-13 | 3 | NCNO |
NCINO, INC.
Common Stock |
21,733,587 | ||||||||
| 2020-07-13 | 3 | NCNO |
NCINO, INC.
Common Stock |
21,403,189 | ||||||||
| 2020-07-13 | 3 | NCNO |
NCINO, INC.
Common Stock |
22,734,555 | ||||||||
| 2020-07-13 | 3 | NCNO |
NCINO, INC.
Common Stock |
22,274,134 | ||||||||
| 2020-07-13 | 3 | NCNO |
NCINO, INC.
Common Stock |
21,733,587 | ||||||||
| 2020-07-13 | 3 | NCNO |
NCINO, INC.
Common Stock |
21,403,189 | ||||||||
| 2020-07-13 | 3 | NCNO |
NCINO, INC.
Common Stock |
22,734,555 | ||||||||
| 2020-07-13 | 3 | NCNO |
NCINO, INC.
Common Stock |
22,274,134 | ||||||||
| 2020-07-13 | 3 | NCNO |
NCINO, INC.
Common Stock |
21,733,587 | ||||||||
| 2020-07-13 | 3 | NCNO |
NCINO, INC.
Common Stock |
21,403,189 | ||||||||
| 2020-07-13 | 3 | NCNO |
NCINO, INC.
Common Stock |
22,734,555 | ||||||||
| 2020-07-13 | 3 | NCNO |
NCINO, INC.
Common Stock |
22,274,134 | ||||||||
| 2020-07-13 | 3 | NCNO |
NCINO, INC.
Common Stock |
21,733,587 | ||||||||
| 2020-07-13 | 3 | NCNO |
NCINO, INC.
Common Stock |
21,403,189 | ||||||||
| 2020-07-13 | 3 | NCNO |
NCINO, INC.
Common Stock |
22,734,555 | ||||||||
| 2020-07-13 | 3 | NCNO |
NCINO, INC.
Common Stock |
22,274,134 | ||||||||
| 2020-07-13 | 3 | NCNO |
NCINO, INC.
Common Stock |
21,733,587 | ||||||||
| 2020-07-13 | 3 | NCNO |
NCINO, INC.
Common Stock |
21,403,189 | ||||||||
| 2020-07-13 | 3 | NCNO |
NCINO, INC.
Common Stock |
22,734,555 | ||||||||
| 2020-07-13 | 3 | NCNO |
NCINO, INC.
Common Stock |
22,274,134 | ||||||||
| 2020-07-13 | 3 | NCNO |
NCINO, INC.
Common Stock |
21,733,587 | ||||||||
| 2020-07-13 | 3 | NCNO |
NCINO, INC.
Common Stock |
21,403,189 | ||||||||
| 2020-07-13 | 3 | NCNO |
NCINO, INC.
Common Stock |
22,734,555 | ||||||||
| 2020-07-13 | 3 | NCNO |
NCINO, INC.
Common Stock |
22,274,134 | ||||||||
| 2020-07-13 | 3 | NCNO |
NCINO, INC.
Common Stock |
21,733,587 | ||||||||
| 2020-07-13 | 3 | NCNO |
NCINO, INC.
Common Stock |
21,403,189 | ||||||||
| 2020-07-13 | 3 | NCNO |
NCINO, INC.
Common Stock |
22,734,555 | ||||||||
| 2020-07-13 | 3 | NCNO |
NCINO, INC.
Common Stock |
22,274,134 | ||||||||
| 2020-07-13 | 3 | NCNO |
NCINO, INC.
Common Stock |
21,733,587 | ||||||||
| 2020-07-13 | 3 | NCNO |
NCINO, INC.
Common Stock |
21,403,189 | ||||||||
| 2020-07-13 | 3 | NCNO |
NCINO, INC.
Common Stock |
32,950,052 | ||||||||
| 2020-07-13 | 3 | NCNO |
NCINO, INC.
Common Stock |
26,629,304 | ||||||||
| 2020-07-13 | 3 | NCNO |
NCINO, INC.
Common Stock |
21,718,106 | ||||||||
| 2020-07-13 | 3 | NCNO |
NCINO, INC.
Common Stock |
20,637,828 | ||||||||
| 2020-07-13 | 3 | NCNO |
NCINO, INC.
Common Stock |
32,950,052 | ||||||||
| 2020-07-13 | 3 | NCNO |
NCINO, INC.
Common Stock |
26,629,304 | ||||||||
| 2020-07-13 | 3 | NCNO |
NCINO, INC.
Common Stock |
21,718,106 | ||||||||
| 2020-07-13 | 3 | NCNO |
NCINO, INC.
Common Stock |
20,637,828 | ||||||||
| 2020-07-13 | 3 | NCNO |
NCINO, INC.
Common Stock |
32,950,052 | ||||||||
| 2020-07-13 | 3 | NCNO |
NCINO, INC.
Common Stock |
26,629,304 | ||||||||
| 2020-07-13 | 3 | NCNO |
NCINO, INC.
Common Stock |
21,718,106 | ||||||||
| 2020-07-13 | 3 | NCNO |
NCINO, INC.
Common Stock |
20,637,828 | ||||||||
| 2020-07-13 | 3 | NCNO |
NCINO, INC.
Common Stock |
32,950,052 | ||||||||
| 2020-07-13 | 3 | NCNO |
NCINO, INC.
Common Stock |
26,629,304 | ||||||||
| 2020-07-13 | 3 | NCNO |
NCINO, INC.
Common Stock |
21,718,106 | ||||||||
| 2020-07-13 | 3 | NCNO |
NCINO, INC.
Common Stock |
20,637,828 | ||||||||
| 2020-07-13 | 3 | NCNO |
NCINO, INC.
Common Stock |
32,950,052 | ||||||||
| 2020-07-13 | 3 | NCNO |
NCINO, INC.
Common Stock |
26,629,304 | ||||||||
| 2020-07-13 | 3 | NCNO |
NCINO, INC.
Common Stock |
21,718,106 | ||||||||
| 2020-07-13 | 3 | NCNO |
NCINO, INC.
Common Stock |
20,637,828 | ||||||||
| 2020-07-13 | 3 | NCNO |
NCINO, INC.
Common Stock |
32,950,052 | ||||||||
| 2020-07-13 | 3 | NCNO |
NCINO, INC.
Common Stock |
26,629,304 | ||||||||
| 2020-07-13 | 3 | NCNO |
NCINO, INC.
Common Stock |
21,718,106 | ||||||||
| 2020-07-13 | 3 | NCNO |
NCINO, INC.
Common Stock |
20,637,828 | ||||||||
| 2020-07-13 | 3 | NCNO |
NCINO, INC.
Common Stock |
32,950,052 | ||||||||
| 2020-07-13 | 3 | NCNO |
NCINO, INC.
Common Stock |
26,629,304 | ||||||||
| 2020-07-13 | 3 | NCNO |
NCINO, INC.
Common Stock |
21,718,106 | ||||||||
| 2020-07-13 | 3 | NCNO |
NCINO, INC.
Common Stock |
20,637,828 | ||||||||
| 2020-07-13 | 3 | NCNO |
NCINO, INC.
Common Stock |
32,950,052 | ||||||||
| 2020-07-13 | 3 | NCNO |
NCINO, INC.
Common Stock |
26,629,304 | ||||||||
| 2020-07-13 | 3 | NCNO |
NCINO, INC.
Common Stock |
21,718,106 | ||||||||
| 2020-07-13 | 3 | NCNO |
NCINO, INC.
Common Stock |
20,637,828 | ||||||||
| 2020-07-13 | 3 | NCNO |
NCINO, INC.
Common Stock |
32,950,052 | ||||||||
| 2020-07-13 | 3 | NCNO |
NCINO, INC.
Common Stock |
26,629,304 | ||||||||
| 2020-07-13 | 3 | NCNO |
NCINO, INC.
Common Stock |
21,718,106 | ||||||||
| 2020-07-13 | 3 | NCNO |
NCINO, INC.
Common Stock |
20,637,828 | ||||||||
| 2020-07-13 |
|
4 | TENB |
Tenable Holdings, Inc.
Common Stock |
S - Sale | -482 | 3,162,590 | -0.02 | 31.08 | -14,980 | 98,291,083 | |
| 2020-07-13 |
|
4 | TENB |
Tenable Holdings, Inc.
Common Stock |
S - Sale | -391 | 2,569,605 | -0.02 | 31.08 | -12,152 | 79,861,525 | |
| 2020-07-13 |
|
4 | TENB |
Tenable Holdings, Inc.
Common Stock |
S - Sale | -426 | 2,794,554 | -0.02 | 31.08 | -13,240 | 86,852,782 | |
| 2020-07-13 |
|
4 | TENB |
Tenable Holdings, Inc.
Common Stock |
S - Sale | -529 | 3,476,070 | -0.02 | 31.08 | -16,441 | 108,033,822 | |
| 2020-07-13 |
|
4 | TENB |
Tenable Holdings, Inc.
Common Stock |
S - Sale | -5,929 | 3,163,072 | -0.19 | 31.30 | -185,595 | 99,013,327 | |
| 2020-07-13 |
|
4 | TENB |
Tenable Holdings, Inc.
Common Stock |
S - Sale | -4,817 | 2,569,996 | -0.19 | 31.30 | -150,786 | 80,448,328 | |
| 2020-07-13 |
|
4 | TENB |
Tenable Holdings, Inc.
Common Stock |
S - Sale | -5,239 | 2,794,980 | -0.19 | 31.30 | -163,996 | 87,490,979 | |
| 2020-07-13 |
|
4 | TENB |
Tenable Holdings, Inc.
Common Stock |
S - Sale | -6,516 | 3,476,599 | -0.19 | 31.30 | -203,970 | 108,827,631 | |
| 2020-07-13 |
|
4 | TENB |
Tenable Holdings, Inc.
Common Stock |
S - Sale | -33,596 | 3,169,001 | -1.05 | 31.24 | -1,049,546 | 99,000,225 | |
| 2020-07-13 |
|
4 | TENB |
Tenable Holdings, Inc.
Common Stock |
S - Sale | -27,297 | 2,574,813 | -1.05 | 31.24 | -852,764 | 80,437,673 | |
| 2020-07-13 |
|
4 | TENB |
Tenable Holdings, Inc.
Common Stock |
S - Sale | -29,687 | 2,800,219 | -1.05 | 31.24 | -927,428 | 87,479,402 | |
| 2020-07-13 |
|
4 | TENB |
Tenable Holdings, Inc.
Common Stock |
S - Sale | -36,926 | 3,483,115 | -1.05 | 31.24 | -1,153,576 | 108,813,209 | |
| 2020-07-13 |
|
4 | TENB |
Tenable Holdings, Inc.
Common Stock |
S - Sale | -22 | 147,624 | -0.01 | 31.08 | -684 | 4,588,051 | |
| 2020-07-13 |
|
4 | TENB |
Tenable Holdings, Inc.
Common Stock |
S - Sale | -119 | 783,570 | -0.02 | 31.08 | -3,698 | 24,352,807 | |
| 2020-07-13 |
|
4 | TENB |
Tenable Holdings, Inc.
Common Stock |
S - Sale | -560 | 3,674,732 | -0.02 | 31.08 | -17,404 | 114,208,098 | |
| 2020-07-13 |
|
4 | TENB |
Tenable Holdings, Inc.
Common Stock |
S - Sale | -1,126 | 7,395,681 | -0.02 | 31.08 | -34,995 | 229,852,589 | |
| 2020-07-13 |
|
4 | TENB |
Tenable Holdings, Inc.
Common Stock |
S - Sale | -277 | 147,646 | -0.19 | 31.30 | -8,671 | 4,621,748 | |
| 2020-07-13 |
|
4 | TENB |
Tenable Holdings, Inc.
Common Stock |
S - Sale | -1,469 | 783,689 | -0.19 | 31.30 | -45,984 | 24,531,738 | |
| 2020-07-13 |
|
4 | TENB |
Tenable Holdings, Inc.
Common Stock |
S - Sale | -6,889 | 3,675,292 | -0.19 | 31.30 | -215,646 | 115,047,298 | |
| 2020-07-13 |
|
4 | TENB |
Tenable Holdings, Inc.
Common Stock |
S - Sale | -13,864 | 7,396,807 | -0.19 | 31.30 | -433,983 | 231,541,510 | |
| 2020-07-13 |
|
4 | TENB |
Tenable Holdings, Inc.
Common Stock |
S - Sale | -1,568 | 147,923 | -1.05 | 31.24 | -48,985 | 4,621,144 | |
| 2020-07-13 |
|
4 | TENB |
Tenable Holdings, Inc.
Common Stock |
S - Sale | -8,324 | 785,158 | -1.05 | 31.24 | -260,043 | 24,528,493 | |
| 2020-07-13 |
|
4 | TENB |
Tenable Holdings, Inc.
Common Stock |
S - Sale | -39,037 | 3,682,181 | -1.05 | 31.24 | -1,219,524 | 115,032,071 | |
| 2020-07-13 |
|
4 | TENB |
Tenable Holdings, Inc.
Common Stock |
S - Sale | -78,565 | 7,410,671 | -1.05 | 31.24 | -2,454,386 | 231,510,844 | |
| 2020-06-16 |
|
4 | PS |
Pluralsight, Inc.
Class A common stock |
S - Sale | -1,966,599 | 1,035,274 | -65.51 | 18.92 | -37,198,220 | 19,582,208 | |
| 2020-06-16 |
|
4 | PS |
Pluralsight, Inc.
Class A common stock |
S - Sale | -1,549,091 | 0 | -100.00 | 18.92 | -29,301,056 | ||
| 2020-06-16 |
|
4 | PS |
Pluralsight, Inc.
Class A common stock |
S - Sale | -525,000 | 612,762 | -46.14 | 18.92 | -9,930,375 | 11,590,393 | |
| 2020-06-16 |
|
4 | PS |
Pluralsight, Inc.
Class A common stock |
S - Sale | -61,964 | 0 | -100.00 | 18.92 | -1,172,049 | ||
| 2020-06-16 |
|
4 | PS |
Pluralsight, Inc.
Class A common stock |
S - Sale | -2,679,709 | 0 | -100.00 | 18.92 | -50,686,696 | ||
| 2020-06-16 |
|
4 | PS |
Pluralsight, Inc.
Class A common stock |
S - Sale | -247,228 | 288,555 | -46.14 | 18.92 | -4,676,318 | 5,458,018 | |
| 2020-06-16 |
|
4 | PS |
Pluralsight, Inc.
Class A common stock |
S - Sale | -1,720,409 | 2,008,001 | -46.14 | 18.92 | -32,541,536 | 37,981,339 | |
| 2020-06-11 |
|
4 | PS |
Pluralsight, Inc.
Class B common stock |
C - Conversion | -3,001,873 | 6,268,100 | -32.38 | ||||
| 2020-06-11 |
|
4 | PS |
Pluralsight, Inc.
Class A common stock |
C - Conversion | 3,001,873 | 3,001,873 | |||||
| 2020-06-11 |
|
4 | PS |
Pluralsight, Inc.
Class B common stock |
C - Conversion | -3,001,873 | 6,268,100 | -32.38 | ||||
| 2020-06-09 |
|
4 | TENB |
Tenable Holdings, Inc.
Common Stock |
S - Sale | -138 | 149,491 | -0.09 | 30.07 | -4,149 | 4,494,731 | |
| 2020-06-09 |
|
4 | TENB |
Tenable Holdings, Inc.
Common Stock |
S - Sale | -732 | 793,482 | -0.09 | 30.07 | -22,009 | 23,857,544 | |
| 2020-06-09 |
|
4 | TENB |
Tenable Holdings, Inc.
Common Stock |
S - Sale | -3,432 | 3,721,218 | -0.09 | 30.07 | -103,190 | 111,885,489 | |
| 2020-06-09 |
|
4 | TENB |
Tenable Holdings, Inc.
Common Stock |
S - Sale | -6,906 | 7,489,236 | -0.09 | 30.07 | -207,642 | 225,178,110 | |
| 2020-06-09 |
|
4 | TENB |
Tenable Holdings, Inc.
Common Stock |
S - Sale | -1,161 | 149,629 | -0.77 | 30.14 | -34,994 | 4,510,043 | |
| 2020-06-09 |
|
4 | TENB |
Tenable Holdings, Inc.
Common Stock |
S - Sale | -6,162 | 794,214 | -0.77 | 30.14 | -185,732 | 23,938,801 | |
| 2020-06-09 |
|
4 | TENB |
Tenable Holdings, Inc.
Common Stock |
S - Sale | -28,898 | 3,724,650 | -0.77 | 30.14 | -871,029 | 112,266,538 | |
| 2020-06-09 |
|
4 | TENB |
Tenable Holdings, Inc.
Common Stock |
S - Sale | -58,160 | 7,496,142 | -0.77 | 30.14 | -1,753,030 | 225,944,964 | |
| 2020-06-09 |
|
4 | TENB |
Tenable Holdings, Inc.
Common Stock |
S - Sale | -313 | 150,790 | -0.21 | 30.02 | -9,398 | 4,527,364 | |
| 2020-06-09 |
|
4 | TENB |
Tenable Holdings, Inc.
Common Stock |
S - Sale | -1,660 | 800,376 | -0.21 | 30.02 | -49,840 | 24,030,729 | |
| 2020-06-09 |
|
4 | TENB |
Tenable Holdings, Inc.
Common Stock |
S - Sale | -7,787 | 3,753,548 | -0.21 | 30.02 | -233,799 | 112,697,651 | |
| 2020-06-09 |
|
4 | TENB |
Tenable Holdings, Inc.
Common Stock |
S - Sale | -15,671 | 7,554,302 | -0.21 | 30.02 | -470,511 | 226,812,630 | |
| 2020-06-09 |
|
4 | TENB |
Tenable Holdings, Inc.
Common Stock |
S - Sale | -2,953 | 3,202,597 | -0.09 | 30.07 | -88,788 | 96,292,164 | |
| 2020-06-09 |
|
4 | TENB |
Tenable Holdings, Inc.
Common Stock |
S - Sale | -2,400 | 2,602,110 | -0.09 | 30.07 | -72,161 | 78,237,381 | |
| 2020-06-09 |
|
4 | TENB |
Tenable Holdings, Inc.
Common Stock |
S - Sale | -2,610 | 2,829,906 | -0.09 | 30.07 | -78,475 | 85,086,501 | |
| 2020-06-09 |
|
4 | TENB |
Tenable Holdings, Inc.
Common Stock |
S - Sale | -3,246 | 3,520,041 | -0.09 | 30.07 | -97,597 | 105,836,721 | |
| 2020-06-09 |
|
4 | TENB |
Tenable Holdings, Inc.
Common Stock |
S - Sale | -24,870 | 3,205,550 | -0.77 | 30.14 | -749,619 | 96,620,085 | |
| 2020-06-09 |
|
4 | TENB |
Tenable Holdings, Inc.
Common Stock |
S - Sale | -20,207 | 2,604,510 | -0.77 | 30.14 | -609,069 | 78,503,838 | |
| 2020-06-09 |
|
4 | TENB |
Tenable Holdings, Inc.
Common Stock |
S - Sale | -21,976 | 2,832,516 | -0.77 | 30.14 | -662,390 | 85,376,281 | |
| 2020-06-09 |
|
4 | TENB |
Tenable Holdings, Inc.
Common Stock |
S - Sale | -27,336 | 3,523,287 | -0.77 | 30.14 | -823,948 | 106,197,155 | |
| 2020-06-09 |
|
4 | TENB |
Tenable Holdings, Inc.
Common Stock |
S - Sale | -6,701 | 3,230,420 | -0.21 | 30.02 | -201,193 | 96,991,099 | |
| 2020-06-09 |
|
4 | TENB |
Tenable Holdings, Inc.
Common Stock |
S - Sale | -5,445 | 2,624,717 | -0.21 | 30.02 | -163,482 | 78,805,291 | |
| 2020-06-09 |
|
4 | TENB |
Tenable Holdings, Inc.
Common Stock |
S - Sale | -5,922 | 2,854,492 | -0.21 | 30.02 | -177,804 | 85,704,124 | |
| 2020-06-09 |
|
4 | TENB |
Tenable Holdings, Inc.
Common Stock |
S - Sale | -7,366 | 3,550,623 | -0.21 | 30.02 | -221,159 | 106,604,970 | |
| 2020-06-04 |
|
4 | TENB |
Tenable Holdings, Inc.
Common Stock |
S - Sale | -8,690 | 3,237,121 | -0.27 | 30.07 | -261,297 | 97,336,020 | |
| 2020-06-04 |
|
4 | TENB |
Tenable Holdings, Inc.
Common Stock |
S - Sale | -7,061 | 2,630,162 | -0.27 | 30.07 | -212,315 | 79,085,552 | |
| 2020-06-04 |
|
4 | TENB |
Tenable Holdings, Inc.
Common Stock |
S - Sale | -7,679 | 2,860,414 | -0.27 | 30.07 | -230,898 | 86,008,930 | |
| 2020-06-04 |
|
4 | TENB |
Tenable Holdings, Inc.
Common Stock |
S - Sale | -9,551 | 3,557,989 | -0.27 | 30.07 | -287,186 | 106,984,104 | |
| 2020-06-04 |
|
4 | TENB |
Tenable Holdings, Inc.
Common Stock |
S - Sale | -23,607 | 3,245,811 | -0.72 | 30.37 | -716,933 | 98,573,657 | |
| 2020-06-04 |
|
4 | TENB |
Tenable Holdings, Inc.
Common Stock |
S - Sale | -19,180 | 2,637,223 | -0.72 | 30.37 | -582,487 | 80,091,144 | |
| 2020-06-04 |
|
4 | TENB |
Tenable Holdings, Inc.
Common Stock |
S - Sale | -20,860 | 2,868,093 | -0.72 | 30.37 | -633,508 | 87,102,550 | |
| 2020-06-04 |
|
4 | TENB |
Tenable Holdings, Inc.
Common Stock |
S - Sale | -25,947 | 3,567,540 | -0.72 | 30.37 | -787,997 | 108,344,406 | |
| 2020-06-04 |
|
4 | TENB |
Tenable Holdings, Inc.
Common Stock |
S - Sale | -40 | 3,269,418 | 0.00 | 30.95 | -1,238 | 101,188,487 | |
| 2020-06-04 |
|
4 | TENB |
Tenable Holdings, Inc.
Common Stock |
S - Sale | -32 | 2,656,403 | 0.00 | 30.95 | -990 | 82,215,673 | |
| 2020-06-04 |
|
4 | TENB |
Tenable Holdings, Inc.
Common Stock |
S - Sale | -35 | 2,888,953 | 0.00 | 30.95 | -1,083 | 89,413,095 | |
| 2020-06-04 |
|
4 | TENB |
Tenable Holdings, Inc.
Common Stock |
S - Sale | -43 | 3,593,487 | 0.00 | 30.95 | -1,331 | 111,218,423 | |
| 2020-06-04 |
|
4 | TENB |
Tenable Holdings, Inc.
Common Stock |
S - Sale | -11,091 | 3,269,458 | -0.34 | 30.26 | -335,564 | 98,919,087 | |
| 2020-06-04 |
|
4 | TENB |
Tenable Holdings, Inc.
Common Stock |
S - Sale | -9,012 | 2,656,435 | -0.34 | 30.26 | -272,663 | 80,371,769 | |
| 2020-06-04 |
|
4 | TENB |
Tenable Holdings, Inc.
Common Stock |
S - Sale | -9,801 | 2,888,988 | -0.34 | 30.26 | -296,534 | 87,407,776 | |
| 2020-06-04 |
|
4 | TENB |
Tenable Holdings, Inc.
Common Stock |
S - Sale | -12,191 | 3,593,530 | -0.34 | 30.26 | -368,845 | 108,724,047 | |
| 2020-06-04 |
|
4 | TENB |
Tenable Holdings, Inc.
Common Stock |
S - Sale | -406 | 151,103 | -0.27 | 30.07 | -12,208 | 4,543,471 | |
| 2020-06-04 |
|
4 | TENB |
Tenable Holdings, Inc.
Common Stock |
S - Sale | -2,153 | 802,036 | -0.27 | 30.07 | -64,738 | 24,116,180 | |
| 2020-06-04 |
|
4 | TENB |
Tenable Holdings, Inc.
Common Stock |
S - Sale | -10,097 | 3,761,335 | -0.27 | 30.07 | -303,604 | 113,098,454 | |
| 2020-06-04 |
|
4 | TENB |
Tenable Holdings, Inc.
Common Stock |
S - Sale | -20,322 | 7,569,973 | -0.27 | 30.07 | -611,056 | 227,619,247 | |
| 2020-06-04 |
|
4 | TENB |
Tenable Holdings, Inc.
Common Stock |
S - Sale | -1,102 | 151,509 | -0.72 | 30.37 | -33,467 | 4,601,253 | |
| 2020-06-04 |
|
4 | TENB |
Tenable Holdings, Inc.
Common Stock |
S - Sale | -5,849 | 804,189 | -0.72 | 30.37 | -177,631 | 24,422,818 | |
| 2020-06-04 |
|
4 | TENB |
Tenable Holdings, Inc.
Common Stock |
S - Sale | -27,430 | 3,771,432 | -0.72 | 30.37 | -833,035 | 114,536,504 | |
| 2020-06-04 |
|
4 | TENB |
Tenable Holdings, Inc.
Common Stock |
S - Sale | -55,203 | 7,590,295 | -0.72 | 30.37 | -1,676,488 | 230,513,464 | |
| 2020-06-04 |
|
4 | TENB |
Tenable Holdings, Inc.
Common Stock |
S - Sale | -2 | 152,611 | 0.00 | 30.95 | -62 | 4,723,310 | |
| 2020-06-04 |
|
4 | TENB |
Tenable Holdings, Inc.
Common Stock |
S - Sale | -10 | 810,038 | 0.00 | 30.95 | -310 | 25,070,676 | |
| 2020-06-04 |
|
4 | TENB |
Tenable Holdings, Inc.
Common Stock |
S - Sale | -46 | 3,798,862 | 0.00 | 30.95 | -1,424 | 117,574,779 | |
| 2020-06-04 |
|
4 | TENB |
Tenable Holdings, Inc.
Common Stock |
S - Sale | -92 | 7,645,498 | 0.00 | 30.95 | -2,847 | 236,628,163 | |
| 2020-06-04 |
|
4 | TENB |
Tenable Holdings, Inc.
Common Stock |
S - Sale | -518 | 152,613 | -0.34 | 30.26 | -15,672 | 4,617,383 | |
| 2020-06-04 |
|
4 | TENB |
Tenable Holdings, Inc.
Common Stock |
S - Sale | -2,748 | 810,048 | -0.34 | 30.26 | -83,142 | 24,508,407 | |
| 2020-06-04 |
|
4 | TENB |
Tenable Holdings, Inc.
Common Stock |
S - Sale | -12,887 | 3,798,908 | -0.34 | 30.26 | -389,903 | 114,937,861 | |
| 2020-06-04 |
|
4 | TENB |
Tenable Holdings, Inc.
Common Stock |
S - Sale | -25,937 | 7,645,590 | -0.34 | 30.26 | -784,737 | 231,321,148 | |
| 2020-05-22 |
|
4 | TENB |
Tenable Holdings, Inc.
Common Stock |
S - Sale | -7,793 | 153,131 | -4.84 | 29.19 | -227,478 | 4,469,894 | |
| 2020-05-22 |
|
4 | TENB |
Tenable Holdings, Inc.
Common Stock |
S - Sale | -41,363 | 812,796 | -4.84 | 29.19 | -1,207,386 | 23,725,515 | |
| 2020-05-22 |
|
4 | TENB |
Tenable Holdings, Inc.
Common Stock |
S - Sale | -193,980 | 3,811,795 | -4.84 | 29.19 | -5,662,276 | 111,266,296 | |
| 2020-05-22 |
|
4 | TENB |
Tenable Holdings, Inc.
Common Stock |
S - Sale | -390,398 | 7,671,527 | -4.84 | 29.19 | -11,395,718 | 223,931,873 | |
| 2020-05-22 |
|
4 | TENB |
Tenable Holdings, Inc.
Common Stock |
S - Sale | -430 | 160,924 | -0.27 | 29.09 | -12,509 | 4,681,279 | |
| 2020-05-22 |
|
4 | TENB |
Tenable Holdings, Inc.
Common Stock |
S - Sale | -2,285 | 854,159 | -0.27 | 29.09 | -66,471 | 24,847,485 | |
| 2020-05-22 |
|
4 | TENB |
Tenable Holdings, Inc.
Common Stock |
S - Sale | -10,714 | 4,005,775 | -0.27 | 29.09 | -311,670 | 116,527,995 | |
| 2020-05-22 |
|
4 | TENB |
Tenable Holdings, Inc.
Common Stock |
S - Sale | -21,564 | 8,061,925 | -0.27 | 29.09 | -627,297 | 234,521,398 | |
| 2020-05-22 |
|
4 | TENB |
Tenable Holdings, Inc.
Common Stock |
S - Sale | -787 | 161,354 | -0.49 | 29.75 | -23,413 | 4,800,282 | |
| 2020-05-22 |
|
4 | TENB |
Tenable Holdings, Inc.
Common Stock |
S - Sale | -4,178 | 856,444 | -0.49 | 29.75 | -124,296 | 25,479,209 | |
| 2020-05-22 |
|
4 | TENB |
Tenable Holdings, Inc.
Common Stock |
S - Sale | -19,595 | 4,016,489 | -0.49 | 29.75 | -582,951 | 119,490,548 | |
| 2020-05-22 |
|
4 | TENB |
Tenable Holdings, Inc.
Common Stock |
S - Sale | -39,437 | 8,083,489 | -0.49 | 29.75 | -1,173,251 | 240,483,798 | |
| 2020-05-22 |
|
4 | TENB |
Tenable Holdings, Inc.
Common Stock |
S - Sale | -166,945 | 3,280,549 | -4.84 | 29.19 | -4,873,125 | 95,759,225 | |
| 2020-05-22 |
|
4 | TENB |
Tenable Holdings, Inc.
Common Stock |
S - Sale | -135,643 | 2,665,447 | -4.84 | 29.19 | -3,959,419 | 77,804,398 | |
| 2020-05-22 |
|
4 | TENB |
Tenable Holdings, Inc.
Common Stock |
S - Sale | -147,518 | 2,898,789 | -4.84 | 29.19 | -4,306,050 | 84,615,651 | |
| 2020-05-22 |
|
4 | TENB |
Tenable Holdings, Inc.
Common Stock |
S - Sale | -183,493 | 3,605,721 | -4.84 | 29.19 | -5,356,161 | 105,250,996 | |
| 2020-05-22 |
|
4 | TENB |
Tenable Holdings, Inc.
Common Stock |
S - Sale | -9,221 | 3,447,494 | -0.27 | 29.09 | -268,239 | 100,287,600 | |
| 2020-05-22 |
|
4 | TENB |
Tenable Holdings, Inc.
Common Stock |
S - Sale | -7,492 | 2,801,090 | -0.27 | 29.09 | -217,942 | 81,483,708 | |
| 2020-05-22 |
|
4 | TENB |
Tenable Holdings, Inc.
Common Stock |
S - Sale | -8,148 | 3,046,307 | -0.27 | 29.09 | -237,025 | 88,617,071 | |
| 2020-05-22 |
|
4 | TENB |
Tenable Holdings, Inc.
Common Stock |
S - Sale | -10,135 | 3,789,214 | -0.27 | 29.09 | -294,827 | 110,228,235 | |
| 2020-05-22 |
|
4 | TENB |
Tenable Holdings, Inc.
Common Stock |
S - Sale | -16,864 | 3,456,715 | -0.49 | 29.75 | -501,704 | 102,837,271 | |
| 2020-05-22 |
|
4 | TENB |
Tenable Holdings, Inc.
Common Stock |
S - Sale | -13,702 | 2,808,582 | -0.49 | 29.75 | -407,634 | 83,555,314 | |
| 2020-05-22 |
|
4 | TENB |
Tenable Holdings, Inc.
Common Stock |
S - Sale | -14,901 | 3,054,455 | -0.49 | 29.75 | -443,305 | 90,870,036 | |
| 2020-05-22 |
|
4 | TENB |
Tenable Holdings, Inc.
Common Stock |
S - Sale | -18,536 | 3,799,349 | -0.49 | 29.75 | -551,446 | 113,030,633 | |
| 2020-02-11 |
|
4/A | PS |
Pluralsight, Inc.
Class B common stock |
C - Conversion | -2,872,292 | 9,269,973 | -23.66 | ||||
| 2020-02-11 |
|
4/A | PS |
Pluralsight, Inc.
Class B common stock |
C - Conversion | -2,872,292 | 9,269,973 | -23.66 | ||||
| 2019-09-11 |
|
4 | SMAR |
SMARTSHEET INC
Class B Common Stock |
C - Conversion | -1,305,293 | 1,391,707 | -48.40 | ||||
| 2019-09-11 |
|
4 | SMAR |
SMARTSHEET INC
Class B Common Stock |
C - Conversion | -56,015 | 59,725 | -48.40 | ||||
| 2019-09-11 |
|
4 | SMAR |
SMARTSHEET INC
Class B Common Stock |
C - Conversion | -153,084 | 163,218 | -48.40 | ||||
| 2019-09-11 |
|
4 | SMAR |
SMARTSHEET INC
Class B Common Stock |
C - Conversion | -1,065,417 | 1,135,949 | -48.40 | ||||
| 2019-09-11 |
|
4 | SMAR |
SMARTSHEET INC
Class B Common Stock |
C - Conversion | -2,420,191 | 2,580,408 | -48.40 | ||||
| 2019-09-11 |
|
4 | SMAR |
SMARTSHEET INC
Class A Common Stock |
J - Other | 129,124 | 344,726 | 59.89 | ||||
| 2019-09-11 |
|
4 | SMAR |
SMARTSHEET INC
Class A Common Stock |
J - Other | -1,305,293 | 0 | -100.00 | ||||
| 2019-09-11 |
|
4 | SMAR |
SMARTSHEET INC
Class A Common Stock |
J - Other | -56,015 | 0 | -100.00 | ||||
| 2019-09-11 |
|
4 | SMAR |
SMARTSHEET INC
Class A Common Stock |
J - Other | -153,084 | 0 | -100.00 | ||||
| 2019-09-11 |
|
4 | SMAR |
SMARTSHEET INC
Class A Common Stock |
J - Other | -1,065,417 | 0 | -100.00 | ||||
| 2019-09-11 |
|
4 | SMAR |
SMARTSHEET INC
Class A Common Stock |
J - Other | -2,420,191 | 0 | -100.00 | ||||
| 2019-09-11 |
|
4 | SMAR |
SMARTSHEET INC
Class A Common Stock |
C - Conversion | 1,305,293 | 1,305,293 | |||||
| 2019-09-11 |
|
4 | SMAR |
SMARTSHEET INC
Class A Common Stock |
C - Conversion | 56,015 | 56,015 | |||||
| 2019-09-11 |
|
4 | SMAR |
SMARTSHEET INC
Class A Common Stock |
C - Conversion | 153,084 | 153,084 | |||||
| 2019-09-11 |
|
4 | SMAR |
SMARTSHEET INC
Class A Common Stock |
C - Conversion | 1,065,417 | 1,065,417 | |||||
| 2019-09-11 |
|
4 | SMAR |
SMARTSHEET INC
Class A Common Stock |
C - Conversion | 2,420,191 | 2,420,191 | |||||
| 2019-06-05 |
|
4 | PS |
Pluralsight, Inc.
Class B common stock |
C - Conversion | -2,115,442 | 10,026,823 | -17.42 | ||||
| 2019-06-05 |
|
4 | PS |
Pluralsight, Inc.
Class A common stock |
C - Conversion | 41,480 | 61,964 | 202.50 | ||||
| 2019-06-05 |
|
4 | PS |
Pluralsight, Inc.
Class A common stock |
C - Conversion | 1,793,831 | 2,679,709 | 202.49 | ||||
| 2019-06-05 |
|
4 | PS |
Pluralsight, Inc.
Class B Common Stock |
C - Conversion | -2,115,442 | 10,026,823 | -17.42 | ||||
| 2019-06-05 |
|
4 | PS |
Pluralsight, Inc.
Class A Common Stock |
C - Conversion | 1,036,981 | 1,549,091 | 202.49 | ||||
| 2019-06-03 |
|
4 | PS |
Pluralsight, Inc.
Class A Common Stock |
J - Other | -1,549,091 | 512,110 | -75.15 | ||||
| 2019-06-03 |
|
4 | PS |
Pluralsight, Inc.
Class A Common Stock |
J - Other | -360,000 | 1,137,762 | -24.04 | ||||
| 2019-06-03 |
|
4 | PS |
Pluralsight, Inc.
Class A Common Stock |
J - Other | 120,592 | 236,965 | 103.63 | ||||
| 2019-06-03 |
|
4 | PS |
Pluralsight, Inc.
Class A Common Stock |
J - Other | -61,964 | 20,484 | -75.16 | ||||
| 2019-06-03 |
|
4 | PS |
Pluralsight, Inc.
Class A Common Stock |
J - Other | -2,679,709 | 885,878 | -75.15 | ||||
| 2019-06-03 |
|
4 | PS |
Pluralsight, Inc.
Class A Common Stock |
J - Other | -169,527 | 535,783 | -24.04 | ||||
| 2019-06-03 |
|
4 | PS |
Pluralsight, Inc.
Class A Common Stock |
J - Other | -1,179,709 | 3,728,410 | -24.04 | ||||
| 2019-05-30 |
|
4 | TENB |
Tenable Holdings, Inc.
Common Stock |
J - Other | -263,501 | 3,473,579 | -7.05 | ||||
| 2019-05-30 |
|
4 | TENB |
Tenable Holdings, Inc.
Common Stock |
J - Other | -214,094 | 2,822,284 | -7.05 | ||||
| 2019-05-30 |
|
4 | TENB |
Tenable Holdings, Inc.
Common Stock |
J - Other | -232,837 | 3,069,356 | -7.05 | ||||
| 2019-05-30 |
|
4 | TENB |
Tenable Holdings, Inc.
Common Stock |
J - Other | -289,619 | 3,817,885 | -7.05 | ||||
| 2019-05-30 |
|
4 | TENB |
Tenable Holdings, Inc.
Common Stock |
J - Other | 25,699 | 25,699 | |||||
| 2019-05-30 |
|
4 | TENB |
Tenable Holdings, Inc.
Common Stock |
J - Other | -12,300 | 162,141 | -7.05 | ||||
| 2019-05-30 |
|
4 | TENB |
Tenable Holdings, Inc.
Common Stock |
J - Other | -65,286 | 860,622 | -7.05 | ||||
| 2019-05-30 |
|
4 | TENB |
Tenable Holdings, Inc.
Common Stock |
J - Other | -306,171 | 4,036,084 | -7.05 | ||||
| 2019-05-30 |
|
4 | TENB |
Tenable Holdings, Inc.
Common Stock |
J - Other | -616,192 | 8,122,926 | -7.05 | ||||
| 2019-05-23 |
|
4 | PS |
Pluralsight, Inc.
Class A Common Stock |
J - Other | -1,549,091 | 2,061,201 | -42.91 | ||||
| 2019-05-23 |
|
4 | PS |
Pluralsight, Inc.
Class A Common Stock |
J - Other | -360,000 | 1,497,762 | -19.38 | ||||
| 2019-05-23 |
|
4 | PS |
Pluralsight, Inc.
Class A Common Stock |
J - Other | 116,373 | 116,373 | |||||
| 2019-05-23 |
|
4 | PS |
Pluralsight, Inc.
Class A Common Stock |
J - Other | -61,964 | 82,448 | -42.91 | ||||
| 2019-05-23 |
|
4 | PS |
Pluralsight, Inc.
Class A Common Stock |
J - Other | -2,679,709 | 3,565,587 | -42.91 | ||||
| 2019-05-23 |
|
4 | PS |
Pluralsight, Inc.
Class A Common Stock |
J - Other | -169,527 | 705,310 | -19.38 | ||||
| 2019-05-23 |
|
4 | PS |
Pluralsight, Inc.
Class A Common Stock |
J - Other | -1,179,709 | 4,908,119 | -19.38 | ||||
| 2019-04-08 |
|
4 | SMAR |
SMARTSHEET INC
Class A Common Stock |
S - Sale | -2,751 | 215,602 | -1.26 | 39.02 | -107,357 | 8,413,803 | |
| 2019-04-08 |
|
4 | SMAR |
SMARTSHEET INC
Class A Common Stock |
S - Sale | -1,307 | 218,353 | -0.60 | 38.22 | -49,960 | 8,346,500 | |
| 2019-04-08 |
|
4 | SMAR |
SMARTSHEET INC
Class A Common Stock |
S - Sale | -5,293 | 219,660 | -2.35 | 38.69 | -204,772 | 8,498,074 | |
| 2019-04-04 |
|
4 | SMAR |
SMARTSHEET INC
Class A Common Stock |
C - Conversion | 2,420,191 | 2,420,191 | |||||
| 2019-04-04 |
|
4 | SMAR |
SMARTSHEET INC
Class B Common Stock |
C - Conversion | -1,305,293 | 2,697,000 | -32.61 | ||||
| 2019-04-04 |
|
4 | SMAR |
SMARTSHEET INC
Class B Common Stock |
C - Conversion | -56,015 | 115,740 | -32.61 | ||||
| 2019-04-04 |
|
4 | SMAR |
SMARTSHEET INC
Class B Common Stock |
C - Conversion | -153,084 | 316,302 | -32.61 | ||||
| 2019-04-04 |
|
4 | SMAR |
SMARTSHEET INC
Class B Common Stock |
C - Conversion | -1,065,417 | 2,201,366 | -32.61 | ||||
| 2019-04-04 |
|
4 | SMAR |
SMARTSHEET INC
Class B Common Stock |
C - Conversion | -2,420,191 | 5,000,599 | -32.61 | ||||
| 2019-04-04 |
|
4 | SMAR |
SMARTSHEET INC
Class A Common Stock |
J - Other | 121,868 | 224,953 | 118.22 | ||||
| 2019-04-04 |
|
4 | SMAR |
SMARTSHEET INC
Class A Common Stock |
J - Other | -1,305,293 | 0 | -100.00 | ||||
| 2019-04-04 |
|
4 | SMAR |
SMARTSHEET INC
Class A Common Stock |
J - Other | -56,015 | 0 | -100.00 | ||||
| 2019-04-04 |
|
4 | SMAR |
SMARTSHEET INC
Class A Common Stock |
J - Other | -153,084 | 0 | -100.00 | ||||
| 2019-04-04 |
|
4 | SMAR |
SMARTSHEET INC
Class A Common Stock |
J - Other | -1,065,417 | 0 | -100.00 | ||||
| 2019-04-04 |
|
4 | SMAR |
SMARTSHEET INC
Class A Common Stock |
J - Other | -2,420,191 | 0 | -100.00 | ||||
| 2019-04-04 |
|
4 | SMAR |
SMARTSHEET INC
Class A Common Stock |
C - Conversion | 1,305,293 | 1,305,293 | |||||
| 2019-04-04 |
|
4 | SMAR |
SMARTSHEET INC
Class A Common Stock |
C - Conversion | 56,015 | 56,015 | |||||
| 2019-04-04 |
|
4 | SMAR |
SMARTSHEET INC
Class A Common Stock |
C - Conversion | 153,084 | 153,084 | |||||
| 2019-04-04 |
|
4 | SMAR |
SMARTSHEET INC
Class A Common Stock |
C - Conversion | 1,065,417 | 1,065,417 | |||||
| 2019-04-03 |
|
4 | SMAR |
SMARTSHEET INC
Class A Common Stock |
S - Sale | -7,605 | 103,085 | -6.87 | 40.10 | -304,925 | 4,133,224 | |
| 2019-04-03 |
|
4 | SMAR |
SMARTSHEET INC
Class A Common Stock |
S - Sale | -13,913 | 110,690 | -11.17 | 41.27 | -574,130 | 4,567,700 | |
| 2019-04-03 |
|
4 | SMAR |
SMARTSHEET INC
Class A Common Stock |
S - Sale | -15,487 | 124,603 | -11.06 | 40.37 | -625,219 | 5,030,298 | |
| 2019-04-03 |
|
4 | SMAR |
SMARTSHEET INC
Class A Common Stock |
S - Sale | -64,220 | 140,090 | -31.43 | 40.66 | -2,611,487 | 5,696,718 | |
| 2019-04-03 |
|
4 | SMAR |
SMARTSHEET INC
Class A Common Stock |
S - Sale | -133,069 | 204,310 | -39.44 | 40.25 | -5,356,360 | 8,223,988 | |
| 2019-04-03 |
|
4 | SMAR |
SMARTSHEET INC
Class A Common Stock |
S - Sale | -137,219 | 337,379 | -28.91 | 40.10 | -5,502,866 | 13,529,843 | |
| 2019-03-29 |
|
4 | SMAR |
SMARTSHEET INC
Class B Common Stock |
C - Conversion | 1,044,235 | 4,002,293 | 35.30 | ||||
| 2019-03-29 |
|
4 | SMAR |
SMARTSHEET INC
Class B Common Stock |
C - Conversion | 44,812 | 171,755 | 35.30 | ||||
| 2019-03-29 |
|
4 | SMAR |
SMARTSHEET INC
Class B Common Stock |
C - Conversion | 122,467 | 469,386 | 35.30 | ||||
| 2019-03-29 |
|
4 | SMAR |
SMARTSHEET INC
Class B Common Stock |
C - Conversion | 852,334 | 3,266,783 | 35.30 | ||||
| 2019-03-29 |
|
4 | SMAR |
SMARTSHEET INC
Class B Common Stock |
C - Conversion | 1,936,152 | 7,420,790 | 35.30 | ||||
| 2019-03-29 |
|
4 | SMAR |
SMARTSHEET INC
Class A Common Stock |
J - Other | 103,085 | 474,598 | 27.75 | ||||
| 2019-03-29 |
|
4 | SMAR |
SMARTSHEET INC
Class A Common Stock |
J - Other | -1,044,235 | 0 | -100.00 | ||||
| 2019-03-29 |
|
4 | SMAR |
SMARTSHEET INC
Class A Common Stock |
J - Other | -44,812 | 0 | -100.00 | ||||
| 2019-03-29 |
|
4 | SMAR |
SMARTSHEET INC
Class A Common Stock |
J - Other | -122,467 | 0 | -100.00 | ||||
| 2019-03-29 |
|
4 | SMAR |
SMARTSHEET INC
Class A Common Stock |
J - Other | -852,334 | 0 | -100.00 | ||||
| 2019-03-29 |
|
4 | SMAR |
SMARTSHEET INC
Class A Common Stock |
J - Other | -1,936,152 | 0 | -100.00 | ||||
| 2019-03-29 |
|
4 | SMAR |
SMARTSHEET INC
Class A Common Stock |
C - Conversion | 1,044,235 | 1,044,235 | |||||
| 2019-03-29 |
|
4 | SMAR |
SMARTSHEET INC
Class A Common Stock |
C - Conversion | 44,812 | 44,812 | |||||
| 2019-03-29 |
|
4 | SMAR |
SMARTSHEET INC
Class A Common Stock |
C - Conversion | 122,467 | 122,467 | |||||
| 2019-03-29 |
|
4 | SMAR |
SMARTSHEET INC
Class A Common Stock |
C - Conversion | 852,334 | 852,334 | |||||
| 2019-03-29 |
|
4 | SMAR |
SMARTSHEET INC
Class A Common Stock |
C - Conversion | 1,936,152 | 1,936,152 | |||||
| 2019-03-25 |
|
4 | SMAR |
SMARTSHEET INC
Class B Common Stock |
C - Conversion | -1,566,352 | 5,046,528 | -23.69 | ||||
| 2019-03-25 |
|
4 | SMAR |
SMARTSHEET INC
Class B Common Stock |
C - Conversion | -67,218 | 216,567 | -23.69 | ||||
| 2019-03-25 |
|
4 | SMAR |
SMARTSHEET INC
Class B Common Stock |
C - Conversion | -183,700 | 591,853 | -23.69 | ||||
| 2019-03-25 |
|
4 | SMAR |
SMARTSHEET INC
Class B Common Stock |
C - Conversion | -1,278,501 | 4,119,117 | -23.69 | ||||
| 2019-03-25 |
|
4 | SMAR |
SMARTSHEET INC
Class B Common Stock |
C - Conversion | -2,904,229 | 9,356,942 | -23.69 | ||||
| 2019-03-25 |
|
4 | SMAR |
SMARTSHEET INC
Class A Common Stock |
J - Other | 155,240 | 155,240 | |||||
| 2019-03-25 |
|
4 | SMAR |
SMARTSHEET INC
Class A Common Stock |
J - Other | -8,866 | 0 | -100.00 | ||||
| 2019-03-25 |
|
4 | SMAR |
SMARTSHEET INC
Class A Common Stock |
J - Other | -1,566,352 | 0 | -100.00 | ||||
| 2019-03-25 |
|
4 | SMAR |
SMARTSHEET INC
Class A Common Stock |
J - Other | -67,218 | 0 | -100.00 | ||||
| 2019-03-25 |
|
4 | SMAR |
SMARTSHEET INC
Class A Common Stock |
J - Other | -183,700 | 0 | -100.00 | ||||
| 2019-03-25 |
|
4 | SMAR |
SMARTSHEET INC
Class A Common Stock |
J - Other | -1,278,501 | 0 | -100.00 | ||||
| 2019-03-25 |
|
4 | SMAR |
SMARTSHEET INC
Class A Common Stock |
J - Other | -2,904,229 | 0 | -100.00 | ||||
| 2019-03-25 |
|
4 | SMAR |
SMARTSHEET INC
Class A Common Stock |
C - Conversion | 1,566,352 | 1,566,352 | |||||
| 2019-03-25 |
|
4 | SMAR |
SMARTSHEET INC
Class A Common Stock |
C - Conversion | 67,218 | 67,218 | |||||
| 2019-03-25 |
|
4 | SMAR |
SMARTSHEET INC
Class A Common Stock |
C - Conversion | 183,700 | 183,700 | |||||
| 2019-03-25 |
|
4 | SMAR |
SMARTSHEET INC
Class A Common Stock |
C - Conversion | 1,278,501 | 1,278,501 | |||||
| 2019-03-25 |
|
4 | SMAR |
SMARTSHEET INC
Class A Common Stock |
C - Conversion | 2,904,229 | 2,904,229 | |||||
| 2019-03-22 |
|
4 | PS |
Pluralsight, Inc.
Class A Common Stock |
S - Sale | -525,082 | 3,610,292 | -12.70 | ||||
| 2019-03-22 |
|
4 | PS |
Pluralsight, Inc.
Class A Common Stock |
S - Sale | -122,026 | 1,857,762 | -6.16 | ||||
| 2019-03-22 |
|
4 | PS |
Pluralsight, Inc.
Class A Common Stock |
S - Sale | -21,003 | 144,412 | -12.70 | ||||
| 2019-03-22 |
|
4 | PS |
Pluralsight, Inc.
Class A Common Stock |
S - Sale | -908,320 | 6,245,296 | -12.70 | ||||
| 2019-03-22 |
|
4 | PS |
Pluralsight, Inc.
Class A Common Stock |
S - Sale | -57,463 | 874,837 | -6.16 | ||||
| 2019-03-22 |
|
4 | PS |
Pluralsight, Inc.
Class A Common Stock |
S - Sale | -399,876 | 6,087,828 | -6.16 | ||||
| 2019-03-15 |
|
4 | AYX |
Alteryx, Inc.
Class B Common Stock |
C - Conversion | -27,683 | 26,249 | -51.33 | ||||
| 2019-03-15 |
|
4 | AYX |
Alteryx, Inc.
Class B Common Stock |
C - Conversion | -246,016 | 233,276 | -51.33 | ||||
| 2019-03-15 |
|
4 | AYX |
Alteryx, Inc.
Class B Common Stock |
C - Conversion | -200,640 | 190,251 | -51.33 | ||||
| 2019-03-15 |
|
4 | AYX |
Alteryx, Inc.
Class B Common Stock |
C - Conversion | -775,661 | 735,495 | -51.33 | ||||
| 2019-03-15 |
|
4 | AYX |
Alteryx, Inc.
Class A Common Stock |
J - Other | 31,083 | 99,107 | 45.69 | ||||
| 2019-03-15 |
|
4 | AYX |
Alteryx, Inc.
Class A Common Stock |
J - Other | -27,683 | 7,474 | -78.74 | ||||
| 2019-03-15 |
|
4 | AYX |
Alteryx, Inc.
Class A Common Stock |
J - Other | -246,016 | 66,424 | -78.74 | ||||
| 2019-03-15 |
|
4 | AYX |
Alteryx, Inc.
Class A Common Stock |
J - Other | -200,640 | 54,173 | -78.74 | ||||
| 2019-03-15 |
|
4 | AYX |
Alteryx, Inc.
Class A Common Stock |
J - Other | -775,661 | 209,429 | -78.74 | ||||
| 2019-03-15 |
|
4 | AYX |
Alteryx, Inc.
Class A Common Stock |
C - Conversion | 27,683 | 35,157 | 370.39 | ||||
| 2019-03-15 |
|
4 | AYX |
Alteryx, Inc.
Class A Common Stock |
C - Conversion | 246,016 | 312,440 | 370.37 | ||||
| 2019-03-15 |
|
4 | AYX |
Alteryx, Inc.
Class A Common Stock |
C - Conversion | 200,640 | 254,813 | 370.37 | ||||
| 2019-03-15 |
|
4 | AYX |
Alteryx, Inc.
Class A Common Stock |
C - Conversion | 775,661 | 985,090 | 370.37 | ||||
| 2019-03-15 |
|
4 | AYX |
Alteryx, Inc.
Class B Common Stock |
C - Conversion | -524,829 | 497,652 | -51.33 | ||||
| 2019-03-15 |
|
4 | AYX |
Alteryx, Inc.
Class B Common Stock |
C - Conversion | -725,171 | 687,622 | -51.33 | ||||
| 2019-03-15 |
|
4 | AYX |
Alteryx, Inc.
Class A Common Stock |
J - Other | -524,829 | 141,704 | -78.74 | ||||
| 2019-03-15 |
|
4 | AYX |
Alteryx, Inc.
Class A Common Stock |
J - Other | -725,171 | 195,796 | -78.74 | ||||
| 2019-03-15 |
|
4 | AYX |
Alteryx, Inc.
Class A Common Stock |
C - Conversion | 524,829 | 666,533 | 370.37 | ||||
| 2019-03-15 |
|
4 | AYX |
Alteryx, Inc.
Class A Common Stock |
C - Conversion | 725,171 | 920,967 | 370.37 | ||||
| 2019-03-12 |
|
4 | PS |
Pluralsight, Inc.
Class A Common Stock |
S - Sale | -3,007,818 | 4,135,374 | -42.11 | 28.37 | -85,339,316 | 117,330,899 | |
| 2019-03-12 |
|
4 | PS |
Pluralsight, Inc.
Class A Common Stock |
S - Sale | -699,000 | 1,979,788 | -26.09 | 28.37 | -19,832,378 | 56,171,535 | |
| 2019-03-12 |
|
4 | PS |
Pluralsight, Inc.
Class A Common Stock |
S - Sale | -120,313 | 165,415 | -42.11 | 28.37 | -3,413,581 | 4,693,237 | |
| 2019-03-12 |
|
4 | PS |
Pluralsight, Inc.
Class A Common Stock |
S - Sale | -5,203,102 | 7,153,616 | -42.11 | 28.37 | -147,625,011 | 202,965,970 | |
| 2019-03-12 |
|
4 | PS |
Pluralsight, Inc.
Class A Common Stock |
S - Sale | -329,165 | 932,300 | -26.09 | 28.37 | -9,339,234 | 26,451,682 | |
| 2019-03-12 |
|
4 | PS |
Pluralsight, Inc.
Class A Common Stock |
S - Sale | -2,290,602 | 6,487,704 | -26.09 | 28.37 | -64,990,105 | 184,072,382 | |
| 2019-03-08 |
|
4 | PS |
Pluralsight, Inc.
Class B Common Stock |
C - Conversion | -19,785,638 | 12,142,265 | -61.97 | ||||
| 2019-03-08 |
|
4 | PS |
Pluralsight, Inc.
Class A Common Stock |
C - Conversion | 285,728 | 285,728 | |||||
| 2019-03-08 |
|
4 | PS |
Pluralsight, Inc.
Class A Common Stock |
C - Conversion | 12,356,718 | 12,356,718 | |||||
| 2019-03-08 |
|
4 | PS |
Pluralsight, Inc.
Class B Common Stock |
C - Conversion | -19,785,638 | 12,142,265 | -61.97 | ||||
| 2019-03-08 |
|
4 | PS |
Pluralsight, Inc.
Class A Common Stock |
C - Conversion | 7,143,192 | 7,143,192 | |||||
| 2019-03-06 |
|
4 | AYX |
Alteryx, Inc.
Class B Common Stock |
C - Conversion | -27,682 | 53,932 | -33.92 | ||||
| 2019-03-06 |
|
4 | AYX |
Alteryx, Inc.
Class B Common Stock |
C - Conversion | -246,016 | 479,292 | -33.92 | ||||
| 2019-03-06 |
|
4 | AYX |
Alteryx, Inc.
Class B Common Stock |
C - Conversion | -200,641 | 390,891 | -33.92 | ||||
| 2019-03-06 |
|
4 | AYX |
Alteryx, Inc.
Class B Common Stock |
C - Conversion | -775,661 | 1,511,156 | -33.92 | ||||
| 2019-03-06 |
|
4 | AYX |
Alteryx, Inc.
Class A Common Stock |
J - Other | 31,695 | 67,304 | 89.01 | ||||
| 2019-03-06 |
|
4 | AYX |
Alteryx, Inc.
Class A Common Stock |
J - Other | -27,682 | 7,474 | -78.74 | ||||
| 2019-03-06 |
|
4 | AYX |
Alteryx, Inc.
Class A Common Stock |
J - Other | -246,016 | 66,424 | -78.74 | ||||
| 2019-03-06 |
|
4 | AYX |
Alteryx, Inc.
Class A Common Stock |
J - Other | -200,641 | 54,173 | -78.74 | ||||
| 2019-03-06 |
|
4 | AYX |
Alteryx, Inc.
Class A Common Stock |
J - Other | -775,661 | 209,429 | -78.74 | ||||
| 2019-03-06 |
|
4 | AYX |
Alteryx, Inc.
Class A Common Stock |
C - Conversion | 27,682 | 35,156 | 370.38 | ||||
| 2019-03-06 |
|
4 | AYX |
Alteryx, Inc.
Class A Common Stock |
C - Conversion | 246,016 | 312,440 | 370.37 | ||||
| 2019-03-06 |
|
4 | AYX |
Alteryx, Inc.
Class A Common Stock |
C - Conversion | 200,641 | 254,814 | 370.37 | ||||
| 2019-03-06 |
|
4 | AYX |
Alteryx, Inc.
Class A Common Stock |
C - Conversion | 775,661 | 985,090 | 370.37 | ||||
| 2019-03-06 |
|
4 | AYX |
Alteryx, Inc.
Class B Common Stock |
C - Conversion | -524,829 | 1,022,481 | -33.92 | ||||
| 2019-03-06 |
|
4 | AYX |
Alteryx, Inc.
Class B Common Stock |
C - Conversion | -725,171 | 1,412,793 | -33.92 | ||||
| 2019-03-06 |
|
4 | AYX |
Alteryx, Inc.
Class A Common Stock |
J - Other | -524,829 | 141,704 | -78.74 | ||||
| 2019-03-06 |
|
4 | AYX |
Alteryx, Inc.
Class A Common Stock |
J - Other | -725,171 | 195,796 | -78.74 | ||||
| 2019-03-06 |
|
4 | AYX |
Alteryx, Inc.
Class A Common Stock |
C - Conversion | 524,829 | 666,533 | 370.37 | ||||
| 2019-03-06 |
|
4 | AYX |
Alteryx, Inc.
Class A Common Stock |
C - Conversion | 725,171 | 920,967 | 370.37 | ||||
| 2019-02-22 |
|
4 | MIME |
Mimecast Ltd
Ordinary Shares |
J - Other | -5,233 | 19,885 | -20.83 | ||||
| 2019-02-22 |
|
4 | MIME |
Mimecast Ltd
Ordinary Shares |
J - Other | -20,356 | 20,356 | -50.00 | ||||
| 2019-02-22 |
|
4 | MIME |
Mimecast Ltd
Ordinary Shares |
J - Other | -524,051 | 1,994,645 | -20.81 | ||||
| 2019-02-22 |
|
4 | MIME |
Mimecast Ltd
Ordinary Shares |
J - Other | -11,006 | 41,894 | -20.81 | ||||
| 2019-02-22 |
|
4 | MIME |
Mimecast Ltd
Ordinary Shares |
J - Other | -30,078 | 114,486 | -20.81 | ||||
| 2019-02-22 |
|
4 | MIME |
Mimecast Ltd
Ordinary Shares |
J - Other | -209,337 | 796,779 | -20.81 | ||||
| 2019-02-22 |
|
4 | MIME |
Mimecast Ltd
Ordinary Shares |
J - Other | -475,528 | 1,809,948 | -20.81 | ||||
| 2019-01-07 |
|
4 | SMAR |
SMARTSHEET INC
Class B Common Stock |
C - Conversion | -522,117 | 6,612,880 | -7.32 | ||||
| 2019-01-07 |
|
4 | SMAR |
SMARTSHEET INC
Class B Common Stock |
C - Conversion | -22,406 | 283,785 | -7.32 | ||||
| 2019-01-07 |
|
4 | SMAR |
SMARTSHEET INC
Class B Common Stock |
C - Conversion | -61,233 | 775,553 | -7.32 | ||||
| 2019-01-07 |
|
4 | SMAR |
SMARTSHEET INC
Class B Common Stock |
C - Conversion | -426,167 | 5,397,618 | -7.32 | ||||
| 2019-01-07 |
|
4 | SMAR |
SMARTSHEET INC
Class B Common Stock |
C - Conversion | -968,077 | 12,261,171 | -7.32 | ||||
| 2019-01-07 |
|
4 | SMAR |
SMARTSHEET INC
Class A Common Stock |
J - Other | -522,117 | 0 | -100.00 | ||||
| 2019-01-07 |
|
4 | SMAR |
SMARTSHEET INC
Class A Common Stock |
J - Other | -22,406 | 0 | -100.00 | ||||
| 2019-01-07 |
|
4 | SMAR |
SMARTSHEET INC
Class A Common Stock |
J - Other | -61,233 | 0 | -100.00 | ||||
| 2019-01-07 |
|
4 | SMAR |
SMARTSHEET INC
Class A Common Stock |
J - Other | -426,167 | 0 | -100.00 | ||||
| 2019-01-07 |
|
4 | SMAR |
SMARTSHEET INC
Class A Common Stock |
J - Other | -968,077 | 0 | -100.00 | ||||
| 2019-01-07 |
|
4 | SMAR |
SMARTSHEET INC
Class A Common Stock |
C - Conversion | 522,117 | 522,117 | |||||
| 2019-01-07 |
|
4 | SMAR |
SMARTSHEET INC
Class A Common Stock |
C - Conversion | 22,406 | 22,406 | |||||
| 2019-01-07 |
|
4 | SMAR |
SMARTSHEET INC
Class A Common Stock |
C - Conversion | 61,233 | 61,233 | |||||
| 2019-01-07 |
|
4 | SMAR |
SMARTSHEET INC
Class A Common Stock |
C - Conversion | 426,167 | 426,167 | |||||
| 2019-01-07 |
|
4 | SMAR |
SMARTSHEET INC
Class A Common Stock |
C - Conversion | 968,077 | 968,077 | |||||
| 2019-01-07 |
|
4/A | SMAR |
SMARTSHEET INC
Class B Common Stock |
C - Conversion | -15,684 | 306,191 | -4.87 | ||||
| 2019-01-07 |
|
4/A | SMAR |
SMARTSHEET INC
Class B Common Stock |
C - Conversion | -42,863 | 836,786 | -4.87 | ||||
| 2019-01-07 |
|
4/A | SMAR |
SMARTSHEET INC
Class A Common Stock |
J - Other | -15,684 | 0 | -100.00 | ||||
| 2019-01-07 |
|
4/A | SMAR |
SMARTSHEET INC
Class A Common Stock |
J - Other | -42,863 | 0 | -100.00 | ||||
| 2019-01-07 |
|
4/A | SMAR |
SMARTSHEET INC
Class A Common Stock |
C - Conversion | 15,684 | 15,684 | |||||
| 2019-01-07 |
|
4/A | SMAR |
SMARTSHEET INC
Class A Common Stock |
C - Conversion | 42,863 | 42,863 | |||||
| 2018-12-17 |
|
4 | MIME |
Mimecast Ltd
Ordinary Shares |
J - Other | -524,051 | 2,518,696 | -17.22 | ||||
| 2018-12-17 |
|
4 | MIME |
Mimecast Ltd
Ordinary Shares |
J - Other | -11,006 | 52,900 | -17.22 | ||||
| 2018-12-17 |
|
4 | MIME |
Mimecast Ltd
Ordinary Shares |
J - Other | -30,078 | 144,564 | -17.22 | ||||
| 2018-12-17 |
|
4 | MIME |
Mimecast Ltd
Ordinary Shares |
J - Other | -209,337 | 1,006,116 | -17.22 | ||||
| 2018-12-17 |
|
4 | MIME |
Mimecast Ltd
Ordinary Shares |
J - Other | -475,528 | 2,285,476 | -17.22 | ||||
| 2018-12-10 |
|
4 | MIME |
Mimecast Ltd
Ordinary Shares |
J - Other | -106 | 0 | -100.00 | ||||
| 2018-12-10 |
|
4 | MIME |
Mimecast Ltd
Ordinary Shares |
J - Other | -524,051 | 3,042,747 | -14.69 | ||||
| 2018-12-10 |
|
4 | MIME |
Mimecast Ltd
Ordinary Shares |
J - Other | -11,006 | 63,906 | -14.69 | ||||
| 2018-12-10 |
|
4 | MIME |
Mimecast Ltd
Ordinary Shares |
J - Other | -30,078 | 174,642 | -14.69 | ||||
| 2018-12-10 |
|
4 | MIME |
Mimecast Ltd
Ordinary Shares |
J - Other | -209,337 | 1,215,453 | -14.69 | ||||
| 2018-12-10 |
|
4 | MIME |
Mimecast Ltd
Ordinary Shares |
J - Other | -475,528 | 2,761,004 | -14.69 | ||||
| 2018-12-10 |
|
4 | SMAR |
SMARTSHEET INC
Class B Common Stock |
C - Conversion | -42,863 | 7,134,997 | -0.60 | ||||
| 2018-12-10 |
|
4 | SMAR |
SMARTSHEET INC
Class B Common Stock |
C - Conversion | -365,482 | 836,786 | -30.40 | ||||
| 2018-12-10 |
|
4 | SMAR |
SMARTSHEET INC
Class B Common Stock |
C - Conversion | -15,684 | 306,191 | -4.87 | ||||
| 2018-12-10 |
|
4 | SMAR |
SMARTSHEET INC
Class B Common Stock |
C - Conversion | -298,317 | 5,823,785 | -4.87 | ||||
| 2018-12-10 |
|
4 | SMAR |
SMARTSHEET INC
Class B Common Stock |
C - Conversion | -677,654 | 13,229,248 | -4.87 | ||||
| 2018-12-10 |
|
4 | SMAR |
SMARTSHEET INC
Class A Common Stock |
J - Other | -42,863 | 0 | -100.00 | ||||
| 2018-12-10 |
|
4 | SMAR |
SMARTSHEET INC
Class A Common Stock |
J - Other | -365,482 | 0 | -100.00 | ||||
| 2018-12-10 |
|
4 | SMAR |
SMARTSHEET INC
Class A Common Stock |
J - Other | -15,684 | 0 | -100.00 | ||||
| 2018-12-10 |
|
4 | SMAR |
SMARTSHEET INC
Class A Common Stock |
J - Other | -298,317 | 0 | -100.00 | ||||
| 2018-12-10 |
|
4 | SMAR |
SMARTSHEET INC
Class A Common Stock |
J - Other | -677,654 | 0 | -100.00 | ||||
| 2018-12-10 |
|
4 | SMAR |
SMARTSHEET INC
Class A Common Stock |
C - Conversion | 42,863 | 42,863 | |||||
| 2018-12-10 |
|
4 | SMAR |
SMARTSHEET INC
Class A Common Stock |
C - Conversion | 365,482 | 365,482 | |||||
| 2018-12-10 |
|
4 | SMAR |
SMARTSHEET INC
Class A Common Stock |
C - Conversion | 15,684 | 15,684 | |||||
| 2018-12-10 |
|
4 | SMAR |
SMARTSHEET INC
Class A Common Stock |
C - Conversion | 298,317 | 298,317 | |||||
| 2018-12-10 |
|
4 | SMAR |
SMARTSHEET INC
Class A Common Stock |
C - Conversion | 677,654 | 677,654 | |||||
| 2018-09-13 |
|
4 | MIME |
Mimecast Ltd
Ordinary Shares |
J - Other | -419,241 | 3,566,798 | -10.52 | ||||
| 2018-09-13 |
|
4 | MIME |
Mimecast Ltd
Ordinary Shares |
J - Other | -8,805 | 74,912 | -10.52 | ||||
| 2018-09-13 |
|
4 | MIME |
Mimecast Ltd
Ordinary Shares |
J - Other | -24,063 | 204,720 | -10.52 | ||||
| 2018-09-13 |
|
4 | MIME |
Mimecast Ltd
Ordinary Shares |
J - Other | -167,470 | 1,424,790 | -10.52 | ||||
| 2018-09-13 |
|
4 | MIME |
Mimecast Ltd
Ordinary Shares |
J - Other | -380,421 | 3,236,532 | -10.52 | ||||
| 2018-09-12 |
|
4 | AYX |
Alteryx, Inc.
Class A Common Stock |
J - Other | 2,520 | 7,561 | 49.99 | ||||
| 2018-09-12 |
|
4 | AYX |
Alteryx, Inc.
Class A Common Stock |
J - Other | -209,931 | 141,704 | -59.70 | ||||
| 2018-09-12 |
|
4 | AYX |
Alteryx, Inc.
Class A Common Stock |
J - Other | -290,069 | 195,796 | -59.70 | ||||
| 2018-09-12 |
|
4 | AYX |
Alteryx, Inc.
Class A Common Stock |
C - Conversion | 209,931 | 351,635 | 148.15 | ||||
| 2018-09-12 |
|
4 | AYX |
Alteryx, Inc.
Class A Common Stock |
C - Conversion | 290,069 | 485,865 | 148.15 | ||||
| 2018-09-12 |
|
4 | AYX |
Alteryx, Inc.
Class B Common Stock |
C - Conversion | -209,931 | 1,547,310 | -11.95 | ||||
| 2018-09-12 |
|
4 | AYX |
Alteryx, Inc.
Class B Common Stock |
C - Conversion | -290,069 | 2,137,964 | -11.95 | ||||
| 2018-09-12 |
|
4 | AYX |
Alteryx, Inc.
Class B Common Stock |
C - Conversion | -11,073 | 81,614 | -11.95 | ||||
| 2018-09-12 |
|
4 | AYX |
Alteryx, Inc.
Class B Common Stock |
C - Conversion | -98,406 | 725,308 | -11.95 | ||||
| 2018-09-12 |
|
4 | AYX |
Alteryx, Inc.
Class B Common Stock |
C - Conversion | -80,257 | 591,532 | -11.95 | ||||
| 2018-09-12 |
|
4 | AYX |
Alteryx, Inc.
Class B Common Stock |
C - Conversion | -310,264 | 2,286,817 | -11.95 | ||||
| 2018-09-12 |
|
4 | AYX |
Alteryx, Inc.
Class A Common Stock |
J - Other | 762 | 762 | |||||
| 2018-09-12 |
|
4 | AYX |
Alteryx, Inc.
Class A Common Stock |
J - Other | -11,073 | 7,474 | -59.70 | ||||
| 2018-09-12 |
|
4 | AYX |
Alteryx, Inc.
Class A Common Stock |
J - Other | -98,406 | 66,424 | -59.70 | ||||
| 2018-09-12 |
|
4 | AYX |
Alteryx, Inc.
Class A Common Stock |
J - Other | -80,257 | 54,173 | -59.70 | ||||
| 2018-09-12 |
|
4 | AYX |
Alteryx, Inc.
Class A Common Stock |
J - Other | -310,264 | 209,429 | -59.70 | ||||
| 2018-09-12 |
|
4 | AYX |
Alteryx, Inc.
Class A Common Stock |
C - Conversion | 11,073 | 18,547 | 148.15 | ||||
| 2018-09-12 |
|
4 | AYX |
Alteryx, Inc.
Class A Common Stock |
C - Conversion | 98,406 | 164,830 | 148.15 | ||||
| 2018-09-12 |
|
4 | AYX |
Alteryx, Inc.
Class A Common Stock |
C - Conversion | 80,257 | 134,430 | 148.15 | ||||
| 2018-09-12 |
|
4 | AYX |
Alteryx, Inc.
Class A Common Stock |
C - Conversion | 310,264 | 519,693 | 148.15 | ||||
| 2018-09-10 |
|
4 | AYX |
Alteryx, Inc.
Class B Common Stock |
C - Conversion | -22,146 | 92,687 | -19.29 | ||||
| 2018-09-10 |
|
4 | AYX |
Alteryx, Inc.
Class B Common Stock |
C - Conversion | -196,813 | 823,714 | -19.29 | ||||
| 2018-09-10 |
|
4 | AYX |
Alteryx, Inc.
Class B Common Stock |
C - Conversion | -160,513 | 671,789 | -19.29 | ||||
| 2018-09-10 |
|
4 | AYX |
Alteryx, Inc.
Class B Common Stock |
C - Conversion | -620,528 | 2,597,081 | -19.29 | ||||
| 2018-09-10 |
|
4 | AYX |
Alteryx, Inc.
Class A Common Stock |
J - Other | -22,146 | 7,474 | -74.77 | ||||
| 2018-09-10 |
|
4 | AYX |
Alteryx, Inc.
Class A Common Stock |
J - Other | -196,813 | 66,424 | -74.77 | ||||
| 2018-09-10 |
|
4 | AYX |
Alteryx, Inc.
Class A Common Stock |
J - Other | -160,513 | 54,173 | -74.77 | ||||
| 2018-09-10 |
|
4 | AYX |
Alteryx, Inc.
Class A Common Stock |
J - Other | -620,528 | 209,429 | -74.77 | ||||
| 2018-09-10 |
|
4 | AYX |
Alteryx, Inc.
Class A Common Stock |
C - Conversion | 22,146 | 29,620 | 296.31 | ||||
| 2018-09-10 |
|
4 | AYX |
Alteryx, Inc.
Class A Common Stock |
C - Conversion | 196,813 | 263,237 | 296.30 | ||||
| 2018-09-10 |
|
4 | AYX |
Alteryx, Inc.
Class A Common Stock |
C - Conversion | 160,513 | 214,686 | 296.30 | ||||
| 2018-09-10 |
|
4 | AYX |
Alteryx, Inc.
Class A Common Stock |
C - Conversion | 620,528 | 829,957 | 296.30 | ||||
| 2018-09-10 |
|
4 | AYX |
Alteryx, Inc.
Class B Common Stock |
C - Conversion | -419,863 | 1,757,241 | -19.29 | ||||
| 2018-09-10 |
|
4 | AYX |
Alteryx, Inc.
Class B Common Stock |
C - Conversion | -580,137 | 2,428,033 | -19.29 | ||||
| 2018-09-10 |
|
4 | AYX |
Alteryx, Inc.
Class A Common Stock |
J - Other | 5,041 | 5,041 | |||||
| 2018-09-10 |
|
4 | AYX |
Alteryx, Inc.
Class A Common Stock |
J - Other | -419,863 | 141,704 | -74.77 | ||||
| 2018-09-10 |
|
4 | AYX |
Alteryx, Inc.
Class A Common Stock |
J - Other | -580,137 | 195,796 | -74.77 | ||||
| 2018-09-10 |
|
4 | AYX |
Alteryx, Inc.
Class A Common Stock |
C - Conversion | 419,863 | 561,567 | 296.30 | ||||
| 2018-09-10 |
|
4 | AYX |
Alteryx, Inc.
Class A Common Stock |
C - Conversion | 580,137 | 775,933 | 296.30 | ||||
| 2018-08-31 |
|
4 | AYX |
Alteryx, Inc.
Class A Common Stock |
S - Sale | -3,035 | 7,475 | -28.88 | 56.07 | -170,172 | 419,123 | |
| 2018-08-31 |
|
4 | AYX |
Alteryx, Inc.
Class A Common Stock |
S - Sale | -26,979 | 66,425 | -28.88 | 56.07 | -1,512,713 | 3,724,450 | |
| 2018-08-31 |
|
4 | AYX |
Alteryx, Inc.
Class A Common Stock |
S - Sale | -22,005 | 54,173 | -28.89 | 56.07 | -1,233,820 | 3,037,480 | |
| 2018-08-31 |
|
4 | AYX |
Alteryx, Inc.
Class A Common Stock |
S - Sale | -85,068 | 209,429 | -28.89 | 56.07 | -4,769,763 | 11,742,684 | |
| 2018-08-31 |
|
4 | AYX |
Alteryx, Inc.
Class A Common Stock |
S - Sale | -57,558 | 141,704 | -28.89 | 56.07 | -3,227,277 | 7,945,343 | |
| 2018-08-31 |
|
4 | AYX |
Alteryx, Inc.
Class A Common Stock |
S - Sale | -79,535 | 195,796 | -28.89 | 56.07 | -4,459,527 | 10,978,282 | |
| 2018-08-30 |
|
4 | AYX |
Alteryx, Inc.
Class A Common Stock |
S - Sale | -11,987 | 199,262 | -5.67 | 56.67 | -679,303 | 11,292,178 | |
| 2018-08-30 |
|
4 | AYX |
Alteryx, Inc.
Class A Common Stock |
S - Sale | -16,562 | 275,331 | -5.67 | 56.67 | -938,569 | 15,603,008 | |
| 2018-08-30 |
|
4 | AYX |
Alteryx, Inc.
Class A Common Stock |
S - Sale | -5,543 | 211,249 | -2.56 | 56.22 | -311,627 | 11,876,419 | |
| 2018-08-30 |
|
4 | AYX |
Alteryx, Inc.
Class A Common Stock |
S - Sale | -7,658 | 291,893 | -2.56 | 56.22 | -430,533 | 16,410,224 | |
| 2018-08-30 |
|
4 | AYX |
Alteryx, Inc.
Class A Common Stock |
S - Sale | -108 | 216,792 | -0.05 | 56.65 | -6,118 | 12,281,267 | |
| 2018-08-30 |
|
4 | AYX |
Alteryx, Inc.
Class A Common Stock |
S - Sale | -149 | 299,551 | -0.05 | 56.65 | -8,441 | 16,969,564 | |
| 2018-08-30 |
|
4 | AYX |
Alteryx, Inc.
Class A Common Stock |
S - Sale | -22,676 | 216,900 | -9.47 | 56.11 | -1,272,350 | 12,170,259 | |
| 2018-08-30 |
|
4 | AYX |
Alteryx, Inc.
Class A Common Stock |
S - Sale | -31,334 | 299,700 | -9.47 | 56.11 | -1,758,151 | 16,816,167 | |
| 2018-08-30 |
|
4 | AYX |
Alteryx, Inc.
Class A Common Stock |
S - Sale | -2,628 | 239,576 | -1.09 | 55.24 | -145,171 | 13,234,178 | |
| 2018-08-30 |
|
4 | AYX |
Alteryx, Inc.
Class A Common Stock |
S - Sale | -3,631 | 331,034 | -1.08 | 55.24 | -200,576 | 18,286,318 | |
| 2018-08-30 |
|
4 | AYX |
Alteryx, Inc.
Class A Common Stock |
S - Sale | -633 | 10,510 | -5.68 | 56.67 | -35,872 | 595,602 | |
| 2018-08-30 |
|
4 | AYX |
Alteryx, Inc.
Class A Common Stock |
S - Sale | -5,619 | 93,404 | -5.67 | 56.67 | -318,429 | 5,293,205 | |
| 2018-08-30 |
|
4 | AYX |
Alteryx, Inc.
Class A Common Stock |
S - Sale | -4,583 | 76,178 | -5.67 | 56.67 | -259,719 | 4,317,007 | |
| 2018-08-30 |
|
4 | AYX |
Alteryx, Inc.
Class A Common Stock |
S - Sale | -17,716 | 294,497 | -5.67 | 56.67 | -1,003,966 | 16,689,145 | |
| 2018-08-30 |
|
4 | AYX |
Alteryx, Inc.
Class A Common Stock |
S - Sale | -292 | 11,143 | -2.55 | 56.22 | -16,416 | 626,459 | |
| 2018-08-30 |
|
4 | AYX |
Alteryx, Inc.
Class A Common Stock |
S - Sale | -2,598 | 99,023 | -2.56 | 56.22 | -146,060 | 5,567,073 | |
| 2018-08-30 |
|
4 | AYX |
Alteryx, Inc.
Class A Common Stock |
S - Sale | -2,119 | 80,761 | -2.56 | 56.22 | -119,130 | 4,540,383 | |
| 2018-08-30 |
|
4 | AYX |
Alteryx, Inc.
Class A Common Stock |
S - Sale | -8,192 | 312,213 | -2.56 | 56.22 | -460,554 | 17,552,615 | |
| 2018-08-30 |
|
4 | AYX |
Alteryx, Inc.
Class A Common Stock |
S - Sale | -6 | 11,435 | -0.05 | 56.65 | -340 | 647,793 | |
| 2018-08-30 |
|
4 | AYX |
Alteryx, Inc.
Class A Common Stock |
S - Sale | -51 | 101,621 | -0.05 | 56.65 | -2,889 | 5,756,830 | |
| 2018-08-30 |
|
4 | AYX |
Alteryx, Inc.
Class A Common Stock |
S - Sale | -41 | 82,880 | -0.05 | 56.65 | -2,323 | 4,695,152 | |
| 2018-08-30 |
|
4 | AYX |
Alteryx, Inc.
Class A Common Stock |
S - Sale | -160 | 320,405 | -0.05 | 56.65 | -9,064 | 18,150,943 | |
| 2018-08-30 |
|
4 | AYX |
Alteryx, Inc.
Class A Common Stock |
S - Sale | -1,196 | 11,441 | -9.46 | 56.11 | -67,108 | 641,955 | |
| 2018-08-30 |
|
4 | AYX |
Alteryx, Inc.
Class A Common Stock |
S - Sale | -10,630 | 101,672 | -9.47 | 56.11 | -596,449 | 5,704,816 | |
| 2018-08-30 |
|
4 | AYX |
Alteryx, Inc.
Class A Common Stock |
S - Sale | -8,669 | 82,921 | -9.47 | 56.11 | -486,418 | 4,652,697 | |
| 2018-08-30 |
|
4 | AYX |
Alteryx, Inc.
Class A Common Stock |
S - Sale | -33,514 | 320,565 | -9.47 | 56.11 | -1,880,471 | 17,986,902 | |
| 2018-08-30 |
|
4 | AYX |
Alteryx, Inc.
Class A Common Stock |
S - Sale | -139 | 12,636 | -1.09 | 55.24 | -7,678 | 698,013 | |
| 2018-08-30 |
|
4 | AYX |
Alteryx, Inc.
Class A Common Stock |
S - Sale | -1,232 | 112,301 | -1.09 | 55.24 | -68,056 | 6,203,507 | |
| 2018-08-30 |
|
4 | AYX |
Alteryx, Inc.
Class A Common Stock |
S - Sale | -1,005 | 91,590 | -1.09 | 55.24 | -55,516 | 5,059,432 | |
| 2018-08-30 |
|
4 | AYX |
Alteryx, Inc.
Class A Common Stock |
S - Sale | -3,884 | 354,078 | -1.09 | 55.24 | -214,552 | 19,559,269 | |
| 2018-08-28 |
|
4 | AYX |
Alteryx, Inc.
Class A Common Stock |
S - Sale | -5 | 12,775 | -0.04 | 57.22 | -286 | 730,986 | |
| 2018-08-28 |
|
4 | AYX |
Alteryx, Inc.
Class A Common Stock |
S - Sale | -40 | 113,533 | -0.04 | 57.22 | -2,289 | 6,496,358 | |
| 2018-08-28 |
|
4 | AYX |
Alteryx, Inc.
Class A Common Stock |
S - Sale | -33 | 92,595 | -0.04 | 57.22 | -1,888 | 5,298,286 | |
| 2018-08-28 |
|
4 | AYX |
Alteryx, Inc.
Class A Common Stock |
S - Sale | -128 | 357,962 | -0.04 | 57.22 | -7,324 | 20,482,586 | |
| 2018-08-28 |
|
4 | AYX |
Alteryx, Inc.
Class A Common Stock |
S - Sale | -500 | 12,780 | -3.77 | 56.36 | -28,180 | 720,281 | |
| 2018-08-28 |
|
4 | AYX |
Alteryx, Inc.
Class A Common Stock |
S - Sale | -4,446 | 113,573 | -3.77 | 56.36 | -250,577 | 6,400,974 | |
| 2018-08-28 |
|
4 | AYX |
Alteryx, Inc.
Class A Common Stock |
S - Sale | -3,626 | 92,628 | -3.77 | 56.36 | -204,361 | 5,220,514 | |
| 2018-08-28 |
|
4 | AYX |
Alteryx, Inc.
Class A Common Stock |
S - Sale | -14,017 | 358,090 | -3.77 | 56.36 | -789,998 | 20,181,952 | |
| 2018-08-28 |
|
4 | AYX |
Alteryx, Inc.
Class A Common Stock |
S - Sale | -268 | 13,280 | -1.98 | 55.96 | -14,997 | 743,149 | |
| 2018-08-28 |
|
4 | AYX |
Alteryx, Inc.
Class A Common Stock |
S - Sale | -2,385 | 118,019 | -1.98 | 55.96 | -133,465 | 6,604,343 | |
| 2018-08-28 |
|
4 | AYX |
Alteryx, Inc.
Class A Common Stock |
S - Sale | -1,945 | 96,254 | -1.98 | 55.96 | -108,842 | 5,386,374 | |
| 2018-08-28 |
|
4 | AYX |
Alteryx, Inc.
Class A Common Stock |
S - Sale | -7,518 | 372,107 | -1.98 | 55.96 | -420,707 | 20,823,108 | |
| 2018-08-28 |
|
4 | AYX |
Alteryx, Inc.
Class A Common Stock |
S - Sale | -1,813 | 13,548 | -11.80 | 56.37 | -102,199 | 763,701 | |
| 2018-08-28 |
|
4 | AYX |
Alteryx, Inc.
Class A Common Stock |
S - Sale | -16,113 | 120,404 | -11.80 | 56.37 | -908,290 | 6,787,173 | |
| 2018-08-28 |
|
4 | AYX |
Alteryx, Inc.
Class A Common Stock |
S - Sale | -13,141 | 98,199 | -11.80 | 56.37 | -740,758 | 5,535,478 | |
| 2018-08-28 |
|
4 | AYX |
Alteryx, Inc.
Class A Common Stock |
S - Sale | -50,802 | 379,625 | -11.80 | 56.37 | -2,863,709 | 21,399,461 | |
| 2018-08-28 |
|
4 | AYX |
Alteryx, Inc.
Class A Common Stock |
S - Sale | -730 | 15,361 | -4.54 | 55.99 | -40,873 | 860,062 | |
| 2018-08-28 |
|
4 | AYX |
Alteryx, Inc.
Class A Common Stock |
S - Sale | -6,485 | 136,517 | -4.53 | 55.99 | -363,095 | 7,643,587 | |
| 2018-08-28 |
|
4 | AYX |
Alteryx, Inc.
Class A Common Stock |
S - Sale | -5,289 | 111,340 | -4.53 | 55.99 | -296,131 | 6,233,927 | |
| 2018-08-28 |
|
4 | AYX |
Alteryx, Inc.
Class A Common Stock |
S - Sale | -20,446 | 430,427 | -4.53 | 55.99 | -1,144,772 | 24,099,608 | |
| 2018-08-28 |
|
4 | AYX |
Alteryx, Inc.
Class A Common Stock |
S - Sale | -86 | 242,204 | -0.04 | 57.22 | -4,921 | 13,858,913 | |
| 2018-08-28 |
|
4 | AYX |
Alteryx, Inc.
Class A Common Stock |
S - Sale | -119 | 334,665 | -0.04 | 57.22 | -6,809 | 19,149,531 | |
| 2018-08-28 |
|
4 | AYX |
Alteryx, Inc.
Class A Common Stock |
S - Sale | -9,485 | 242,290 | -3.77 | 56.36 | -534,575 | 13,655,464 | |
| 2018-08-28 |
|
4 | AYX |
Alteryx, Inc.
Class A Common Stock |
S - Sale | -13,105 | 334,784 | -3.77 | 56.36 | -738,598 | 18,868,426 | |
| 2018-08-28 |
|
4 | AYX |
Alteryx, Inc.
Class A Common Stock |
S - Sale | -5,087 | 251,775 | -1.98 | 55.96 | -284,669 | 14,089,329 | |
| 2018-08-28 |
|
4 | AYX |
Alteryx, Inc.
Class A Common Stock |
S - Sale | -7,029 | 347,889 | -1.98 | 55.96 | -393,343 | 19,467,868 | |
| 2018-08-28 |
|
4 | AYX |
Alteryx, Inc.
Class A Common Stock |
S - Sale | -34,374 | 256,862 | -11.80 | 56.37 | -1,937,662 | 14,479,311 | |
| 2018-08-28 |
|
4 | AYX |
Alteryx, Inc.
Class A Common Stock |
S - Sale | -47,493 | 354,918 | -11.80 | 56.37 | -2,677,180 | 20,006,728 | |
| 2018-08-28 |
|
4 | AYX |
Alteryx, Inc.
Class A Common Stock |
S - Sale | -13,834 | 291,236 | -4.53 | 55.99 | -774,566 | 16,306,304 | |
| 2018-08-28 |
|
4 | AYX |
Alteryx, Inc.
Class A Common Stock |
S - Sale | -19,115 | 402,411 | -4.53 | 55.99 | -1,070,249 | 22,530,992 | |
| 2018-08-24 |
|
4 | AYX |
Alteryx, Inc.
Class A Common Stock |
S - Sale | -1,094 | 16,091 | -6.37 | 55.00 | -60,170 | 885,005 | |
| 2018-08-24 |
|
4 | AYX |
Alteryx, Inc.
Class A Common Stock |
S - Sale | -9,726 | 143,002 | -6.37 | 55.00 | -534,930 | 7,865,110 | |
| 2018-08-24 |
|
4 | AYX |
Alteryx, Inc.
Class A Common Stock |
S - Sale | -7,932 | 116,629 | -6.37 | 55.00 | -436,260 | 6,414,595 | |
| 2018-08-24 |
|
4 | AYX |
Alteryx, Inc.
Class A Common Stock |
S - Sale | -30,663 | 450,873 | -6.37 | 55.00 | -1,686,465 | 24,798,015 | |
| 2018-08-24 |
|
4 | AYX |
Alteryx, Inc.
Class A Common Stock |
S - Sale | -1,049 | 17,185 | -5.75 | 54.66 | -57,338 | 939,332 | |
| 2018-08-24 |
|
4 | AYX |
Alteryx, Inc.
Class A Common Stock |
S - Sale | -9,322 | 152,728 | -5.75 | 54.66 | -509,541 | 8,348,112 | |
| 2018-08-24 |
|
4 | AYX |
Alteryx, Inc.
Class A Common Stock |
S - Sale | -7,602 | 124,561 | -5.75 | 54.66 | -415,525 | 6,808,504 | |
| 2018-08-24 |
|
4 | AYX |
Alteryx, Inc.
Class A Common Stock |
S - Sale | -29,391 | 481,536 | -5.75 | 54.66 | -1,606,512 | 26,320,758 | |
| 2018-08-24 |
|
4 | AYX |
Alteryx, Inc.
Class A Common Stock |
S - Sale | -309 | 18,234 | -1.67 | 54.45 | -16,825 | 992,841 | |
| 2018-08-24 |
|
4 | AYX |
Alteryx, Inc.
Class A Common Stock |
S - Sale | -2,749 | 162,050 | -1.67 | 54.45 | -149,683 | 8,823,622 | |
| 2018-08-24 |
|
4 | AYX |
Alteryx, Inc.
Class A Common Stock |
S - Sale | -2,243 | 132,163 | -1.67 | 54.45 | -122,131 | 7,196,275 | |
| 2018-08-24 |
|
4 | AYX |
Alteryx, Inc.
Class A Common Stock |
S - Sale | -8,669 | 510,927 | -1.67 | 54.45 | -472,027 | 27,819,975 | |
| 2018-08-24 |
|
4 | AYX |
Alteryx, Inc.
Class A Common Stock |
S - Sale | -89 | 18,543 | -0.48 | 53.89 | -4,796 | 999,282 | |
| 2018-08-24 |
|
4 | AYX |
Alteryx, Inc.
Class A Common Stock |
S - Sale | -789 | 164,799 | -0.48 | 53.89 | -42,519 | 8,881,018 | |
| 2018-08-24 |
|
4 | AYX |
Alteryx, Inc.
Class A Common Stock |
S - Sale | -643 | 134,406 | -0.48 | 53.89 | -34,651 | 7,243,139 | |
| 2018-08-24 |
|
4 | AYX |
Alteryx, Inc.
Class A Common Stock |
S - Sale | -2,486 | 519,596 | -0.48 | 53.89 | -133,971 | 28,001,028 | |
| 2018-08-24 |
|
4 | AYX |
Alteryx, Inc.
Class A Common Stock |
S - Sale | -20,747 | 305,070 | -6.37 | 55.00 | -1,141,085 | 16,778,850 | |
| 2018-08-24 |
|
4 | AYX |
Alteryx, Inc.
Class A Common Stock |
S - Sale | -28,667 | 421,526 | -6.37 | 55.00 | -1,576,685 | 23,183,930 | |
| 2018-08-24 |
|
4 | AYX |
Alteryx, Inc.
Class A Common Stock |
S - Sale | -19,887 | 325,817 | -5.75 | 54.66 | -1,087,023 | 17,809,157 | |
| 2018-08-24 |
|
4 | AYX |
Alteryx, Inc.
Class A Common Stock |
S - Sale | -27,478 | 450,193 | -5.75 | 54.66 | -1,501,947 | 24,607,549 | |
| 2018-08-24 |
|
4 | AYX |
Alteryx, Inc.
Class A Common Stock |
S - Sale | -5,866 | 345,704 | -1.67 | 54.45 | -319,404 | 18,823,583 | |
| 2018-08-24 |
|
4 | AYX |
Alteryx, Inc.
Class A Common Stock |
S - Sale | -8,105 | 477,671 | -1.67 | 54.45 | -441,317 | 26,009,186 | |
| 2018-08-24 |
|
4 | AYX |
Alteryx, Inc.
Class A Common Stock |
S - Sale | -1,682 | 351,570 | -0.48 | 53.89 | -90,643 | 18,946,107 | |
| 2018-08-24 |
|
4 | AYX |
Alteryx, Inc.
Class A Common Stock |
S - Sale | -2,324 | 485,776 | -0.48 | 53.89 | -125,240 | 26,178,469 | |
| 2018-08-22 |
|
4 | AYX |
Alteryx, Inc.
Class A Common Stock |
S - Sale | -17 | 18,632 | -0.09 | 55.05 | -936 | 1,025,692 | |
| 2018-08-22 |
|
4 | AYX |
Alteryx, Inc.
Class A Common Stock |
S - Sale | -148 | 165,588 | -0.09 | 55.05 | -8,147 | 9,115,619 | |
| 2018-08-22 |
|
4 | AYX |
Alteryx, Inc.
Class A Common Stock |
S - Sale | -120 | 135,049 | -0.09 | 55.05 | -6,606 | 7,434,447 | |
| 2018-08-22 |
|
4 | AYX |
Alteryx, Inc.
Class A Common Stock |
S - Sale | -465 | 522,082 | -0.09 | 55.05 | -25,598 | 28,740,614 | |
| 2018-08-22 |
|
4 | AYX |
Alteryx, Inc.
Class A Common Stock |
S - Sale | -801 | 18,649 | -4.12 | 54.33 | -43,518 | 1,013,200 | |
| 2018-08-22 |
|
4 | AYX |
Alteryx, Inc.
Class A Common Stock |
S - Sale | -7,120 | 165,736 | -4.12 | 54.33 | -386,830 | 9,004,437 | |
| 2018-08-22 |
|
4 | AYX |
Alteryx, Inc.
Class A Common Stock |
S - Sale | -5,807 | 135,169 | -4.12 | 54.33 | -315,494 | 7,343,732 | |
| 2018-08-22 |
|
4 | AYX |
Alteryx, Inc.
Class A Common Stock |
S - Sale | -22,449 | 522,547 | -4.12 | 54.33 | -1,219,654 | 28,389,979 | |
| 2018-08-22 |
|
4 | AYX |
Alteryx, Inc.
Class A Common Stock |
S - Sale | -619 | 19,450 | -3.08 | 54.99 | -34,039 | 1,069,556 | |
| 2018-08-22 |
|
4 | AYX |
Alteryx, Inc.
Class A Common Stock |
S - Sale | -5,499 | 172,856 | -3.08 | 54.99 | -302,390 | 9,505,351 | |
| 2018-08-22 |
|
4 | AYX |
Alteryx, Inc.
Class A Common Stock |
S - Sale | -4,484 | 140,976 | -3.08 | 54.99 | -246,575 | 7,752,270 | |
| 2018-08-22 |
|
4 | AYX |
Alteryx, Inc.
Class A Common Stock |
S - Sale | -17,336 | 544,996 | -3.08 | 54.99 | -953,307 | 29,969,330 | |
| 2018-08-22 |
|
4 | AYX |
Alteryx, Inc.
Class A Common Stock |
S - Sale | -1,352 | 20,069 | -6.31 | 54.59 | -73,806 | 1,095,567 | |
| 2018-08-22 |
|
4 | AYX |
Alteryx, Inc.
Class A Common Stock |
S - Sale | -12,017 | 178,355 | -6.31 | 54.59 | -656,008 | 9,736,399 | |
| 2018-08-22 |
|
4 | AYX |
Alteryx, Inc.
Class A Common Stock |
S - Sale | -9,801 | 145,460 | -6.31 | 54.59 | -535,037 | 7,940,661 | |
| 2018-08-22 |
|
4 | AYX |
Alteryx, Inc.
Class A Common Stock |
S - Sale | -37,889 | 562,332 | -6.31 | 54.59 | -2,068,361 | 30,697,704 | |
| 2018-08-22 |
|
4 | AYX |
Alteryx, Inc.
Class A Common Stock |
S - Sale | -315 | 353,252 | -0.09 | 55.05 | -17,341 | 19,446,523 | |
| 2018-08-22 |
|
4 | AYX |
Alteryx, Inc.
Class A Common Stock |
S - Sale | -435 | 488,100 | -0.09 | 55.05 | -23,947 | 26,869,905 | |
| 2018-08-22 |
|
4 | AYX |
Alteryx, Inc.
Class A Common Stock |
S - Sale | -15,189 | 353,567 | -4.12 | 54.33 | -825,218 | 19,209,295 | |
| 2018-08-22 |
|
4 | AYX |
Alteryx, Inc.
Class A Common Stock |
S - Sale | -20,988 | 488,535 | -4.12 | 54.33 | -1,140,278 | 26,542,107 | |
| 2018-08-22 |
|
4 | AYX |
Alteryx, Inc.
Class A Common Stock |
S - Sale | -11,730 | 368,756 | -3.08 | 54.99 | -645,033 | 20,277,892 | |
| 2018-08-22 |
|
4 | AYX |
Alteryx, Inc.
Class A Common Stock |
S - Sale | -16,207 | 509,523 | -3.08 | 54.99 | -891,223 | 28,018,670 | |
| 2018-08-22 |
|
4 | AYX |
Alteryx, Inc.
Class A Common Stock |
S - Sale | -25,637 | 380,486 | -6.31 | 54.59 | -1,399,524 | 20,770,731 | |
| 2018-08-22 |
|
4 | AYX |
Alteryx, Inc.
Class A Common Stock |
S - Sale | -35,423 | 525,730 | -6.31 | 54.59 | -1,933,742 | 28,699,601 | |
| 2018-08-20 |
|
4 | AYX |
Alteryx, Inc.
Class A Common Stock |
S - Sale | -360 | 21,421 | -1.65 | 54.51 | -19,624 | 1,167,659 | |
| 2018-08-20 |
|
4 | AYX |
Alteryx, Inc.
Class A Common Stock |
S - Sale | -3,195 | 190,372 | -1.65 | 54.51 | -174,159 | 10,377,178 | |
| 2018-08-20 |
|
4 | AYX |
Alteryx, Inc.
Class A Common Stock |
S - Sale | -2,605 | 155,261 | -1.65 | 54.51 | -141,999 | 8,463,277 | |
| 2018-08-20 |
|
4 | AYX |
Alteryx, Inc.
Class A Common Stock |
S - Sale | -10,073 | 600,221 | -1.65 | 54.51 | -549,079 | 32,718,047 | |
| 2018-08-20 |
|
4 | AYX |
Alteryx, Inc.
Class A Common Stock |
S - Sale | -81 | 21,781 | -0.37 | 54.01 | -4,375 | 1,176,392 | |
| 2018-08-20 |
|
4 | AYX |
Alteryx, Inc.
Class A Common Stock |
S - Sale | -722 | 193,567 | -0.37 | 54.01 | -38,995 | 10,454,554 | |
| 2018-08-20 |
|
4 | AYX |
Alteryx, Inc.
Class A Common Stock |
S - Sale | -589 | 157,866 | -0.37 | 54.01 | -31,812 | 8,526,343 | |
| 2018-08-20 |
|
4 | AYX |
Alteryx, Inc.
Class A Common Stock |
S - Sale | -2,276 | 610,294 | -0.37 | 54.01 | -122,927 | 32,961,979 | |
| 2018-08-20 |
|
4 | AYX |
Alteryx, Inc.
Class A Common Stock |
S - Sale | -432 | 21,682 | -1.95 | 54.60 | -23,587 | 1,183,837 | |
| 2018-08-20 |
|
4 | AYX |
Alteryx, Inc.
Class A Common Stock |
S - Sale | -3,840 | 194,289 | -1.94 | 54.60 | -209,664 | 10,608,179 | |
| 2018-08-20 |
|
4 | AYX |
Alteryx, Inc.
Class A Common Stock |
S - Sale | -3,132 | 158,455 | -1.94 | 54.60 | -171,007 | 8,651,643 | |
| 2018-08-20 |
|
4 | AYX |
Alteryx, Inc.
Class A Common Stock |
S - Sale | -12,107 | 612,570 | -1.94 | 54.60 | -661,042 | 33,446,322 | |
| 2018-08-20 |
|
4 | AYX |
Alteryx, Inc.
Class A Common Stock |
S - Sale | -382 | 22,294 | -1.68 | 54.03 | -20,639 | 1,204,545 | |
| 2018-08-20 |
|
4 | AYX |
Alteryx, Inc.
Class A Common Stock |
S - Sale | -3,394 | 198,129 | -1.68 | 54.03 | -183,378 | 10,704,910 | |
| 2018-08-20 |
|
4 | AYX |
Alteryx, Inc.
Class A Common Stock |
S - Sale | -2,768 | 161,587 | -1.68 | 54.03 | -149,555 | 8,730,546 | |
| 2018-08-20 |
|
4 | AYX |
Alteryx, Inc.
Class A Common Stock |
S - Sale | -10,702 | 624,677 | -1.68 | 54.03 | -578,229 | 33,751,298 | |
| 2018-08-20 |
|
4 | AYX |
Alteryx, Inc.
Class A Common Stock |
S - Sale | -6,815 | 406,123 | -1.65 | 54.51 | -371,486 | 22,137,765 | |
| 2018-08-20 |
|
4 | AYX |
Alteryx, Inc.
Class A Common Stock |
S - Sale | -9,416 | 561,153 | -1.65 | 54.51 | -513,266 | 30,588,450 | |
| 2018-08-20 |
|
4 | AYX |
Alteryx, Inc.
Class A Common Stock |
S - Sale | -1,540 | 412,938 | -0.37 | 54.01 | -83,175 | 22,302,781 | |
| 2018-08-20 |
|
4 | AYX |
Alteryx, Inc.
Class A Common Stock |
S - Sale | -2,128 | 570,569 | -0.37 | 54.01 | -114,933 | 30,816,432 | |
| 2018-08-20 |
|
4 | AYX |
Alteryx, Inc.
Class A Common Stock |
S - Sale | -8,192 | 414,478 | -1.94 | 54.60 | -447,283 | 22,630,499 | |
| 2018-08-20 |
|
4 | AYX |
Alteryx, Inc.
Class A Common Stock |
S - Sale | -11,319 | 572,697 | -1.94 | 54.60 | -618,017 | 31,269,256 | |
| 2018-08-20 |
|
4 | AYX |
Alteryx, Inc.
Class A Common Stock |
S - Sale | -7,241 | 422,670 | -1.68 | 54.03 | -391,231 | 22,836,860 | |
| 2018-08-20 |
|
4 | AYX |
Alteryx, Inc.
Class A Common Stock |
S - Sale | -10,005 | 584,016 | -1.68 | 54.03 | -540,570 | 31,554,384 | |
| 2018-08-16 |
|
4 | AYX |
Alteryx, Inc.
Class A Common Stock |
S - Sale | -4 | 22,676 | -0.02 | 55.11 | -220 | 1,249,674 | |
| 2018-08-16 |
|
4 | AYX |
Alteryx, Inc.
Class A Common Stock |
S - Sale | -39 | 201,523 | -0.02 | 55.11 | -2,149 | 11,105,933 | |
| 2018-08-16 |
|
4 | AYX |
Alteryx, Inc.
Class A Common Stock |
S - Sale | -32 | 164,355 | -0.02 | 55.11 | -1,764 | 9,057,604 | |
| 2018-08-16 |
|
4 | AYX |
Alteryx, Inc.
Class A Common Stock |
S - Sale | -124 | 635,379 | -0.02 | 55.11 | -6,834 | 35,015,737 | |
| 2018-08-16 |
|
4 | AYX |
Alteryx, Inc.
Class A Common Stock |
S - Sale | -30 | 22,680 | -0.13 | 54.40 | -1,632 | 1,233,792 | |
| 2018-08-16 |
|
4 | AYX |
Alteryx, Inc.
Class A Common Stock |
S - Sale | -267 | 201,562 | -0.13 | 54.40 | -14,525 | 10,964,973 | |
| 2018-08-16 |
|
4 | AYX |
Alteryx, Inc.
Class A Common Stock |
S - Sale | -218 | 164,387 | -0.13 | 54.40 | -11,859 | 8,942,653 | |
| 2018-08-16 |
|
4 | AYX |
Alteryx, Inc.
Class A Common Stock |
S - Sale | -843 | 635,503 | -0.13 | 54.40 | -45,859 | 34,571,363 | |
| 2018-08-16 |
|
4 | AYX |
Alteryx, Inc.
Class A Common Stock |
S - Sale | -111 | 22,710 | -0.49 | 53.34 | -5,921 | 1,211,351 | |
| 2018-08-16 |
|
4 | AYX |
Alteryx, Inc.
Class A Common Stock |
S - Sale | -989 | 201,829 | -0.49 | 53.34 | -52,753 | 10,765,559 | |
| 2018-08-16 |
|
4 | AYX |
Alteryx, Inc.
Class A Common Stock |
S - Sale | -806 | 164,605 | -0.49 | 53.34 | -42,992 | 8,780,031 | |
| 2018-08-16 |
|
4 | AYX |
Alteryx, Inc.
Class A Common Stock |
S - Sale | -3,119 | 636,346 | -0.49 | 53.34 | -166,367 | 33,942,696 | |
| 2018-08-16 |
|
4 | AYX |
Alteryx, Inc.
Class A Common Stock |
S - Sale | -1,495 | 22,821 | -6.15 | 55.64 | -83,182 | 1,269,760 | |
| 2018-08-16 |
|
4 | AYX |
Alteryx, Inc.
Class A Common Stock |
S - Sale | -13,285 | 202,818 | -6.15 | 55.64 | -739,177 | 11,284,794 | |
| 2018-08-16 |
|
4 | AYX |
Alteryx, Inc.
Class A Common Stock |
S - Sale | -10,835 | 165,411 | -6.15 | 55.64 | -602,859 | 9,203,468 | |
| 2018-08-16 |
|
4 | AYX |
Alteryx, Inc.
Class A Common Stock |
S - Sale | -41,887 | 639,465 | -6.15 | 55.64 | -2,330,593 | 35,579,833 | |
| 2018-08-16 |
|
4 | AYX |
Alteryx, Inc.
Class A Common Stock |
S - Sale | -4,246 | 24,316 | -14.87 | 55.00 | -233,530 | 1,337,380 | |
| 2018-08-16 |
|
4 | AYX |
Alteryx, Inc.
Class A Common Stock |
S - Sale | -37,736 | 216,103 | -14.87 | 55.00 | -2,075,480 | 11,885,665 | |
| 2018-08-16 |
|
4 | AYX |
Alteryx, Inc.
Class A Common Stock |
S - Sale | -30,775 | 176,246 | -14.87 | 55.00 | -1,692,625 | 9,693,530 | |
| 2018-08-16 |
|
4 | AYX |
Alteryx, Inc.
Class A Common Stock |
S - Sale | -118,975 | 681,352 | -14.87 | 55.00 | -6,543,625 | 37,474,360 | |
| 2018-08-16 |
|
4 | AYX |
Alteryx, Inc.
Class A Common Stock |
S - Sale | -84 | 429,911 | -0.02 | 55.11 | -4,629 | 23,692,395 | |
| 2018-08-16 |
|
4 | AYX |
Alteryx, Inc.
Class A Common Stock |
S - Sale | -116 | 594,021 | -0.02 | 55.11 | -6,393 | 32,736,497 | |
| 2018-08-16 |
|
4 | AYX |
Alteryx, Inc.
Class A Common Stock |
S - Sale | -570 | 429,995 | -0.13 | 54.40 | -31,008 | 23,391,728 | |
| 2018-08-16 |
|
4 | AYX |
Alteryx, Inc.
Class A Common Stock |
S - Sale | -788 | 594,137 | -0.13 | 54.40 | -42,867 | 32,321,053 | |
| 2018-08-16 |
|
4 | AYX |
Alteryx, Inc.
Class A Common Stock |
S - Sale | -2,111 | 430,565 | -0.49 | 53.34 | -112,601 | 22,966,337 | |
| 2018-08-16 |
|
4 | AYX |
Alteryx, Inc.
Class A Common Stock |
S - Sale | -2,916 | 594,925 | -0.49 | 53.34 | -155,539 | 31,733,300 | |
| 2018-08-16 |
|
4 | AYX |
Alteryx, Inc.
Class A Common Stock |
S - Sale | -28,342 | 432,676 | -6.15 | 55.64 | -1,576,949 | 24,074,093 | |
| 2018-08-16 |
|
4 | AYX |
Alteryx, Inc.
Class A Common Stock |
S - Sale | -39,161 | 597,841 | -6.15 | 55.64 | -2,178,918 | 33,263,873 | |
| 2018-08-16 |
|
4 | AYX |
Alteryx, Inc.
Class A Common Stock |
S - Sale | -80,501 | 461,018 | -14.87 | 55.00 | -4,427,555 | 25,355,990 | |
| 2018-08-16 |
|
4 | AYX |
Alteryx, Inc.
Class A Common Stock |
S - Sale | -111,230 | 637,002 | -14.87 | 55.00 | -6,117,650 | 35,035,110 | |
| 2018-08-15 |
|
4 | AYX |
Alteryx, Inc.
Class A Common Stock |
S - Sale | -417,960 | 2,579,500 | -13.94 | 55.72 | -23,288,731 | 143,729,740 | |
| 2018-08-15 |
|
4 | AYX |
Alteryx, Inc.
Class A Common Stock |
S - Sale | -208,980 | 1,289,749 | -13.94 | 55.72 | -11,644,366 | 71,864,814 | |
| 2018-08-15 |
|
4 | AYX |
Alteryx, Inc.
Class A Common Stock |
S - Sale | -208,980 | 1,289,749 | -13.94 | 55.72 | -11,644,366 | 71,864,814 | |
| 2018-08-15 |
|
4 | AYX |
Alteryx, Inc.
Class A Common Stock |
S - Sale | -87,743 | 541,519 | -13.94 | 55.72 | -4,889,040 | 30,173,439 | |
| 2018-08-15 |
|
4 | AYX |
Alteryx, Inc.
Class A Common Stock |
S - Sale | -121,237 | 748,232 | -13.94 | 55.72 | -6,755,326 | 41,691,487 | |
| 2018-08-15 |
|
4 | AYX |
Alteryx, Inc.
Class A Common Stock |
S - Sale | -4,628 | 28,562 | -13.94 | 55.72 | -257,872 | 1,591,475 | |
| 2018-08-15 |
|
4 | AYX |
Alteryx, Inc.
Class A Common Stock |
S - Sale | -41,130 | 253,839 | -13.94 | 55.72 | -2,291,764 | 14,143,909 | |
| 2018-08-15 |
|
4 | AYX |
Alteryx, Inc.
Class A Common Stock |
S - Sale | -33,544 | 207,021 | -13.94 | 55.72 | -1,869,072 | 11,535,210 | |
| 2018-08-15 |
|
4 | AYX |
Alteryx, Inc.
Class A Common Stock |
S - Sale | -129,678 | 800,327 | -13.94 | 55.72 | -7,225,658 | 44,594,220 | |
| 2018-08-15 |
|
4 | AYX |
Alteryx, Inc.
Class A Common Stock |
S - Sale | -177,540 | 2,997,460 | -5.59 | 55.40 | -9,835,716 | 166,059,284 | |
| 2018-08-15 |
|
4 | AYX |
Alteryx, Inc.
Class A Common Stock |
S - Sale | -88,770 | 1,498,729 | -5.59 | 55.40 | -4,917,858 | 83,029,587 | |
| 2018-08-15 |
|
4 | AYX |
Alteryx, Inc.
Class A Common Stock |
S - Sale | -88,770 | 1,498,729 | -5.59 | 55.40 | -4,917,858 | 83,029,587 | |
| 2018-08-15 |
|
4 | AYX |
Alteryx, Inc.
Class A Common Stock |
S - Sale | -37,271 | 629,262 | -5.59 | 55.40 | -2,064,813 | 34,861,115 | |
| 2018-08-15 |
|
4 | AYX |
Alteryx, Inc.
Class A Common Stock |
S - Sale | -51,499 | 869,469 | -5.59 | 55.40 | -2,853,045 | 48,168,583 | |
| 2018-08-15 |
|
4 | AYX |
Alteryx, Inc.
Class A Common Stock |
S - Sale | -1,966 | 33,190 | -5.59 | 55.40 | -108,916 | 1,838,726 | |
| 2018-08-15 |
|
4 | AYX |
Alteryx, Inc.
Class A Common Stock |
S - Sale | -17,471 | 294,969 | -5.59 | 55.40 | -967,893 | 16,341,283 | |
| 2018-08-15 |
|
4 | AYX |
Alteryx, Inc.
Class A Common Stock |
S - Sale | -14,249 | 240,565 | -5.59 | 55.40 | -789,395 | 13,327,301 | |
| 2018-08-15 |
|
4 | AYX |
Alteryx, Inc.
Class A Common Stock |
S - Sale | -55,084 | 930,005 | -5.59 | 55.40 | -3,051,654 | 51,522,277 | |
| 2018-08-15 |
|
4 | AYX |
Alteryx, Inc.
Class B Common Stock |
C - Conversion | -2,500,000 | 10,370,545 | -19.42 | ||||
| 2018-08-15 |
|
4 | AYX |
Alteryx, Inc.
Class B Common Stock |
C - Conversion | -1,249,999 | 5,185,271 | -19.42 | ||||
| 2018-08-15 |
|
4 | AYX |
Alteryx, Inc.
Class B Common Stock |
C - Conversion | -1,249,999 | 5,185,271 | -19.42 | ||||
| 2018-08-15 |
|
4 | AYX |
Alteryx, Inc.
Class B Common Stock |
C - Conversion | -524,829 | 2,177,104 | -19.42 | ||||
| 2018-08-15 |
|
4 | AYX |
Alteryx, Inc.
Class B Common Stock |
C - Conversion | -725,172 | 3,008,170 | -19.42 | ||||
| 2018-08-15 |
|
4 | AYX |
Alteryx, Inc.
Class B Common Stock |
C - Conversion | -27,682 | 114,833 | -19.42 | ||||
| 2018-08-15 |
|
4 | AYX |
Alteryx, Inc.
Class B Common Stock |
C - Conversion | -246,016 | 1,020,527 | -19.42 | ||||
| 2018-08-15 |
|
4 | AYX |
Alteryx, Inc.
Class B Common Stock |
C - Conversion | -200,641 | 832,302 | -19.42 | ||||
| 2018-08-15 |
|
4 | AYX |
Alteryx, Inc.
Class B Common Stock |
C - Conversion | -775,660 | 3,217,609 | -19.42 | ||||
| 2018-08-15 |
|
4 | AYX |
Alteryx, Inc.
Class A Common Stock |
C - Conversion | 2,500,000 | 3,175,000 | 370.37 | ||||
| 2018-08-15 |
|
4 | AYX |
Alteryx, Inc.
Class A Common Stock |
C - Conversion | 1,249,999 | 1,587,499 | 370.37 | ||||
| 2018-08-15 |
|
4 | AYX |
Alteryx, Inc.
Class A Common Stock |
C - Conversion | 1,249,999 | 1,587,499 | 370.37 | ||||
| 2018-08-15 |
|
4 | AYX |
Alteryx, Inc.
Class A Common Stock |
C - Conversion | 524,829 | 666,533 | 370.37 | ||||
| 2018-08-15 |
|
4 | AYX |
Alteryx, Inc.
Class A Common Stock |
C - Conversion | 725,172 | 920,968 | 370.37 | ||||
| 2018-08-15 |
|
4 | AYX |
Alteryx, Inc.
Class A Common Stock |
C - Conversion | 27,682 | 35,156 | 370.38 | ||||
| 2018-08-15 |
|
4 | AYX |
Alteryx, Inc.
Class A Common Stock |
C - Conversion | 246,016 | 312,440 | 370.37 | ||||
| 2018-08-15 |
|
4 | AYX |
Alteryx, Inc.
Class A Common Stock |
C - Conversion | 200,641 | 254,814 | 370.37 | ||||
| 2018-08-15 |
|
4 | AYX |
Alteryx, Inc.
Class A Common Stock |
C - Conversion | 775,660 | 985,089 | 370.37 | ||||
| 2018-07-31 |
|
4 | TENB |
Tenable Holdings, Inc.
Series B Preferred Stock |
C - Conversion | -3,737,080 | 0 | -100.00 | ||||
| 2018-07-31 |
|
4 | TENB |
Tenable Holdings, Inc.
Series B Preferred Stock |
C - Conversion | -3,036,378 | 0 | -100.00 | ||||
| 2018-07-31 |
|
4 | TENB |
Tenable Holdings, Inc.
Series B Preferred Stock |
C - Conversion | -3,302,193 | 0 | -100.00 | ||||
| 2018-07-31 |
|
4 | TENB |
Tenable Holdings, Inc.
Series B Preferred Stock |
C - Conversion | -4,107,504 | 0 | -100.00 | ||||
| 2018-07-31 |
|
4 | TENB |
Tenable Holdings, Inc.
Common Stock |
C - Conversion | 3,737,080 | 3,737,080 | |||||
| 2018-07-31 |
|
4 | TENB |
Tenable Holdings, Inc.
Common Stock |
C - Conversion | 3,036,378 | 3,036,378 | |||||
| 2018-07-31 |
|
4 | TENB |
Tenable Holdings, Inc.
Common Stock |
C - Conversion | 3,302,193 | 3,302,193 | |||||
| 2018-07-31 |
|
4 | TENB |
Tenable Holdings, Inc.
Common Stock |
C - Conversion | 4,107,504 | 4,107,504 | |||||
| 2018-07-31 |
|
4 | TENB |
Tenable Holdings, Inc.
Series B Preferred Stock |
C - Conversion | -174,441 | 0 | -100.00 | ||||
| 2018-07-31 |
|
4 | TENB |
Tenable Holdings, Inc.
Series B Preferred Stock |
C - Conversion | -925,908 | 0 | -100.00 | ||||
| 2018-07-31 |
|
4 | TENB |
Tenable Holdings, Inc.
Series B Preferred Stock |
C - Conversion | -4,342,255 | 0 | -100.00 | ||||
| 2018-07-31 |
|
4 | TENB |
Tenable Holdings, Inc.
Series B Preferred Stock |
C - Conversion | -8,739,118 | 0 | -100.00 | ||||
| 2018-07-31 |
|
4 | TENB |
Tenable Holdings, Inc.
Common Stock |
C - Conversion | 174,441 | 174,441 | |||||
| 2018-07-31 |
|
4 | TENB |
Tenable Holdings, Inc.
Common Stock |
C - Conversion | 925,908 | 925,908 | |||||
| 2018-07-31 |
|
4 | TENB |
Tenable Holdings, Inc.
Common Stock |
C - Conversion | 4,342,255 | 4,342,255 | |||||
| 2018-07-31 |
|
4 | TENB |
Tenable Holdings, Inc.
Common Stock |
C - Conversion | 8,739,118 | 8,739,118 | |||||
| 2018-07-03 |
|
4/A | SMAR |
SMARTSHEET INC
Class B Common Stock |
C - Conversion | 110,616 | 879,649 | 14.38 | ||||
| 2018-07-03 |
|
4/A | SMAR |
SMARTSHEET INC
Class B Common Stock |
C - Conversion | 40,477 | 321,875 | 14.38 | ||||
| 2018-07-03 |
|
4/A | SMAR |
SMARTSHEET INC
Class B Common Stock |
C - Conversion | 943,187 | 7,500,479 | 14.38 | ||||
| 2018-07-03 |
|
4/A | SMAR |
SMARTSHEET INC
Class B Common Stock |
C - Conversion | 769,857 | 6,122,102 | 14.38 | ||||
| 2018-07-03 |
|
4/A | SMAR |
SMARTSHEET INC
Class B Common Stock |
C - Conversion | 1,748,797 | 13,906,902 | 14.38 | ||||
| 2018-07-03 |
|
4/A | SMAR |
SMARTSHEET INC
Series F Preferred Stock |
C - Conversion | -110,616 | 0 | -100.00 | ||||
| 2018-07-03 |
|
4/A | SMAR |
SMARTSHEET INC
Series F Preferred Stock |
C - Conversion | -40,477 | 0 | -100.00 | ||||
| 2018-07-03 |
|
4/A | SMAR |
SMARTSHEET INC
Series F Preferred Stock |
C - Conversion | -943,187 | 0 | -100.00 | ||||
| 2018-07-03 |
|
4/A | SMAR |
SMARTSHEET INC
Series F Preferred Stock |
C - Conversion | -769,857 | 0 | -100.00 | ||||
| 2018-07-03 |
|
4/A | SMAR |
SMARTSHEET INC
Series F Preferred Stock |
C - Conversion | -1,748,797 | 0 | -100.00 | ||||
| 2018-07-03 |
|
4/A | SMAR |
SMARTSHEET INC
Class B Common Stock |
C - Conversion | 60,003 | 879,649 | 7.32 | ||||
| 2018-07-03 |
|
4/A | SMAR |
SMARTSHEET INC
Class B Common Stock |
C - Conversion | 21,957 | 321,875 | 7.32 | ||||
| 2018-07-03 |
|
4/A | SMAR |
SMARTSHEET INC
Class B Common Stock |
C - Conversion | 511,628 | 7,500,479 | 7.32 | ||||
| 2018-07-03 |
|
4/A | SMAR |
SMARTSHEET INC
Class B Common Stock |
C - Conversion | 417,606 | 6,122,102 | 7.32 | ||||
| 2018-07-03 |
|
4/A | SMAR |
SMARTSHEET INC
Class B Common Stock |
C - Conversion | 948,628 | 13,906,902 | 7.32 | ||||
| 2018-07-03 |
|
4/A | SMAR |
SMARTSHEET INC
Class B Common Stock |
C - Conversion | 329,700 | 879,649 | 59.95 | ||||
| 2018-07-03 |
|
4/A | SMAR |
SMARTSHEET INC
Class B Common Stock |
C - Conversion | 120,645 | 321,875 | 59.95 | ||||
| 2018-07-03 |
|
4/A | SMAR |
SMARTSHEET INC
Class B Common Stock |
C - Conversion | 2,811,230 | 7,500,479 | 59.95 | ||||
| 2018-07-03 |
|
4/A | SMAR |
SMARTSHEET INC
Class B Common Stock |
C - Conversion | 2,294,610 | 6,122,102 | 59.95 | ||||
| 2018-07-03 |
|
4/A | SMAR |
SMARTSHEET INC
Class B Common Stock |
C - Conversion | 5,212,395 | 13,906,902 | 59.95 | ||||
| 2018-07-03 |
|
4/A | SMAR |
SMARTSHEET INC
Series E Preferred Stock |
C - Conversion | -60,003 | 0 | -100.00 | ||||
| 2018-07-03 |
|
4/A | SMAR |
SMARTSHEET INC
Series E Preferred Stock |
C - Conversion | -21,957 | 0 | -100.00 | ||||
| 2018-07-03 |
|
4/A | SMAR |
SMARTSHEET INC
Series E Preferred Stock |
C - Conversion | -511,628 | 0 | -100.00 | ||||
| 2018-07-03 |
|
4/A | SMAR |
SMARTSHEET INC
Series E Preferred Stock |
C - Conversion | -417,606 | 0 | -100.00 | ||||
| 2018-07-03 |
|
4/A | SMAR |
SMARTSHEET INC
Series E Preferred Stock |
C - Conversion | -948,628 | 0 | -100.00 | ||||
| 2018-07-03 |
|
4/A | SMAR |
SMARTSHEET INC
Series D Preferred Stock |
C - Conversion | -329,700 | 0 | -100.00 | ||||
| 2018-07-03 |
|
4/A | SMAR |
SMARTSHEET INC
Series D Preferred Stock |
C - Conversion | -120,645 | 0 | -100.00 | ||||
| 2018-07-03 |
|
4/A | SMAR |
SMARTSHEET INC
Series D Preferred Stock |
C - Conversion | -2,811,230 | 0 | -100.00 | ||||
| 2018-07-03 |
|
4/A | SMAR |
SMARTSHEET INC
Series D Preferred Stock |
C - Conversion | -2,294,610 | 0 | -100.00 | ||||
| 2018-07-03 |
|
4/A | SMAR |
SMARTSHEET INC
Series D Preferred Stock |
C - Conversion | -5,212,395 | 0 | -100.00 | ||||
| 2018-07-03 |
|
4/A | SMAR |
SMARTSHEET INC
Class B Common Stock |
C - Conversion | 22,806 | 879,649 | 2.66 | ||||
| 2018-07-03 |
|
4/A | SMAR |
SMARTSHEET INC
Class B Common Stock |
C - Conversion | 8,344 | 321,875 | 2.66 | ||||
| 2018-07-03 |
|
4/A | SMAR |
SMARTSHEET INC
Class B Common Stock |
C - Conversion | 194,453 | 7,500,479 | 2.66 | ||||
| 2018-07-03 |
|
4/A | SMAR |
SMARTSHEET INC
Class B Common Stock |
C - Conversion | 158,715 | 6,122,102 | 2.66 | ||||
| 2018-07-03 |
|
4/A | SMAR |
SMARTSHEET INC
Class B Common Stock |
C - Conversion | 360,537 | 13,906,902 | 2.66 | ||||
| 2018-07-03 |
|
4/A | SMAR |
SMARTSHEET INC
Class B Common Stock |
C - Conversion | 36,877 | 879,649 | 4.38 | ||||
| 2018-07-03 |
|
4/A | SMAR |
SMARTSHEET INC
Class B Common Stock |
C - Conversion | 13,491 | 321,875 | 4.37 | ||||
| 2018-07-03 |
|
4/A | SMAR |
SMARTSHEET INC
Class B Common Stock |
C - Conversion | 314,462 | 7,500,479 | 4.38 | ||||
| 2018-07-03 |
|
4/A | SMAR |
SMARTSHEET INC
Class B Common Stock |
C - Conversion | 256,672 | 6,122,102 | 4.38 | ||||
| 2018-07-03 |
|
4/A | SMAR |
SMARTSHEET INC
Class B Common Stock |
C - Conversion | 583,056 | 13,906,902 | 4.38 | ||||
| 2018-07-03 |
|
4/A | SMAR |
SMARTSHEET INC
Series C Preferred Stock |
C - Conversion | -22,806 | 0 | -100.00 | ||||
| 2018-07-03 |
|
4/A | SMAR |
SMARTSHEET INC
Series C Preferred Stock |
C - Conversion | -8,344 | 0 | -100.00 | ||||
| 2018-07-03 |
|
4/A | SMAR |
SMARTSHEET INC
Series C Preferred Stock |
C - Conversion | -194,453 | 0 | -100.00 | ||||
| 2018-07-03 |
|
4/A | SMAR |
SMARTSHEET INC
Series C Preferred Stock |
C - Conversion | -158,715 | 0 | -100.00 | ||||
| 2018-07-03 |
|
4/A | SMAR |
SMARTSHEET INC
Series C Preferred Stock |
C - Conversion | -360,537 | 0 | -100.00 | ||||
| 2018-07-03 |
|
4/A | SMAR |
SMARTSHEET INC
Series A-4 Preferred Stock |
C - Conversion | -34,483 | 0 | -100.00 | ||||
| 2018-07-03 |
|
4/A | SMAR |
SMARTSHEET INC
Series A-4 Preferred Stock |
C - Conversion | -12,616 | 0 | -100.00 | ||||
| 2018-07-03 |
|
4/A | SMAR |
SMARTSHEET INC
Series A-4 Preferred Stock |
C - Conversion | -294,031 | 0 | -100.00 | ||||
| 2018-07-03 |
|
4/A | SMAR |
SMARTSHEET INC
Series A-4 Preferred Stock |
C - Conversion | -239,996 | 0 | -100.00 | ||||
| 2018-07-03 |
|
4/A | SMAR |
SMARTSHEET INC
Series A-4 Preferred Stock |
C - Conversion | -545,174 | 0 | -100.00 | ||||
| 2018-07-03 |
|
4/A | SMAR |
SMARTSHEET INC
Class B Common Stock |
C - Conversion | 24,889 | 879,649 | 2.91 | ||||
| 2018-07-03 |
|
4/A | SMAR |
SMARTSHEET INC
Class B Common Stock |
C - Conversion | 9,105 | 321,875 | 2.91 | ||||
| 2018-07-03 |
|
4/A | SMAR |
SMARTSHEET INC
Class B Common Stock |
C - Conversion | 212,211 | 7,500,479 | 2.91 | ||||
| 2018-07-03 |
|
4/A | SMAR |
SMARTSHEET INC
Class B Common Stock |
C - Conversion | 173,209 | 6,122,102 | 2.91 | ||||
| 2018-07-03 |
|
4/A | SMAR |
SMARTSHEET INC
Class B Common Stock |
C - Conversion | 393,467 | 13,906,902 | 2.91 | ||||
| 2018-07-03 |
|
4/A | SMAR |
SMARTSHEET INC
Class B Common Stock |
C - Conversion | 51,591 | 879,649 | 6.23 | ||||
| 2018-07-03 |
|
4/A | SMAR |
SMARTSHEET INC
Class B Common Stock |
C - Conversion | 18,876 | 321,875 | 6.23 | ||||
| 2018-07-03 |
|
4/A | SMAR |
SMARTSHEET INC
Class B Common Stock |
C - Conversion | 439,926 | 7,500,479 | 6.23 | ||||
| 2018-07-03 |
|
4/A | SMAR |
SMARTSHEET INC
Class B Common Stock |
C - Conversion | 359,077 | 6,122,102 | 6.23 | ||||
| 2018-07-03 |
|
4/A | SMAR |
SMARTSHEET INC
Class B Common Stock |
C - Conversion | 815,686 | 13,906,902 | 6.23 | ||||
| 2018-07-03 |
|
4/A | SMAR |
SMARTSHEET INC
Series A-3 Preferred Stock |
C - Conversion | -23,581 | 0 | -100.00 | ||||
| 2018-07-03 |
|
4/A | SMAR |
SMARTSHEET INC
Series A-3 Preferred Stock |
C - Conversion | -8,628 | 0 | -100.00 | ||||
| 2018-07-03 |
|
4/A | SMAR |
SMARTSHEET INC
Series A-3 Preferred Stock |
C - Conversion | -201,050 | 0 | -100.00 | ||||
| 2018-07-03 |
|
4/A | SMAR |
SMARTSHEET INC
Series A-3 Preferred Stock |
C - Conversion | -164,100 | 0 | -100.00 | ||||
| 2018-07-03 |
|
4/A | SMAR |
SMARTSHEET INC
Series A-3 Preferred Stock |
C - Conversion | -372,772 | 0 | -100.00 | ||||
| 2018-07-03 |
|
4/A | SMAR |
SMARTSHEET INC
Series A-2 Preferred Stock |
C - Conversion | -50,415 | 0 | -100.00 | ||||
| 2018-07-03 |
|
4/A | SMAR |
SMARTSHEET INC
Series A-2 Preferred Stock |
C - Conversion | -18,446 | 0 | -100.00 | ||||
| 2018-07-03 |
|
4/A | SMAR |
SMARTSHEET INC
Series A-2 Preferred Stock |
C - Conversion | -429,885 | 0 | -100.00 | ||||
| 2018-07-03 |
|
4/A | SMAR |
SMARTSHEET INC
Series A-2 Preferred Stock |
C - Conversion | -350,883 | 0 | -100.00 | ||||
| 2018-07-03 |
|
4/A | SMAR |
SMARTSHEET INC
Series A-2 Preferred Stock |
C - Conversion | -797,068 | 0 | -100.00 | ||||
| 2018-07-03 |
|
4/A | SMAR |
SMARTSHEET INC
Class B Common Stock |
C - Conversion | 6,388 | 879,649 | 0.73 | ||||
| 2018-07-03 |
|
4/A | SMAR |
SMARTSHEET INC
Class B Common Stock |
C - Conversion | 2,338 | 321,875 | 0.73 | ||||
| 2018-07-03 |
|
4/A | SMAR |
SMARTSHEET INC
Class B Common Stock |
C - Conversion | 54,471 | 7,500,479 | 0.73 | ||||
| 2018-07-03 |
|
4/A | SMAR |
SMARTSHEET INC
Class B Common Stock |
C - Conversion | 44,461 | 6,122,102 | 0.73 | ||||
| 2018-07-03 |
|
4/A | SMAR |
SMARTSHEET INC
Class B Common Stock |
C - Conversion | 100,997 | 13,906,902 | 0.73 | ||||
| 2018-07-03 |
|
4/A | SMAR |
SMARTSHEET INC
Class B Common Stock |
C - Conversion | 856 | 879,649 | 0.10 | ||||
| 2018-07-03 |
|
4/A | SMAR |
SMARTSHEET INC
Class B Common Stock |
C - Conversion | 313 | 321,875 | 0.10 | ||||
| 2018-07-03 |
|
4/A | SMAR |
SMARTSHEET INC
Class B Common Stock |
C - Conversion | 7,300 | 7,500,479 | 0.10 | ||||
| 2018-07-03 |
|
4/A | SMAR |
SMARTSHEET INC
Class B Common Stock |
C - Conversion | 5,959 | 6,122,102 | 0.10 | ||||
| 2018-07-03 |
|
4/A | SMAR |
SMARTSHEET INC
Class B Common Stock |
C - Conversion | 13,536 | 13,906,902 | 0.10 | ||||
| 2018-07-03 |
|
4/A | SMAR |
SMARTSHEET INC
Series A-1 Preferred Stock |
C - Conversion | -6,388 | 0 | -100.00 | ||||
| 2018-07-03 |
|
4/A | SMAR |
SMARTSHEET INC
Series A-1 Preferred Stock |
C - Conversion | -2,338 | 0 | -100.00 | ||||
| 2018-07-03 |
|
4/A | SMAR |
SMARTSHEET INC
Series A-1 Preferred Stock |
C - Conversion | -54,471 | 0 | -100.00 | ||||
| 2018-07-03 |
|
4/A | SMAR |
SMARTSHEET INC
Series A-1 Preferred Stock |
C - Conversion | -44,461 | 0 | -100.00 | ||||
| 2018-07-03 |
|
4/A | SMAR |
SMARTSHEET INC
Series A-1 Preferred Stock |
C - Conversion | -100,997 | 0 | -100.00 | ||||
| 2018-07-03 |
|
4/A | SMAR |
SMARTSHEET INC
Series A Preferred Stock |
C - Conversion | -856 | 0 | -100.00 | ||||
| 2018-07-03 |
|
4/A | SMAR |
SMARTSHEET INC
Series A Preferred Stock |
C - Conversion | -313 | 0 | -100.00 | ||||
| 2018-07-03 |
|
4/A | SMAR |
SMARTSHEET INC
Series A Preferred Stock |
C - Conversion | -7,300 | 0 | -100.00 | ||||
| 2018-07-03 |
|
4/A | SMAR |
SMARTSHEET INC
Series A Preferred Stock |
C - Conversion | -5,959 | 0 | -100.00 | ||||
| 2018-07-03 |
|
4/A | SMAR |
SMARTSHEET INC
Series A Preferred Stock |
C - Conversion | -13,536 | 0 | -100.00 | ||||
| 2018-06-11 |
|
4 | TNTR |
Tintri, Inc.
Common Stock |
S - Sale | -16,637 | 923,615 | -1.77 | 6.74 | -112,175 | 6,227,474 | |
| 2018-06-11 |
|
4 | TNTR |
Tintri, Inc.
Common Stock |
S - Sale | -6,158 | 341,839 | -1.77 | 6.74 | -41,520 | 2,304,849 | |
| 2018-06-11 |
|
4 | TNTR |
Tintri, Inc.
Common Stock |
S - Sale | -850 | 47,161 | -1.77 | 6.74 | -5,731 | 317,983 | |
| 2018-06-11 |
|
4 | TNTR |
Tintri, Inc.
Common Stock |
S - Sale | -23,805 | 1,321,519 | -1.77 | 6.74 | -160,505 | 8,910,342 | |
| 2018-06-11 |
|
4 | TNTR |
Tintri, Inc.
Common Stock |
S - Sale | -7,550 | 419,144 | -1.77 | 6.74 | -50,906 | 2,826,078 | |
| 2018-06-11 |
|
4 | TNTR |
Tintri, Inc.
Common Stock |
S - Sale | -315,982 | 940,252 | -25.15 | 6.16 | -1,946,165 | 5,791,106 | |
| 2018-06-11 |
|
4 | TNTR |
Tintri, Inc.
Common Stock |
S - Sale | -116,948 | 347,997 | -25.15 | 6.16 | -720,294 | 2,143,348 | |
| 2018-06-11 |
|
4 | TNTR |
Tintri, Inc.
Common Stock |
S - Sale | -16,135 | 48,011 | -25.15 | 6.16 | -99,377 | 295,705 | |
| 2018-06-11 |
|
4 | TNTR |
Tintri, Inc.
Common Stock |
S - Sale | -452,111 | 1,345,324 | -25.15 | 6.16 | -2,784,597 | 8,285,985 | |
| 2018-06-11 |
|
4 | TNTR |
Tintri, Inc.
Common Stock |
S - Sale | -143,395 | 426,694 | -25.15 | 6.16 | -883,184 | 2,628,051 | |
| 2018-06-11 |
|
4 | TNTR |
Tintri, Inc.
Common Stock |
S - Sale | -136,255 | 1,256,234 | -9.78 | 5.18 | -705,188 | 6,501,639 | |
| 2018-06-11 |
|
4 | TNTR |
Tintri, Inc.
Common Stock |
S - Sale | -50,429 | 464,945 | -9.78 | 5.18 | -260,995 | 2,406,323 | |
| 2018-06-11 |
|
4 | TNTR |
Tintri, Inc.
Common Stock |
S - Sale | -6,957 | 64,146 | -9.78 | 5.18 | -36,006 | 331,988 | |
| 2018-06-11 |
|
4 | TNTR |
Tintri, Inc.
Common Stock |
S - Sale | -194,955 | 1,797,435 | -9.78 | 5.18 | -1,008,990 | 9,302,625 | |
| 2018-06-11 |
|
4 | TNTR |
Tintri, Inc.
Common Stock |
S - Sale | -61,833 | 570,089 | -9.78 | 5.18 | -320,017 | 2,950,496 | |
| 2018-05-17 | 3 | PS |
Pluralsight, Inc.
Class A common stock |
21,496,865 | ||||||||
| 2018-05-17 | 3 | PS |
Pluralsight, Inc.
Class A common stock |
13,980,024 | ||||||||
| 2018-05-17 | 3 | PS |
Pluralsight, Inc.
Class A common stock |
15,397,347 | ||||||||
| 2018-05-17 | 3 | PS |
Pluralsight, Inc.
Class A common stock |
21,496,865 | ||||||||
| 2018-05-17 | 3 | PS |
Pluralsight, Inc.
Class A common stock |
13,980,024 | ||||||||
| 2018-05-17 | 3 | PS |
Pluralsight, Inc.
Class A common stock |
15,397,347 | ||||||||
| 2018-05-17 | 3 | PS |
Pluralsight, Inc.
Class A common stock |
21,496,865 | ||||||||
| 2018-05-17 | 3 | PS |
Pluralsight, Inc.
Class A common stock |
13,980,024 | ||||||||
| 2018-05-17 | 3 | PS |
Pluralsight, Inc.
Class A common stock |
15,397,347 | ||||||||
| 2018-05-17 | 3 | PS |
Pluralsight, Inc.
Class A common stock |
21,496,865 | ||||||||
| 2018-05-17 | 3 | PS |
Pluralsight, Inc.
Class A common stock |
13,980,024 | ||||||||
| 2018-05-17 | 3 | PS |
Pluralsight, Inc.
Class A common stock |
15,397,347 | ||||||||
| 2018-05-17 | 3 | PS |
Pluralsight, Inc.
Class A common stock |
21,496,865 | ||||||||
| 2018-05-17 | 3 | PS |
Pluralsight, Inc.
Class A common stock |
13,980,024 | ||||||||
| 2018-05-17 | 3 | PS |
Pluralsight, Inc.
Class A common stock |
15,397,347 | ||||||||
| 2018-05-17 | 3 | PS |
Pluralsight, Inc.
Class A common stock |
21,496,865 | ||||||||
| 2018-05-17 | 3 | PS |
Pluralsight, Inc.
Class A common stock |
13,980,024 | ||||||||
| 2018-05-17 | 3 | PS |
Pluralsight, Inc.
Class A common stock |
15,397,347 | ||||||||
| 2018-05-17 | 3 | PS |
Pluralsight, Inc.
Class A common stock |
21,496,865 | ||||||||
| 2018-05-17 | 3 | PS |
Pluralsight, Inc.
Class A common stock |
13,980,024 | ||||||||
| 2018-05-17 | 3 | PS |
Pluralsight, Inc.
Class A common stock |
15,397,347 | ||||||||
| 2018-05-17 | 3 | PS |
Pluralsight, Inc.
Class A common stock |
21,496,865 | ||||||||
| 2018-05-17 | 3 | PS |
Pluralsight, Inc.
Class A common stock |
13,980,024 | ||||||||
| 2018-05-17 | 3 | PS |
Pluralsight, Inc.
Class A common stock |
15,397,347 | ||||||||
| 2018-05-17 | 3 | PS |
Pluralsight, Inc.
Class A common stock |
21,496,865 | ||||||||
| 2018-05-17 | 3 | PS |
Pluralsight, Inc.
Class A common stock |
13,980,024 | ||||||||
| 2018-05-17 | 3 | PS |
Pluralsight, Inc.
Class A common stock |
15,397,347 | ||||||||
| 2018-05-17 | 3 | PS |
Pluralsight, Inc.
Class A common stock |
21,496,865 | ||||||||
| 2018-05-17 | 3 | PS |
Pluralsight, Inc.
Class A common stock |
13,980,024 | ||||||||
| 2018-05-17 | 3 | PS |
Pluralsight, Inc.
Class A common stock |
15,397,347 | ||||||||
| 2018-05-03 |
|
4 | SMAR |
SMARTSHEET INC
Class B Common Stock |
C - Conversion | 110,616 | 670,834 | 19.75 | ||||
| 2018-05-03 |
|
4 | SMAR |
SMARTSHEET INC
Class B Common Stock |
C - Conversion | 40,477 | 262,341 | 18.24 | ||||
| 2018-05-03 |
|
4 | SMAR |
SMARTSHEET INC
Class B Common Stock |
C - Conversion | 943,187 | 5,508,363 | 20.66 | ||||
| 2018-05-03 |
|
4 | SMAR |
SMARTSHEET INC
Class B Common Stock |
C - Conversion | 769,857 | 4,493,702 | 20.67 | ||||
| 2018-05-03 |
|
4 | SMAR |
SMARTSHEET INC
Class B Common Stock |
C - Conversion | 1,748,797 | 10,177,099 | 20.75 | ||||
| 2018-05-03 |
|
4 | SMAR |
SMARTSHEET INC
Series F Preferred Stock |
C - Conversion | -110,616 | 0 | -100.00 | ||||
| 2018-05-03 |
|
4 | SMAR |
SMARTSHEET INC
Series F Preferred Stock |
C - Conversion | -40,477 | 0 | -100.00 | ||||
| 2018-05-03 |
|
4 | SMAR |
SMARTSHEET INC
Series F Preferred Stock |
C - Conversion | -943,187 | 0 | -100.00 | ||||
| 2018-05-03 |
|
4 | SMAR |
SMARTSHEET INC
Series F Preferred Stock |
C - Conversion | -769,857 | 0 | -100.00 | ||||
| 2018-05-03 |
|
4 | SMAR |
SMARTSHEET INC
Series F Preferred Stock |
C - Conversion | -1,748,797 | 0 | -100.00 | ||||
| 2018-05-03 |
|
4 | SMAR |
SMARTSHEET INC
Class B Common Stock |
C - Conversion | 60,003 | 670,834 | 9.82 | ||||
| 2018-05-03 |
|
4 | SMAR |
SMARTSHEET INC
Class B Common Stock |
C - Conversion | 21,957 | 262,341 | 9.13 | ||||
| 2018-05-03 |
|
4 | SMAR |
SMARTSHEET INC
Class B Common Stock |
C - Conversion | 511,628 | 5,508,363 | 10.24 | ||||
| 2018-05-03 |
|
4 | SMAR |
SMARTSHEET INC
Class B Common Stock |
C - Conversion | 417,606 | 4,493,702 | 10.25 | ||||
| 2018-05-03 |
|
4 | SMAR |
SMARTSHEET INC
Class B Common Stock |
C - Conversion | 948,628 | 10,177,099 | 10.28 | ||||
| 2018-05-03 |
|
4 | SMAR |
SMARTSHEET INC
Class B Common Stock |
C - Conversion | 329,700 | 670,834 | 96.65 | ||||
| 2018-05-03 |
|
4 | SMAR |
SMARTSHEET INC
Class B Common Stock |
C - Conversion | 120,645 | 262,341 | 85.14 | ||||
| 2018-05-03 |
|
4 | SMAR |
SMARTSHEET INC
Class B Common Stock |
C - Conversion | 2,811,230 | 5,508,363 | 104.23 | ||||
| 2018-05-03 |
|
4 | SMAR |
SMARTSHEET INC
Class B Common Stock |
C - Conversion | 2,294,610 | 4,493,702 | 104.34 | ||||
| 2018-05-03 |
|
4 | SMAR |
SMARTSHEET INC
Class B Common Stock |
C - Conversion | 5,212,395 | 10,177,099 | 104.99 | ||||
| 2018-05-03 |
|
4 | SMAR |
SMARTSHEET INC
Series E Preferred Stock |
C - Conversion | -60,003 | 0 | -100.00 | ||||
| 2018-05-03 |
|
4 | SMAR |
SMARTSHEET INC
Series E Preferred Stock |
C - Conversion | -21,957 | 0 | -100.00 | ||||
| 2018-05-03 |
|
4 | SMAR |
SMARTSHEET INC
Series E Preferred Stock |
C - Conversion | -511,628 | 0 | -100.00 | ||||
| 2018-05-03 |
|
4 | SMAR |
SMARTSHEET INC
Series E Preferred Stock |
C - Conversion | -417,606 | 0 | -100.00 | ||||
| 2018-05-03 |
|
4 | SMAR |
SMARTSHEET INC
Series E Preferred Stock |
C - Conversion | -948,628 | 0 | -100.00 | ||||
| 2018-05-03 |
|
4 | SMAR |
SMARTSHEET INC
Series D Preferred Stock |
C - Conversion | -329,700 | 0 | -100.00 | ||||
| 2018-05-03 |
|
4 | SMAR |
SMARTSHEET INC
Series D Preferred Stock |
C - Conversion | -120,645 | 0 | -100.00 | ||||
| 2018-05-03 |
|
4 | SMAR |
SMARTSHEET INC
Series D Preferred Stock |
C - Conversion | -2,811,230 | 0 | -100.00 | ||||
| 2018-05-03 |
|
4 | SMAR |
SMARTSHEET INC
Series D Preferred Stock |
C - Conversion | -2,294,610 | 0 | -100.00 | ||||
| 2018-05-03 |
|
4 | SMAR |
SMARTSHEET INC
Series D Preferred Stock |
C - Conversion | -5,212,395 | 0 | -100.00 | ||||
| 2018-05-03 |
|
4 | SMAR |
SMARTSHEET INC
Class B Common Stock |
C - Conversion | 22,806 | 670,834 | 3.52 | ||||
| 2018-05-03 |
|
4 | SMAR |
SMARTSHEET INC
Class B Common Stock |
C - Conversion | 8,344 | 262,341 | 3.29 | ||||
| 2018-05-03 |
|
4 | SMAR |
SMARTSHEET INC
Class B Common Stock |
C - Conversion | 194,453 | 5,508,363 | 3.66 | ||||
| 2018-05-03 |
|
4 | SMAR |
SMARTSHEET INC
Class B Common Stock |
C - Conversion | 158,715 | 4,493,702 | 3.66 | ||||
| 2018-05-03 |
|
4 | SMAR |
SMARTSHEET INC
Class B Common Stock |
C - Conversion | 360,537 | 10,177,099 | 3.67 | ||||
| 2018-05-03 |
|
4 | SMAR |
SMARTSHEET INC
Class B Common Stock |
C - Conversion | 36,877 | 670,834 | 5.82 | ||||
| 2018-05-03 |
|
4 | SMAR |
SMARTSHEET INC
Class B Common Stock |
C - Conversion | 13,491 | 262,341 | 5.42 | ||||
| 2018-05-03 |
|
4 | SMAR |
SMARTSHEET INC
Class B Common Stock |
C - Conversion | 314,462 | 5,508,363 | 6.05 | ||||
| 2018-05-03 |
|
4 | SMAR |
SMARTSHEET INC
Class B Common Stock |
C - Conversion | 256,672 | 4,493,702 | 6.06 | ||||
| 2018-05-03 |
|
4 | SMAR |
SMARTSHEET INC
Class B Common Stock |
C - Conversion | 583,056 | 10,177,099 | 6.08 | ||||
| 2018-05-03 |
|
4 | SMAR |
SMARTSHEET INC
Series C Preferred Stock |
C - Conversion | -22,806 | 0 | -100.00 | ||||
| 2018-05-03 |
|
4 | SMAR |
SMARTSHEET INC
Series C Preferred Stock |
C - Conversion | -8,344 | 0 | -100.00 | ||||
| 2018-05-03 |
|
4 | SMAR |
SMARTSHEET INC
Series C Preferred Stock |
C - Conversion | -194,453 | 0 | -100.00 | ||||
| 2018-05-03 |
|
4 | SMAR |
SMARTSHEET INC
Series C Preferred Stock |
C - Conversion | -158,715 | 0 | -100.00 | ||||
| 2018-05-03 |
|
4 | SMAR |
SMARTSHEET INC
Series C Preferred Stock |
C - Conversion | -360,537 | 0 | -100.00 | ||||
| 2018-05-03 |
|
4 | SMAR |
SMARTSHEET INC
Series A-4 Preferred Stock |
C - Conversion | -34,483 | 0 | -100.00 | ||||
| 2018-05-03 |
|
4 | SMAR |
SMARTSHEET INC
Series A-4 Preferred Stock |
C - Conversion | -12,616 | 0 | -100.00 | ||||
| 2018-05-03 |
|
4 | SMAR |
SMARTSHEET INC
Series A-4 Preferred Stock |
C - Conversion | -294,031 | 0 | -100.00 | ||||
| 2018-05-03 |
|
4 | SMAR |
SMARTSHEET INC
Series A-4 Preferred Stock |
C - Conversion | -239,996 | 0 | -100.00 | ||||
| 2018-05-03 |
|
4 | SMAR |
SMARTSHEET INC
Series A-4 Preferred Stock |
C - Conversion | -545,174 | 0 | -100.00 | ||||
| 2018-05-03 |
|
4 | SMAR |
SMARTSHEET INC
Class B Common Stock |
C - Conversion | 24,889 | 670,834 | 3.85 | ||||
| 2018-05-03 |
|
4 | SMAR |
SMARTSHEET INC
Class B Common Stock |
C - Conversion | 9,105 | 262,341 | 3.60 | ||||
| 2018-05-03 |
|
4 | SMAR |
SMARTSHEET INC
Class B Common Stock |
C - Conversion | 212,211 | 5,508,363 | 4.01 | ||||
| 2018-05-03 |
|
4 | SMAR |
SMARTSHEET INC
Class B Common Stock |
C - Conversion | 173,209 | 4,493,702 | 4.01 | ||||
| 2018-05-03 |
|
4 | SMAR |
SMARTSHEET INC
Class B Common Stock |
C - Conversion | 393,467 | 10,177,099 | 4.02 | ||||
| 2018-05-03 |
|
4 | SMAR |
SMARTSHEET INC
Class B Common Stock |
C - Conversion | 51,591 | 670,834 | 8.33 | ||||
| 2018-05-03 |
|
4 | SMAR |
SMARTSHEET INC
Class B Common Stock |
C - Conversion | 18,876 | 262,341 | 7.75 | ||||
| 2018-05-03 |
|
4 | SMAR |
SMARTSHEET INC
Class B Common Stock |
C - Conversion | 439,926 | 5,508,363 | 8.68 | ||||
| 2018-05-03 |
|
4 | SMAR |
SMARTSHEET INC
Class B Common Stock |
C - Conversion | 359,077 | 4,493,702 | 8.68 | ||||
| 2018-05-03 |
|
4 | SMAR |
SMARTSHEET INC
Class B Common Stock |
C - Conversion | 815,686 | 10,177,099 | 8.71 | ||||
| 2018-05-03 |
|
4 | SMAR |
SMARTSHEET INC
Series A-3 Preferred Stock |
C - Conversion | -23,581 | 0 | -100.00 | ||||
| 2018-05-03 |
|
4 | SMAR |
SMARTSHEET INC
Series A-3 Preferred Stock |
C - Conversion | -8,628 | 0 | -100.00 | ||||
| 2018-05-03 |
|
4 | SMAR |
SMARTSHEET INC
Series A-3 Preferred Stock |
C - Conversion | -201,050 | 0 | -100.00 | ||||
| 2018-05-03 |
|
4 | SMAR |
SMARTSHEET INC
Series A-3 Preferred Stock |
C - Conversion | -164,100 | 0 | -100.00 | ||||
| 2018-05-03 |
|
4 | SMAR |
SMARTSHEET INC
Series A-3 Preferred Stock |
C - Conversion | -372,772 | 0 | -100.00 | ||||
| 2018-05-03 |
|
4 | SMAR |
SMARTSHEET INC
Series A-2 Preferred Stock |
C - Conversion | -50,415 | 0 | -100.00 | ||||
| 2018-05-03 |
|
4 | SMAR |
SMARTSHEET INC
Series A-2 Preferred Stock |
C - Conversion | -18,446 | 0 | -100.00 | ||||
| 2018-05-03 |
|
4 | SMAR |
SMARTSHEET INC
Series A-2 Preferred Stock |
C - Conversion | -429,885 | 0 | -100.00 | ||||
| 2018-05-03 |
|
4 | SMAR |
SMARTSHEET INC
Series A-2 Preferred Stock |
C - Conversion | -350,883 | 0 | -100.00 | ||||
| 2018-05-03 |
|
4 | SMAR |
SMARTSHEET INC
Series A-2 Preferred Stock |
C - Conversion | -797,068 | 0 | -100.00 | ||||
| 2018-05-03 |
|
4 | SMAR |
SMARTSHEET INC
Class B Common Stock |
C - Conversion | 6,388 | 670,834 | 0.96 | ||||
| 2018-05-03 |
|
4 | SMAR |
SMARTSHEET INC
Class B Common Stock |
C - Conversion | 2,338 | 262,341 | 0.90 | ||||
| 2018-05-03 |
|
4 | SMAR |
SMARTSHEET INC
Class B Common Stock |
C - Conversion | 54,471 | 5,508,363 | 1.00 | ||||
| 2018-05-03 |
|
4 | SMAR |
SMARTSHEET INC
Class B Common Stock |
C - Conversion | 44,461 | 4,493,702 | 1.00 | ||||
| 2018-05-03 |
|
4 | SMAR |
SMARTSHEET INC
Class B Common Stock |
C - Conversion | 100,997 | 10,177,099 | 1.00 | ||||
| 2018-05-03 |
|
4 | SMAR |
SMARTSHEET INC
Class B Common Stock |
C - Conversion | 856 | 670,834 | 0.13 | ||||
| 2018-05-03 |
|
4 | SMAR |
SMARTSHEET INC
Class B Common Stock |
C - Conversion | 313 | 262,341 | 0.12 | ||||
| 2018-05-03 |
|
4 | SMAR |
SMARTSHEET INC
Class B Common Stock |
C - Conversion | 7,300 | 5,508,363 | 0.13 | ||||
| 2018-05-03 |
|
4 | SMAR |
SMARTSHEET INC
Class B Common Stock |
C - Conversion | 5,959 | 4,493,702 | 0.13 | ||||
| 2018-05-03 |
|
4 | SMAR |
SMARTSHEET INC
Class B Common Stock |
C - Conversion | 13,536 | 10,177,099 | 0.13 | ||||
| 2018-05-03 |
|
4 | SMAR |
SMARTSHEET INC
Series A-1 Preferred Stock |
C - Conversion | -6,388 | 0 | -100.00 | ||||
| 2018-05-03 |
|
4 | SMAR |
SMARTSHEET INC
Series A-1 Preferred Stock |
C - Conversion | -2,338 | 0 | -100.00 | ||||
| 2018-05-03 |
|
4 | SMAR |
SMARTSHEET INC
Series A-1 Preferred Stock |
C - Conversion | -54,471 | 0 | -100.00 | ||||
| 2018-05-03 |
|
4 | SMAR |
SMARTSHEET INC
Series A-1 Preferred Stock |
C - Conversion | -44,461 | 0 | -100.00 | ||||
| 2018-05-03 |
|
4 | SMAR |
SMARTSHEET INC
Series A-1 Preferred Stock |
C - Conversion | -100,997 | 0 | -100.00 | ||||
| 2018-05-03 |
|
4 | SMAR |
SMARTSHEET INC
Series A Preferred Stock |
C - Conversion | -856 | 0 | -100.00 | ||||
| 2018-05-03 |
|
4 | SMAR |
SMARTSHEET INC
Series A Preferred Stock |
C - Conversion | -313 | 0 | -100.00 | ||||
| 2018-05-03 |
|
4 | SMAR |
SMARTSHEET INC
Series A Preferred Stock |
C - Conversion | -7,300 | 0 | -100.00 | ||||
| 2018-05-03 |
|
4 | SMAR |
SMARTSHEET INC
Series A Preferred Stock |
C - Conversion | -5,959 | 0 | -100.00 | ||||
| 2018-05-03 |
|
4 | SMAR |
SMARTSHEET INC
Series A Preferred Stock |
C - Conversion | -13,536 | 0 | -100.00 | ||||
| 2018-05-03 |
|
4 | SMAR |
SMARTSHEET INC
Class A Common Stock |
J - Other | 10,000 | 10,000 | |||||
| 2018-04-26 | 3 | SMAR |
SMARTSHEET INC
Class A common stock |
11,435,505 | ||||||||
| 2018-04-26 | 3 | SMAR |
SMARTSHEET INC
Class A common stock |
9,347,638 | ||||||||
| 2018-04-26 | 3 | SMAR |
SMARTSHEET INC
Class A common stock |
9,717,413 | ||||||||
| 2018-04-26 | 3 | SMAR |
SMARTSHEET INC
Class A common stock |
7,792,031 | ||||||||
| 2018-04-26 | 3 | SMAR |
SMARTSHEET INC
Class A common stock |
7,941,625 | ||||||||
| 2018-04-26 | 3 | SMAR |
SMARTSHEET INC
Class A common stock |
11,435,505 | ||||||||
| 2018-04-26 | 3 | SMAR |
SMARTSHEET INC
Class A common stock |
9,347,638 | ||||||||
| 2018-04-26 | 3 | SMAR |
SMARTSHEET INC
Class A common stock |
9,717,413 | ||||||||
| 2018-04-26 | 3 | SMAR |
SMARTSHEET INC
Class A common stock |
7,792,031 | ||||||||
| 2018-04-26 | 3 | SMAR |
SMARTSHEET INC
Class A common stock |
7,941,625 | ||||||||
| 2018-04-02 | 3 | MIME |
Mimecast Ltd
Ordinary Shares |
13,124,705 | ||||||||
| 2018-04-02 | 3 | MIME |
Mimecast Ltd
Ordinary Shares |
11,100,012 | ||||||||
| 2018-04-02 | 3 | MIME |
Mimecast Ltd
Ordinary Shares |
9,736,535 | ||||||||
| 2018-04-02 | 3 | MIME |
Mimecast Ltd
Ordinary Shares |
9,591,469 | ||||||||
| 2018-04-02 | 3 | MIME |
Mimecast Ltd
Ordinary Shares |
13,493,791 | ||||||||
| 2018-04-02 | 3 | MIME |
Mimecast Ltd
Ordinary Shares |
13,124,705 | ||||||||
| 2018-04-02 | 3 | MIME |
Mimecast Ltd
Ordinary Shares |
11,100,012 | ||||||||
| 2018-04-02 | 3 | MIME |
Mimecast Ltd
Ordinary Shares |
9,736,535 | ||||||||
| 2018-04-02 | 3 | MIME |
Mimecast Ltd
Ordinary Shares |
9,591,469 | ||||||||
| 2018-04-02 | 3 | MIME |
Mimecast Ltd
Ordinary Shares |
13,493,791 | ||||||||
| 2018-03-09 |
|
4 | TNTR |
Tintri, Inc.
Common Stock |
S - Sale | -38,481 | 1,392,487 | -2.69 | 6.37 | -244,959 | 8,864,154 | |
| 2018-03-09 |
|
4 | TNTR |
Tintri, Inc.
Common Stock |
S - Sale | -14,242 | 523,709 | -2.65 | 6.37 | -90,660 | 3,333,774 | |
| 2018-03-09 |
|
4 | TNTR |
Tintri, Inc.
Common Stock |
S - Sale | -1,965 | 35,057 | -5.31 | 6.37 | -12,509 | 223,162 | |
| 2018-03-09 |
|
4 | TNTR |
Tintri, Inc.
Common Stock |
S - Sale | -55,059 | 1,992,390 | -2.69 | 6.37 | -350,489 | 12,682,957 | |
| 2018-03-09 |
|
4 | TNTR |
Tintri, Inc.
Common Stock |
S - Sale | -17,463 | 557,411 | -3.04 | 6.37 | -111,164 | 3,548,311 | |
| 2018-03-09 |
|
4 | TNTR |
Tintri, Inc.
Common Stock |
S - Sale | -77,013 | 1,430,968 | -5.11 | 5.52 | -424,765 | 7,892,504 | |
| 2018-03-09 |
|
4 | TNTR |
Tintri, Inc.
Common Stock |
S - Sale | -28,503 | 537,951 | -5.03 | 5.52 | -157,208 | 2,967,069 | |
| 2018-03-09 |
|
4 | TNTR |
Tintri, Inc.
Common Stock |
S - Sale | -3,932 | 37,022 | -9.60 | 5.52 | -21,687 | 204,195 | |
| 2018-03-09 |
|
4 | TNTR |
Tintri, Inc.
Common Stock |
S - Sale | 110,191 | 2,047,449 | 5.69 | 5.52 | 607,758 | 11,292,705 | |
| 2018-03-09 |
|
4 | TNTR |
Tintri, Inc.
Common Stock |
S - Sale | -34,949 | 574,874 | -5.73 | 5.52 | -192,761 | 3,170,718 | |
| 2018-03-09 |
|
4 | TNTR |
Tintri, Inc.
Common Stock |
S - Sale | -39,796 | 1,507,981 | -2.57 | 5.17 | -205,936 | 7,803,500 | |
| 2018-03-09 |
|
4 | TNTR |
Tintri, Inc.
Common Stock |
S - Sale | -14,729 | 566,454 | -2.53 | 5.17 | -76,220 | 2,931,286 | |
| 2018-03-09 |
|
4 | TNTR |
Tintri, Inc.
Common Stock |
S - Sale | -2,032 | 40,954 | -4.73 | 5.17 | -10,515 | 211,929 | |
| 2018-03-09 |
|
4 | TNTR |
Tintri, Inc.
Common Stock |
S - Sale | -56,940 | 2,157,640 | -2.57 | 5.17 | -294,653 | 11,165,355 | |
| 2018-03-09 |
|
4 | TNTR |
Tintri, Inc.
Common Stock |
S - Sale | -18,060 | 609,823 | -2.88 | 5.17 | -93,457 | 3,155,712 | |
| 2018-03-09 |
|
4 | TNTR |
Tintri, Inc.
Common Stock |
S - Sale | -39,954 | 1,547,777 | -2.52 | 5.15 | -205,875 | 7,975,385 | |
| 2018-03-09 |
|
4 | TNTR |
Tintri, Inc.
Common Stock |
S - Sale | -14,787 | 581,183 | -2.48 | 5.15 | -76,194 | 2,994,720 | |
| 2018-03-09 |
|
4 | TNTR |
Tintri, Inc.
Common Stock |
S - Sale | -2,040 | 42,986 | -4.53 | 5.15 | -10,512 | 221,498 | |
| 2018-03-09 |
|
4 | TNTR |
Tintri, Inc.
Common Stock |
S - Sale | -57,166 | 2,214,580 | -2.52 | 5.15 | -294,565 | 11,411,288 | |
| 2018-03-09 |
|
4 | TNTR |
Tintri, Inc.
Common Stock |
S - Sale | -18,131 | 627,883 | -2.81 | 5.15 | -93,425 | 3,235,356 | |
| 2018-03-08 |
|
4 | TNTR |
Tintri, Inc.
Common Stock |
S - Sale | -30 | 1,587,731 | 0.00 | 5.81 | -174 | 9,224,717 | |
| 2018-03-08 |
|
4 | TNTR |
Tintri, Inc.
Common Stock |
S - Sale | -11 | 587,635 | 0.00 | 5.81 | -64 | 3,414,159 | |
| 2018-03-08 |
|
4 | TNTR |
Tintri, Inc.
Common Stock |
S - Sale | -2 | 81,073 | 0.00 | 5.81 | -12 | 471,034 | |
| 2018-03-08 |
|
4 | TNTR |
Tintri, Inc.
Common Stock |
S - Sale | -43 | 2,271,746 | 0.00 | 5.81 | -250 | 13,198,844 | |
| 2018-03-08 |
|
4 | TNTR |
Tintri, Inc.
Common Stock |
S - Sale | -14 | 720,524 | 0.00 | 5.81 | -81 | 4,186,244 | |
| 2018-03-08 |
|
4 | TNTR |
Tintri, Inc.
Common Stock |
S - Sale | -26,095 | 1,587,762 | -1.62 | 5.13 | -133,906 | 8,147,601 | |
| 2018-03-08 |
|
4 | TNTR |
Tintri, Inc.
Common Stock |
S - Sale | -9,658 | 587,646 | -1.62 | 5.13 | -49,560 | 3,015,505 | |
| 2018-03-08 |
|
4 | TNTR |
Tintri, Inc.
Common Stock |
S - Sale | -1,332 | 81,075 | -1.62 | 5.13 | -6,835 | 416,036 | |
| 2018-03-08 |
|
4 | TNTR |
Tintri, Inc.
Common Stock |
S - Sale | -37,338 | 2,271,789 | -1.62 | 5.13 | -191,600 | 11,657,685 | |
| 2018-03-08 |
|
4 | TNTR |
Tintri, Inc.
Common Stock |
S - Sale | -11,842 | 720,538 | -1.62 | 5.13 | -60,767 | 3,697,441 | |
| 2017-07-10 |
|
4 | TNTR |
Tintri, Inc.
Series E Preferred |
C - Conversion | -567,663 | 0 | -100.00 | ||||
| 2017-07-10 |
|
4 | TNTR |
Tintri, Inc.
Series E Preferred |
C - Conversion | -454,132 | 0 | -100.00 | ||||
| 2017-07-10 |
|
4 | TNTR |
Tintri, Inc.
Series E Preferred |
C - Conversion | -454,132 | 0 | -100.00 | ||||
| 2017-07-10 |
|
4 | TNTR |
Tintri, Inc.
Series E Preferred |
C - Conversion | -454,132 | 0 | -100.00 | ||||
| 2017-07-10 |
|
4 | TNTR |
Tintri, Inc.
Series E Preferred |
C - Conversion | -113,531 | 0 | -100.00 | ||||
| 2017-07-10 |
|
4 | TNTR |
Tintri, Inc.
Series E Preferred |
C - Conversion | -113,531 | 0 | -100.00 | ||||
| 2017-07-10 |
|
4 | TNTR |
Tintri, Inc.
Series E Preferred |
C - Conversion | -22,344 | 0 | -100.00 | ||||
| 2017-07-10 |
|
4 | TNTR |
Tintri, Inc.
Series E Preferred |
C - Conversion | -2,514 | 0 | -100.00 | ||||
| 2017-07-10 |
|
4 | TNTR |
Tintri, Inc.
Series E Preferred |
C - Conversion | -18,223 | 0 | -100.00 | ||||
| 2017-07-10 |
|
4 | TNTR |
Tintri, Inc.
Series E Preferred |
C - Conversion | -70,450 | 0 | -100.00 | ||||
| 2017-07-10 |
|
4 | TNTR |
Tintri, Inc.
Common Stock |
P - Purchase | 831,285 | 5,335,075 | 18.46 | 7.00 | 5,818,995 | 37,345,525 | |
| 2017-07-10 |
|
4 | TNTR |
Tintri, Inc.
Common Stock |
P - Purchase | 251,463 | 1,613,857 | 18.46 | 7.00 | 1,760,241 | 11,296,999 | |
| 2017-07-10 |
|
4 | TNTR |
Tintri, Inc.
Common Stock |
P - Purchase | 251,463 | 1,613,857 | 18.46 | 7.00 | 1,760,241 | 11,296,999 | |
| 2017-07-10 |
|
4 | TNTR |
Tintri, Inc.
Common Stock |
P - Purchase | 251,463 | 1,613,857 | 18.46 | 7.00 | 1,760,241 | 11,296,999 | |
| 2017-07-10 |
|
4 | TNTR |
Tintri, Inc.
Common Stock |
P - Purchase | 579,822 | 3,721,218 | 18.46 | 7.00 | 4,058,754 | 26,048,526 | |
| 2017-07-10 |
|
4 | TNTR |
Tintri, Inc.
Common Stock |
P - Purchase | 579,822 | 3,721,218 | 18.46 | 7.00 | 4,058,754 | 26,048,526 | |
| 2017-07-10 |
|
4 | TNTR |
Tintri, Inc.
Common Stock |
P - Purchase | 114,116 | 732,380 | 18.46 | 7.00 | 798,812 | 5,126,660 | |
| 2017-07-10 |
|
4 | TNTR |
Tintri, Inc.
Common Stock |
P - Purchase | 12,840 | 82,407 | 18.46 | 7.00 | 89,880 | 576,849 | |
| 2017-07-10 |
|
4 | TNTR |
Tintri, Inc.
Common Stock |
P - Purchase | 93,069 | 597,304 | 18.46 | 7.00 | 651,483 | 4,181,128 | |
| 2017-07-10 |
|
4 | TNTR |
Tintri, Inc.
Common Stock |
P - Purchase | 359,797 | 2,309,127 | 18.46 | 7.00 | 2,518,579 | 16,163,889 | |
| 2017-07-10 |
|
4 | TNTR |
Tintri, Inc.
Series E Preferred |
C - Conversion | -919,998 | 0 | -100.00 | ||||
| 2017-07-10 |
|
4 | TNTR |
Tintri, Inc.
Series E Preferred |
C - Conversion | -919,998 | 0 | -100.00 | ||||
| 2017-07-10 |
|
4 | TNTR |
Tintri, Inc.
Series E Preferred |
C - Conversion | -919,998 | 0 | -100.00 | ||||
| 2017-07-10 |
|
4 | TNTR |
Tintri, Inc.
Series E Preferred |
C - Conversion | -181,067 | 0 | -100.00 | ||||
| 2017-07-10 |
|
4 | TNTR |
Tintri, Inc.
Series E Preferred |
C - Conversion | -20,374 | 0 | -100.00 | ||||
| 2017-07-10 |
|
4 | TNTR |
Tintri, Inc.
Series E Preferred |
C - Conversion | -147,672 | 0 | -100.00 | ||||
| 2017-07-10 |
|
4 | TNTR |
Tintri, Inc.
Series E Preferred |
C - Conversion | -570,885 | 0 | -100.00 | ||||
| 2017-07-10 |
|
4 | TNTR |
Tintri, Inc.
Common Stock |
C - Conversion | 2,759,994 | 2,800,807 | 6,762.54 | ||||
| 2017-07-10 |
|
4 | TNTR |
Tintri, Inc.
Common Stock |
C - Conversion | 2,759,994 | 2,800,807 | 6,762.54 | ||||
| 2017-07-10 |
|
4 | TNTR |
Tintri, Inc.
Common Stock |
C - Conversion | 2,759,994 | 2,800,807 | 6,762.54 | ||||
| 2017-07-10 |
|
4 | TNTR |
Tintri, Inc.
Common Stock |
C - Conversion | 543,201 | 551,233 | 6,762.96 | ||||
| 2017-07-10 |
|
4 | TNTR |
Tintri, Inc.
Common Stock |
C - Conversion | 61,122 | 62,026 | 6,761.28 | ||||
| 2017-07-10 |
|
4 | TNTR |
Tintri, Inc.
Common Stock |
C - Conversion | 443,016 | 449,567 | 6,762.57 | ||||
| 2017-07-10 |
|
4 | TNTR |
Tintri, Inc.
Common Stock |
C - Conversion | 1,712,655 | 1,737,981 | 6,762.44 | ||||
| 2017-07-10 |
|
4 | TNTR |
Tintri, Inc.
Series F Preferred |
C - Conversion | -567,663 | 0 | -100.00 | ||||
| 2017-07-10 |
|
4 | TNTR |
Tintri, Inc.
Series F Preferred |
C - Conversion | -454,132 | 0 | -100.00 | ||||
| 2017-07-10 |
|
4 | TNTR |
Tintri, Inc.
Series F Preferred |
C - Conversion | -454,132 | 0 | -100.00 | ||||
| 2017-07-10 |
|
4 | TNTR |
Tintri, Inc.
Series F Preferred |
C - Conversion | -454,132 | 0 | -100.00 | ||||
| 2017-07-10 |
|
4 | TNTR |
Tintri, Inc.
Series F Preferred |
C - Conversion | -113,531 | 0 | -100.00 | ||||
| 2017-07-10 |
|
4 | TNTR |
Tintri, Inc.
Series F Preferred |
C - Conversion | -113,531 | 0 | -100.00 | ||||
| 2017-07-10 |
|
4 | TNTR |
Tintri, Inc.
Series F Preferred |
C - Conversion | -22,344 | 0 | -100.00 | ||||
| 2017-07-10 |
|
4 | TNTR |
Tintri, Inc.
Series F Preferred |
C - Conversion | -2,514 | 0 | -100.00 | ||||
| 2017-07-10 |
|
4 | TNTR |
Tintri, Inc.
Series F Preferred |
C - Conversion | -18,223 | 0 | -100.00 | ||||
| 2017-07-10 |
|
4 | TNTR |
Tintri, Inc.
Series F Preferred |
C - Conversion | -70,450 | 0 | -100.00 | ||||
| 2017-07-10 |
|
4 | TNTR |
Tintri, Inc.
Common Stock |
C - Conversion | 1,702,983 | 4,503,790 | 60.80 | ||||
| 2017-07-10 |
|
4 | TNTR |
Tintri, Inc.
Common Stock |
C - Conversion | 1,362,394 | 1,362,394 | |||||
| 2017-07-10 |
|
4 | TNTR |
Tintri, Inc.
Common Stock |
C - Conversion | 1,362,394 | 1,362,394 | |||||
| 2017-07-10 |
|
4 | TNTR |
Tintri, Inc.
Common Stock |
C - Conversion | 1,362,394 | 1,362,394 | |||||
| 2017-07-10 |
|
4 | TNTR |
Tintri, Inc.
Common Stock |
C - Conversion | 340,589 | 3,141,396 | 12.16 | ||||
| 2017-07-10 |
|
4 | TNTR |
Tintri, Inc.
Common Stock |
C - Conversion | 340,589 | 3,141,396 | 12.16 | ||||
| 2017-07-10 |
|
4 | TNTR |
Tintri, Inc.
Common Stock |
C - Conversion | 67,031 | 618,264 | 12.16 | ||||
| 2017-07-10 |
|
4 | TNTR |
Tintri, Inc.
Common Stock |
C - Conversion | 7,541 | 69,567 | 12.16 | ||||
| 2017-07-10 |
|
4 | TNTR |
Tintri, Inc.
Common Stock |
C - Conversion | 54,668 | 504,235 | 12.16 | ||||
| 2017-07-10 |
|
4 | TNTR |
Tintri, Inc.
Common Stock |
C - Conversion | 211,349 | 1,949,330 | 12.16 | ||||
| 2017-06-29 | 3 | TNTR |
Tintri, Inc.
Common Stock |
188,578 | ||||||||
| 2017-06-29 | 3 | TNTR |
Tintri, Inc.
Common Stock |
169,803 | ||||||||
| 2017-06-29 | 3 | TNTR |
Tintri, Inc.
Common Stock |
164,156 | ||||||||
| 2017-06-29 | 3 | TNTR |
Tintri, Inc.
Common Stock |
171,284 | ||||||||
| 2017-06-29 | 3 | TNTR |
Tintri, Inc.
Common Stock |
204,065 | ||||||||
| 2017-06-29 | 3 | TNTR |
Tintri, Inc.
Common Stock |
204,065 | ||||||||
| 2017-06-29 | 3 | TNTR |
Tintri, Inc.
Common Stock |
204,065 | ||||||||
| 2017-06-29 | 3 | TNTR |
Tintri, Inc.
Common Stock |
188,578 | ||||||||
| 2017-06-29 | 3 | TNTR |
Tintri, Inc.
Common Stock |
169,803 | ||||||||
| 2017-06-29 | 3 | TNTR |
Tintri, Inc.
Common Stock |
164,156 | ||||||||
| 2017-06-29 | 3 | TNTR |
Tintri, Inc.
Common Stock |
171,284 | ||||||||
| 2017-06-29 | 3 | TNTR |
Tintri, Inc.
Common Stock |
204,065 | ||||||||
| 2017-06-29 | 3 | TNTR |
Tintri, Inc.
Common Stock |
204,065 | ||||||||
| 2017-06-29 | 3 | TNTR |
Tintri, Inc.
Common Stock |
204,065 | ||||||||
| 2017-04-20 |
|
4 | YEXT |
Yext, Inc.
Series F Preferred Stock |
C - Conversion | -4,342,740 | 0 | -100.00 | ||||
| 2017-04-20 |
|
4 | YEXT |
Yext, Inc.
Series F Preferred Stock |
C - Conversion | -4,342,740 | 0 | -100.00 | ||||
| 2017-04-20 |
|
4 | YEXT |
Yext, Inc.
Series F Preferred Stock |
C - Conversion | -4,342,740 | 0 | -100.00 | ||||
| 2017-04-20 |
|
4 | YEXT |
Yext, Inc.
Series F Preferred Stock |
C - Conversion | -96,174 | 0 | -100.00 | ||||
| 2017-04-20 |
|
4 | YEXT |
Yext, Inc.
Series F Preferred Stock |
C - Conversion | -854,708 | 0 | -100.00 | ||||
| 2017-04-20 |
|
4 | YEXT |
Yext, Inc.
Series F Preferred Stock |
C - Conversion | -697,066 | 0 | -100.00 | ||||
| 2017-04-20 |
|
4 | YEXT |
Yext, Inc.
Series F Preferred Stock |
C - Conversion | -2,694,792 | 0 | -100.00 | ||||
| 2017-04-20 |
|
4 | YEXT |
Yext, Inc.
Common Stock |
C - Conversion | 4,342,740 | 7,710,621 | 128.95 | ||||
| 2017-04-20 |
|
4 | YEXT |
Yext, Inc.
Common Stock |
C - Conversion | 4,342,740 | 7,710,621 | 128.95 | ||||
| 2017-04-20 |
|
4 | YEXT |
Yext, Inc.
Common Stock |
C - Conversion | 4,342,740 | 7,710,621 | 128.95 | ||||
| 2017-04-20 |
|
4 | YEXT |
Yext, Inc.
Common Stock |
C - Conversion | 96,174 | 170,760 | 128.94 | ||||
| 2017-04-20 |
|
4 | YEXT |
Yext, Inc.
Common Stock |
C - Conversion | 854,708 | 1,517,551 | 128.95 | ||||
| 2017-04-20 |
|
4 | YEXT |
Yext, Inc.
Common Stock |
C - Conversion | 697,066 | 1,237,656 | 128.95 | ||||
| 2017-04-20 |
|
4 | YEXT |
Yext, Inc.
Common Stock |
C - Conversion | 2,694,792 | 4,784,654 | 128.95 | ||||
| 2017-04-12 | 3 | YEXT |
Yext, Inc.
Common Stock |
15,561,386 | ||||||||
| 2017-04-12 | 3 | YEXT |
Yext, Inc.
Common Stock |
14,012,114 | ||||||||
| 2017-04-12 | 3 | YEXT |
Yext, Inc.
Common Stock |
14,134,367 | ||||||||
| 2017-04-12 | 3 | YEXT |
Yext, Inc.
Common Stock |
13,546,110 | ||||||||
| 2017-04-12 | 3 | YEXT |
Yext, Inc.
Common Stock |
16,839,405 | ||||||||
| 2017-04-12 | 3 | YEXT |
Yext, Inc.
Common Stock |
16,839,405 | ||||||||
| 2017-04-12 | 3 | YEXT |
Yext, Inc.
Common Stock |
16,839,405 | ||||||||
| 2017-04-12 | 3 | YEXT |
Yext, Inc.
Common Stock |
15,561,386 | ||||||||
| 2017-04-12 | 3 | YEXT |
Yext, Inc.
Common Stock |
14,012,114 | ||||||||
| 2017-04-12 | 3 | YEXT |
Yext, Inc.
Common Stock |
14,134,367 | ||||||||
| 2017-04-12 | 3 | YEXT |
Yext, Inc.
Common Stock |
13,546,110 | ||||||||
| 2017-04-12 | 3 | YEXT |
Yext, Inc.
Common Stock |
16,839,405 | ||||||||
| 2017-04-12 | 3 | YEXT |
Yext, Inc.
Common Stock |
16,839,405 | ||||||||
| 2017-04-12 | 3 | YEXT |
Yext, Inc.
Common Stock |
16,839,405 | ||||||||
| 2017-03-29 |
|
4 | AYX |
Alteryx, Inc.
Class B Common Stock |
C - Conversion | 4,048,821 | 12,870,545 | 45.90 | ||||
| 2017-03-29 |
|
4 | AYX |
Alteryx, Inc.
Class B Common Stock |
C - Conversion | 2,024,410 | 6,435,270 | 45.90 | ||||
| 2017-03-29 |
|
4 | AYX |
Alteryx, Inc.
Class B Common Stock |
C - Conversion | 2,024,410 | 6,435,270 | 45.90 | ||||
| 2017-03-29 |
|
4 | AYX |
Alteryx, Inc.
Class B Common Stock |
C - Conversion | 849,974 | 2,701,933 | 45.90 | ||||
| 2017-03-29 |
|
4 | AYX |
Alteryx, Inc.
Class B Common Stock |
C - Conversion | 1,174,437 | 3,733,342 | 45.90 | ||||
| 2017-03-29 |
|
4 | AYX |
Alteryx, Inc.
Class B Common Stock |
C - Conversion | 44,833 | 142,515 | 45.90 | ||||
| 2017-03-29 |
|
4 | AYX |
Alteryx, Inc.
Class B Common Stock |
C - Conversion | 398,429 | 1,266,543 | 45.90 | ||||
| 2017-03-29 |
|
4 | AYX |
Alteryx, Inc.
Class B Common Stock |
C - Conversion | 324,944 | 1,032,943 | 45.90 | ||||
| 2017-03-29 |
|
4 | AYX |
Alteryx, Inc.
Class B Common Stock |
C - Conversion | 1,256,204 | 3,993,269 | 45.90 | ||||
| 2017-03-29 |
|
4 | AYX |
Alteryx, Inc.
Series C Preferred Stock |
C - Conversion | -1,829,732 | 0 | -100.00 | ||||
| 2017-03-29 |
|
4 | AYX |
Alteryx, Inc.
Series C Preferred Stock |
C - Conversion | -914,866 | 0 | -100.00 | ||||
| 2017-03-29 |
|
4 | AYX |
Alteryx, Inc.
Series C Preferred Stock |
C - Conversion | -914,866 | 0 | -100.00 | ||||
| 2017-03-29 |
|
4 | AYX |
Alteryx, Inc.
Series C Preferred Stock |
C - Conversion | -384,118 | 0 | -100.00 | ||||
| 2017-03-29 |
|
4 | AYX |
Alteryx, Inc.
Series C Preferred Stock |
C - Conversion | -530,748 | 0 | -100.00 | ||||
| 2017-03-29 |
|
4 | AYX |
Alteryx, Inc.
Series C Preferred Stock |
C - Conversion | -20,261 | 0 | -100.00 | ||||
| 2017-03-29 |
|
4 | AYX |
Alteryx, Inc.
Series C Preferred Stock |
C - Conversion | -180,057 | 0 | -100.00 | ||||
| 2017-03-29 |
|
4 | AYX |
Alteryx, Inc.
Series C Preferred Stock |
C - Conversion | -146,848 | 0 | -100.00 | ||||
| 2017-03-29 |
|
4 | AYX |
Alteryx, Inc.
Series C Preferred Stock |
C - Conversion | -567,700 | 0 | -100.00 | ||||
| 2017-03-29 |
|
4 | AYX |
Alteryx, Inc.
Series B Preferred Stock |
C - Conversion | -2,219,089 | 0 | -100.00 | ||||
| 2017-03-29 |
|
4 | AYX |
Alteryx, Inc.
Series B Preferred Stock |
C - Conversion | -1,109,544 | 0 | -100.00 | ||||
| 2017-03-29 |
|
4 | AYX |
Alteryx, Inc.
Series B Preferred Stock |
C - Conversion | -1,109,544 | 0 | -100.00 | ||||
| 2017-03-29 |
|
4 | AYX |
Alteryx, Inc.
Series B Preferred Stock |
C - Conversion | -465,856 | 0 | -100.00 | ||||
| 2017-03-29 |
|
4 | AYX |
Alteryx, Inc.
Series B Preferred Stock |
C - Conversion | -643,689 | 0 | -100.00 | ||||
| 2017-03-29 |
|
4 | AYX |
Alteryx, Inc.
Series B Preferred Stock |
C - Conversion | -24,572 | 0 | -100.00 | ||||
| 2017-03-29 |
|
4 | AYX |
Alteryx, Inc.
Series B Preferred Stock |
C - Conversion | -218,372 | 0 | -100.00 | ||||
| 2017-03-29 |
|
4 | AYX |
Alteryx, Inc.
Series B Preferred Stock |
C - Conversion | -178,096 | 0 | -100.00 | ||||
| 2017-03-29 |
|
4 | AYX |
Alteryx, Inc.
Series B Preferred Stock |
C - Conversion | -688,504 | 0 | -100.00 | ||||
| 2017-03-29 |
|
4 | AYX |
Alteryx, Inc.
Class A Common Stock |
A - Award | 675,000 | 675,000 | 14.00 | 9,450,000 | 9,450,000 | ||
| 2017-03-29 |
|
4 | AYX |
Alteryx, Inc.
Class A Common Stock |
A - Award | 337,500 | 337,500 | 14.00 | 4,725,000 | 4,725,000 | ||
| 2017-03-29 |
|
4 | AYX |
Alteryx, Inc.
Class A Common Stock |
A - Award | 337,500 | 337,500 | 14.00 | 4,725,000 | 4,725,000 | ||
| 2017-03-29 |
|
4 | AYX |
Alteryx, Inc.
Class A Common Stock |
A - Award | 141,704 | 141,704 | 14.00 | 1,983,856 | 1,983,856 | ||
| 2017-03-29 |
|
4 | AYX |
Alteryx, Inc.
Class A Common Stock |
A - Award | 195,796 | 195,796 | 14.00 | 2,741,144 | 2,741,144 | ||
| 2017-03-29 |
|
4 | AYX |
Alteryx, Inc.
Class A Common Stock |
A - Award | 7,474 | 7,474 | 14.00 | 104,636 | 104,636 | ||
| 2017-03-29 |
|
4 | AYX |
Alteryx, Inc.
Class A Common Stock |
A - Award | 66,424 | 66,424 | 14.00 | 929,936 | 929,936 | ||
| 2017-03-29 |
|
4 | AYX |
Alteryx, Inc.
Class A Common Stock |
A - Award | 54,173 | 54,173 | 14.00 | 758,422 | 758,422 | ||
| 2017-03-29 |
|
4 | AYX |
Alteryx, Inc.
Class A Common Stock |
A - Award | 209,429 | 209,429 | 14.00 | 2,932,006 | 2,932,006 | ||
| 2015-11-19 |
|
4 | INST |
INSTRUCTURE INC
Series E Preferred Stock |
C - Conversion | -1,368,550 | 0 | -100.00 | ||||
| 2015-11-19 |
|
4 | INST |
INSTRUCTURE INC
Series E Preferred Stock |
C - Conversion | -287,302 | 0 | -100.00 | ||||
| 2015-11-19 |
|
4 | INST |
INSTRUCTURE INC
Series E Preferred Stock |
C - Conversion | -396,973 | 0 | -100.00 | ||||
| 2015-11-19 |
|
4 | INST |
INSTRUCTURE INC
Series E Preferred Stock |
C - Conversion | -134,674 | 0 | -100.00 | ||||
| 2015-11-19 |
|
4 | INST |
INSTRUCTURE INC
Series E Preferred Stock |
C - Conversion | -15,154 | 0 | -100.00 | ||||
| 2015-11-19 |
|
4 | INST |
INSTRUCTURE INC
Series E Preferred Stock |
C - Conversion | -109,835 | 0 | -100.00 | ||||
| 2015-11-19 |
|
4 | INST |
INSTRUCTURE INC
Series E Preferred Stock |
C - Conversion | -424,612 | 0 | -100.00 | ||||
| 2015-11-19 |
|
4 | INST |
INSTRUCTURE INC
Series A Preferred Stock |
C - Conversion | -214,943 | 0 | -100.00 | ||||
| 2015-11-19 |
|
4 | INST |
INSTRUCTURE INC
Series A Preferred Stock |
C - Conversion | -45,123 | 0 | -100.00 | ||||
| 2015-11-19 |
|
4 | INST |
INSTRUCTURE INC
Series A Preferred Stock |
C - Conversion | -62,348 | 0 | -100.00 | ||||
| 2015-11-19 |
|
4 | INST |
INSTRUCTURE INC
Series A Preferred Stock |
C - Conversion | -21,152 | 0 | -100.00 | ||||
| 2015-11-19 |
|
4 | INST |
INSTRUCTURE INC
Series A Preferred Stock |
C - Conversion | -2,380 | 0 | -100.00 | ||||
| 2015-11-19 |
|
4 | INST |
INSTRUCTURE INC
Series A Preferred Stock |
C - Conversion | -17,250 | 0 | -100.00 | ||||
| 2015-11-19 |
|
4 | INST |
INSTRUCTURE INC
Series A Preferred Stock |
C - Conversion | -66,690 | 0 | -100.00 | ||||
| 2015-11-19 |
|
4 | INST |
INSTRUCTURE INC
Common Stock, par value $0.0001 per share |
C - Conversion | 2,089,937 | 2,595,952 | 413.02 | ||||
| 2015-11-19 |
|
4 | INST |
INSTRUCTURE INC
Common Stock, par value $0.0001 per share |
C - Conversion | 438,744 | 544,972 | 413.02 | ||||
| 2015-11-19 |
|
4 | INST |
INSTRUCTURE INC
Common Stock, par value $0.0001 per share |
C - Conversion | 606,225 | 753,005 | 413.02 | ||||
| 2015-11-19 |
|
4 | INST |
INSTRUCTURE INC
Common Stock, par value $0.0001 per share |
C - Conversion | 205,663 | 255,458 | 413.02 | ||||
| 2015-11-19 |
|
4 | INST |
INSTRUCTURE INC
Common Stock, par value $0.0001 per share |
C - Conversion | 23,141 | 28,743 | 413.08 | ||||
| 2015-11-19 |
|
4 | INST |
INSTRUCTURE INC
Common Stock, par value $0.0001 per share |
C - Conversion | 167,730 | 208,341 | 413.02 | ||||
| 2015-11-19 |
|
4 | INST |
INSTRUCTURE INC
Common Stock, par value $0.0001 per share |
C - Conversion | 648,434 | 805,433 | 413.02 | ||||
| 2015-11-19 | 3/A | INST |
INSTRUCTURE INC
Common Stock |
156,999 | ||||||||
| 2015-11-19 | 3/A | INST |
INSTRUCTURE INC
Common Stock |
40,611 | ||||||||
| 2015-11-19 | 3/A | INST |
INSTRUCTURE INC
Common Stock |
5,602 | ||||||||
| 2015-11-19 | 3/A | INST |
INSTRUCTURE INC
Common Stock |
49,795 | ||||||||
| 2015-11-19 | 3/A | INST |
INSTRUCTURE INC
Common Stock |
146,780 | ||||||||
| 2015-11-19 | 3/A | INST |
INSTRUCTURE INC
Common Stock |
106,228 | ||||||||
| 2015-11-19 | 3/A | INST |
INSTRUCTURE INC
Common Stock |
506,015 | ||||||||
| 2015-11-12 | 3 | INST |
INSTRUCTURE INC
Common Stock |
1,169,029 | ||||||||
| 2015-11-12 | 3 | INST |
INSTRUCTURE INC
Common Stock |
1,052,641 | ||||||||
| 2015-11-12 | 3 | INST |
INSTRUCTURE INC
Common Stock |
1,017,632 | ||||||||
| 2015-11-12 | 3 | INST |
INSTRUCTURE INC
Common Stock |
1,061,825 | ||||||||
| 2015-11-12 | 3 | INST |
INSTRUCTURE INC
Common Stock |
1,158,810 | ||||||||
| 2015-11-12 | 3 | INST |
INSTRUCTURE INC
Common Stock |
1,118,258 | ||||||||
| 2015-11-12 | 3 | INST |
INSTRUCTURE INC
Common Stock |
1,518,045 | ||||||||
| 2015-11-12 | 3 | INST |
INSTRUCTURE INC
Common Stock |
1,169,029 | ||||||||
| 2015-11-12 | 3 | INST |
INSTRUCTURE INC
Common Stock |
1,052,641 | ||||||||
| 2015-11-12 | 3 | INST |
INSTRUCTURE INC
Common Stock |
1,017,632 | ||||||||
| 2015-11-12 | 3 | INST |
INSTRUCTURE INC
Common Stock |
1,061,825 | ||||||||
| 2015-11-12 | 3 | INST |
INSTRUCTURE INC
Common Stock |
1,158,810 | ||||||||
| 2015-11-12 | 3 | INST |
INSTRUCTURE INC
Common Stock |
1,118,258 | ||||||||
| 2015-11-12 | 3 | INST |
INSTRUCTURE INC
Common Stock |
1,518,045 | ||||||||
| 2015-08-13 |
|
4 | CVT |
CVENT INC
Common Stock, par value $0.001 per share |
S - Sale | -139,828 | 4,125,810 | -3.28 | 32.01 | -4,475,894 | 132,067,178 | |
| 2015-08-13 |
|
4 | CVT |
CVENT INC
Common Stock, par value $0.001 per share |
S - Sale | -5,794 | 170,946 | -3.28 | 32.01 | -185,466 | 5,471,981 | |
| 2015-08-13 |
|
4 | CVT |
CVENT INC
Common Stock, par value $0.001 per share |
S - Sale | -2,120 | 62,553 | -3.28 | 32.01 | -67,861 | 2,002,322 | |
| 2015-08-13 |
|
4 | CVT |
CVENT INC
Common Stock, par value $0.001 per share |
S - Sale | -40,321 | 1,189,733 | -3.28 | 32.01 | -1,290,675 | 38,083,353 | |
| 2015-08-13 |
|
4 | CVT |
CVENT INC
Common Stock, par value $0.001 per share |
S - Sale | -91,593 | 2,702,578 | -3.28 | 32.01 | -2,931,892 | 86,509,522 | |
| 2015-08-13 |
|
4 | CVT |
CVENT INC
Common Stock, par value $0.001 per share |
S - Sale | -64,903 | 4,265,638 | -1.50 | 32.28 | -2,095,069 | 137,694,795 | |
| 2015-08-13 |
|
4 | CVT |
CVENT INC
Common Stock, par value $0.001 per share |
S - Sale | -2,689 | 176,740 | -1.50 | 32.28 | -86,801 | 5,705,167 | |
| 2015-08-13 |
|
4 | CVT |
CVENT INC
Common Stock, par value $0.001 per share |
S - Sale | -984 | 64,673 | -1.50 | 32.28 | -31,764 | 2,087,644 | |
| 2015-08-13 |
|
4 | CVT |
CVENT INC
Common Stock, par value $0.001 per share |
S - Sale | -18,716 | 1,230,054 | -1.50 | 32.28 | -604,152 | 39,706,143 | |
| 2015-08-13 |
|
4 | CVT |
CVENT INC
Common Stock, par value $0.001 per share |
S - Sale | -42,514 | 2,794,171 | -1.50 | 32.28 | -1,372,352 | 90,195,840 | |
| 2015-06-12 |
|
4 | CVT |
CVENT INC
Common Stock, par value $0.001 per share |
S - Sale | -1,700 | 4,330,541 | -0.04 | 26.31 | -44,727 | 113,936,534 | |
| 2015-06-12 |
|
4 | CVT |
CVENT INC
Common Stock, par value $0.001 per share |
S - Sale | -70 | 179,429 | -0.04 | 26.31 | -1,842 | 4,720,777 | |
| 2015-06-12 |
|
4 | CVT |
CVENT INC
Common Stock, par value $0.001 per share |
S - Sale | -26 | 65,657 | -0.04 | 26.31 | -684 | 1,727,436 | |
| 2015-06-12 |
|
4 | CVT |
CVENT INC
Common Stock, par value $0.001 per share |
S - Sale | -490 | 1,248,770 | -0.04 | 26.31 | -12,892 | 32,855,139 | |
| 2015-06-12 |
|
4 | CVT |
CVENT INC
Common Stock, par value $0.001 per share |
S - Sale | -1,114 | 2,836,685 | -0.04 | 26.31 | -29,309 | 74,633,182 | |
| 2015-06-12 |
|
4 | CVT |
CVENT INC
Common Stock, par value $0.001 per share |
S - Sale | -27,567 | 4,332,241 | -0.63 | 26.36 | -726,666 | 114,197,873 | |
| 2015-06-12 |
|
4 | CVT |
CVENT INC
Common Stock, par value $0.001 per share |
S - Sale | -1,142 | 179,499 | -0.63 | 26.36 | -30,103 | 4,731,594 | |
| 2015-06-12 |
|
4 | CVT |
CVENT INC
Common Stock, par value $0.001 per share |
S - Sale | -418 | 65,683 | -0.63 | 26.36 | -11,018 | 1,731,404 | |
| 2015-06-12 |
|
4 | CVT |
CVENT INC
Common Stock, par value $0.001 per share |
S - Sale | -7,949 | 1,249,260 | -0.63 | 26.36 | -209,536 | 32,930,494 | |
| 2015-06-12 |
|
4 | CVT |
CVENT INC
Common Stock, par value $0.001 per share |
S - Sale | -18,058 | 2,837,799 | -0.63 | 26.36 | -476,009 | 74,804,382 | |
| 2015-06-12 |
|
4 | CVT |
CVENT INC
Common Stock, par value $0.001 per share |
S - Sale | -154,019 | 4,359,808 | -3.41 | 26.62 | -4,099,986 | 116,058,089 | |
| 2015-06-12 |
|
4 | CVT |
CVENT INC
Common Stock, par value $0.001 per share |
S - Sale | -6,382 | 180,641 | -3.41 | 26.62 | -169,889 | 4,808,663 | |
| 2015-06-12 |
|
4 | CVT |
CVENT INC
Common Stock, par value $0.001 per share |
S - Sale | -2,335 | 66,101 | -3.41 | 26.62 | -62,158 | 1,759,609 | |
| 2015-06-12 |
|
4 | CVT |
CVENT INC
Common Stock, par value $0.001 per share |
S - Sale | -44,413 | 1,257,209 | -3.41 | 26.62 | -1,182,274 | 33,466,904 | |
| 2015-06-12 |
|
4 | CVT |
CVENT INC
Common Stock, par value $0.001 per share |
S - Sale | -100,889 | 2,855,857 | -3.41 | 26.62 | -2,685,665 | 76,022,913 | |
| 2015-03-10 |
|
4 | CVT |
CVENT INC
Common Stock, par value $0.001 per share |
S - Sale | -907,300 | 4,513,827 | -16.74 | 28.90 | -26,220,970 | 130,449,600 | |
| 2015-03-10 |
|
4 | CVT |
CVENT INC
Common Stock, par value $0.001 per share |
S - Sale | -37,592 | 187,023 | -16.74 | 28.90 | -1,086,409 | 5,404,965 | |
| 2015-03-10 |
|
4 | CVT |
CVENT INC
Common Stock, par value $0.001 per share |
S - Sale | -13,756 | 68,436 | -16.74 | 28.90 | -397,548 | 1,977,800 | |
| 2015-03-10 |
|
4 | CVT |
CVENT INC
Common Stock, par value $0.001 per share |
S - Sale | -261,632 | 1,301,622 | -16.74 | 28.90 | -7,561,165 | 37,616,876 | |
| 2015-03-10 |
|
4 | CVT |
CVENT INC
Common Stock, par value $0.001 per share |
S - Sale | -594,320 | 2,956,746 | -16.74 | 28.90 | -17,175,848 | 85,449,959 | |
| 2015-03-10 |
|
4 | CVT |
CVENT INC
Common Stock, par value $0.001 per share |
S - Sale | -33,600 | 5,421,127 | -0.62 | 29.44 | -989,184 | 159,597,979 | |
| 2015-03-10 |
|
4 | CVT |
CVENT INC
Common Stock, par value $0.001 per share |
S - Sale | -1,393 | 224,615 | -0.62 | 29.44 | -41,010 | 6,612,666 | |
| 2015-03-10 |
|
4 | CVT |
CVENT INC
Common Stock, par value $0.001 per share |
S - Sale | -509 | 82,192 | -0.62 | 29.44 | -14,985 | 2,419,732 | |
| 2015-03-10 |
|
4 | CVT |
CVENT INC
Common Stock, par value $0.001 per share |
S - Sale | -9,689 | 1,563,254 | -0.62 | 29.44 | -285,244 | 46,022,198 | |
| 2015-03-10 |
|
4 | CVT |
CVENT INC
Common Stock, par value $0.001 per share |
S - Sale | -22,009 | 3,551,066 | -0.62 | 29.44 | -647,945 | 104,543,383 | |
| 2014-11-17 |
|
4 | SSTK |
Shutterstock, Inc.
Common Stock, par value $0.01 per share |
J - Other | -168,147 | 0 | -100.00 | ||||
| 2014-11-17 |
|
4 | SSTK |
Shutterstock, Inc.
Common Stock, par value $0.01 per share |
J - Other | 168,147 | 168,147 | |||||
| 2014-11-17 |
|
4 | SSTK |
Shutterstock, Inc.
Common Stock, par value $0.01 per share |
J - Other | -1,289,748 | 0 | -100.00 | ||||
| 2014-11-17 |
|
4 | SSTK |
Shutterstock, Inc.
Common Stock, par value $0.01 per share |
J - Other | -573,217 | 0 | -100.00 | ||||
| 2014-11-17 |
|
4 | SSTK |
Shutterstock, Inc.
Common Stock, par value $0.01 per share |
J - Other | -159,334 | 0 | -100.00 | ||||
| 2014-11-17 |
|
4 | SSTK |
Shutterstock, Inc.
Common Stock, par value $0.01 per share |
J - Other | -30,943 | 0 | -100.00 | ||||
| 2014-11-17 |
|
4 | SSTK |
Shutterstock, Inc.
Common Stock, par value $0.01 per share |
J - Other | -526,254 | 0 | -100.00 | ||||
| 2014-08-22 |
|
4 | CVT |
CVENT INC
Common Stock, par value $0.001 per share |
J - Other | 82,785 | 82,785 | |||||
| 2014-08-22 |
|
4 | CVT |
CVENT INC
Common Stock, par value $0.001 per share |
J - Other | -750,000 | 5,454,727 | -12.09 | ||||
| 2014-08-22 |
|
4 | CVT |
CVENT INC
Common Stock, par value $0.001 per share |
J - Other | -21,513 | 0 | -100.00 | ||||
| 2014-08-22 |
|
4 | CVT |
CVENT INC
Common Stock, par value $0.001 per share |
J - Other | 21,513 | 21,513 | |||||
| 2014-08-22 |
|
4 | CVT |
CVENT INC
Common Stock, par value $0.001 per share |
J - Other | -31,075 | 226,008 | -12.09 | ||||
| 2014-08-22 |
|
4 | CVT |
CVENT INC
Common Stock, par value $0.001 per share |
J - Other | -11,371 | 82,701 | -12.09 | ||||
| 2014-08-22 |
|
4 | CVT |
CVENT INC
Common Stock, par value $0.001 per share |
J - Other | -216,272 | 1,572,943 | -12.09 | ||||
| 2014-08-22 |
|
4 | CVT |
CVENT INC
Common Stock, par value $0.001 per share |
J - Other | -491,282 | 3,573,075 | -12.09 | ||||
| 2014-08-18 |
|
4 | CVT |
CVENT INC
Common Stock, par value $0.001 per share |
S - Sale | -200,000 | 6,204,727 | -3.12 | 26.33 | -5,266,000 | 163,370,462 | |
| 2014-08-18 |
|
4 | CVT |
CVENT INC
Common Stock, par value $0.001 per share |
S - Sale | -8,287 | 257,083 | -3.12 | 26.33 | -218,197 | 6,768,995 | |
| 2014-08-18 |
|
4 | CVT |
CVENT INC
Common Stock, par value $0.001 per share |
S - Sale | -3,032 | 94,072 | -3.12 | 26.33 | -79,833 | 2,476,916 | |
| 2014-08-18 |
|
4 | CVT |
CVENT INC
Common Stock, par value $0.001 per share |
S - Sale | -57,673 | 1,789,215 | -3.12 | 26.33 | -1,518,530 | 47,110,031 | |
| 2014-08-18 |
|
4 | CVT |
CVENT INC
Common Stock, par value $0.001 per share |
S - Sale | -131,008 | 4,064,357 | -3.12 | 26.33 | -3,449,441 | 107,014,520 | |
| 2014-08-15 |
|
4 | SSTK |
Shutterstock, Inc.
Common Stock, par value $0.01 per share |
J - Other | 222,135 | 222,135 | |||||
| 2014-08-15 |
|
4 | SSTK |
Shutterstock, Inc.
Common Stock, par value $0.01 per share |
J - Other | -1,300,000 | 1,289,748 | -50.20 | ||||
| 2014-08-15 |
|
4 | SSTK |
Shutterstock, Inc.
Common Stock, par value $0.01 per share |
J - Other | -577,773 | 573,217 | -50.20 | ||||
| 2014-08-15 |
|
4 | SSTK |
Shutterstock, Inc.
Common Stock, par value $0.01 per share |
J - Other | -160,601 | 159,334 | -50.20 | ||||
| 2014-08-15 |
|
4 | SSTK |
Shutterstock, Inc.
Common Stock, par value $0.01 per share |
J - Other | -31,189 | 30,943 | -50.20 | ||||
| 2014-08-15 |
|
4 | SSTK |
Shutterstock, Inc.
Common Stock, par value $0.01 per share |
J - Other | -530,437 | 526,254 | -50.20 | ||||
| 2014-06-16 |
|
4 | SSTK |
Shutterstock, Inc.
Common stock, par value $0.01 per share |
J - Other | -127,285 | 0 | -100.00 | ||||
| 2014-06-16 |
|
4 | SSTK |
Shutterstock, Inc.
Common stock, par value $0.01 per share |
J - Other | 127,285 | 127,285 | |||||
| 2014-06-16 |
|
4 | SSTK |
Shutterstock, Inc.
Common stock, par value $0.01 per share |
J - Other | -750,000 | 2,589,748 | -22.46 | ||||
| 2014-06-16 |
|
4 | SSTK |
Shutterstock, Inc.
Common stock, par value $0.01 per share |
J - Other | -333,331 | 1,150,990 | -22.46 | ||||
| 2014-06-16 |
|
4 | SSTK |
Shutterstock, Inc.
Common stock, par value $0.01 per share |
J - Other | -92,654 | 319,935 | -22.46 | ||||
| 2014-06-16 |
|
4 | SSTK |
Shutterstock, Inc.
Common stock, par value $0.01 per share |
J - Other | -17,993 | 62,132 | -22.46 | ||||
| 2014-06-16 |
|
4 | SSTK |
Shutterstock, Inc.
Common stock, par value $0.01 per share |
J - Other | -306,022 | 1,056,691 | -22.46 | ||||
| 2014-06-16 |
|
4 | CVT |
CVENT INC
Common Stock, par value $0.001 per share |
S - Sale | -750,000 | 6,404,727 | -10.48 | 25.25 | -18,937,500 | 161,719,357 | |
| 2014-06-16 |
|
4 | CVT |
CVENT INC
Common Stock, par value $0.001 per share |
S - Sale | -31,075 | 265,370 | -10.48 | 25.25 | -784,644 | 6,700,592 | |
| 2014-06-16 |
|
4 | CVT |
CVENT INC
Common Stock, par value $0.001 per share |
S - Sale | -11,371 | 97,104 | -10.48 | 25.25 | -287,118 | 2,451,876 | |
| 2014-06-16 |
|
4 | CVT |
CVENT INC
Common Stock, par value $0.001 per share |
S - Sale | -216,272 | 1,846,888 | -10.48 | 25.25 | -5,460,868 | 46,633,922 | |
| 2014-06-16 |
|
4 | CVT |
CVENT INC
Common Stock, par value $0.001 per share |
S - Sale | -491,282 | 4,195,365 | -10.48 | 25.25 | -12,404,870 | 105,932,966 | |
| 2014-03-03 |
|
4 | SSTK |
Shutterstock, Inc.
Common stock, par value $0.01 per share |
J - Other | -174,421 | 0 | -100.00 | ||||
| 2014-03-03 |
|
4 | SSTK |
Shutterstock, Inc.
Common stock, par value $0.01 per share |
J - Other | 174,421 | 174,421 | |||||
| 2014-03-03 |
|
4 | SSTK |
Shutterstock, Inc.
Common stock, par value $0.01 per share |
J - Other | -1,000,000 | 3,339,748 | -23.04 | ||||
| 2014-03-03 |
|
4 | SSTK |
Shutterstock, Inc.
Common stock, par value $0.01 per share |
J - Other | -444,441 | 1,484,321 | -23.04 | ||||
| 2014-03-03 |
|
4 | SSTK |
Shutterstock, Inc.
Common stock, par value $0.01 per share |
J - Other | -123,539 | 412,589 | -23.04 | ||||
| 2014-03-03 |
|
4 | SSTK |
Shutterstock, Inc.
Common stock, par value $0.01 per share |
J - Other | -23,991 | 80,125 | -23.04 | ||||
| 2014-03-03 |
|
4 | SSTK |
Shutterstock, Inc.
Common stock, par value $0.01 per share |
J - Other | -408,029 | 1,362,713 | -23.04 | ||||
| 2014-01-23 |
|
4 | CVT |
CVENT INC
Common Stock |
S - Sale | -202,784 | 7,154,727 | -2.76 | 35.50 | -7,198,832 | 253,992,808 | |
| 2014-01-23 |
|
4 | CVT |
CVENT INC
Common Stock |
S - Sale | -8,402 | 296,445 | -2.76 | 35.50 | -298,271 | 10,523,798 | |
| 2014-01-23 |
|
4 | CVT |
CVENT INC
Common Stock |
S - Sale | -3,074 | 108,475 | -2.76 | 35.50 | -109,127 | 3,850,862 | |
| 2014-01-23 |
|
4 | CVT |
CVENT INC
Common Stock |
S - Sale | -58,476 | 2,063,160 | -2.76 | 35.50 | -2,075,898 | 73,242,180 | |
| 2014-01-23 |
|
4 | CVT |
CVENT INC
Common Stock |
S - Sale | -132,832 | 4,686,647 | -2.76 | 35.50 | -4,715,536 | 166,375,968 | |
| 2014-01-21 |
|
4 | CVT |
CVENT INC
Common Stock |
S - Sale | -1,351,892 | 7,357,511 | -15.52 | 35.50 | -47,992,166 | 261,191,640 | |
| 2014-01-21 |
|
4 | CVT |
CVENT INC
Common Stock |
S - Sale | -56,013 | 304,847 | -15.52 | 35.50 | -1,988,462 | 10,822,068 | |
| 2014-01-21 |
|
4 | CVT |
CVENT INC
Common Stock |
S - Sale | -20,498 | 111,549 | -15.52 | 35.50 | -727,679 | 3,959,990 | |
| 2014-01-21 |
|
4 | CVT |
CVENT INC
Common Stock |
S - Sale | -389,836 | 2,121,636 | -15.52 | 35.50 | -13,839,178 | 75,318,078 | |
| 2014-01-21 |
|
4 | CVT |
CVENT INC
Common Stock |
S - Sale | -885,545 | 4,819,479 | -15.52 | 35.50 | -31,436,848 | 171,091,504 | |
| 2013-11-18 | 3 | CHGG |
CHEGG, INC
Common Stock, par value $0.001 per share |
6,323,440 | ||||||||
| 2013-11-18 | 3 | CHGG |
CHEGG, INC
Common Stock, par value $0.001 per share |
1,986,489 | ||||||||
| 2013-11-18 | 3 | CHGG |
CHEGG, INC
Common Stock, par value $0.001 per share |
367,462 | ||||||||
| 2013-11-18 | 3 | CHGG |
CHEGG, INC
Common Stock, par value $0.001 per share |
8,677,391 | ||||||||
| 2013-11-18 | 3 | CHGG |
CHEGG, INC
Common Stock, par value $0.001 per share |
8,677,391 | ||||||||
| 2013-08-14 |
|
4 | CVT |
CVENT INC
Series A Preferred Stock |
C - Conversion | -8,709,403 | 0 | -100.00 | ||||
| 2013-08-14 |
|
4 | CVT |
CVENT INC
Series A Preferred Stock |
C - Conversion | -360,860 | 0 | -100.00 | ||||
| 2013-08-14 |
|
4 | CVT |
CVENT INC
Series A Preferred Stock |
C - Conversion | -132,047 | 0 | -100.00 | ||||
| 2013-08-14 |
|
4 | CVT |
CVENT INC
Series A Preferred Stock |
C - Conversion | -2,511,472 | 0 | -100.00 | ||||
| 2013-08-14 |
|
4 | CVT |
CVENT INC
Series A Preferred Stock |
C - Conversion | -5,705,024 | 0 | -100.00 | ||||
| 2013-08-14 |
|
4 | CVT |
CVENT INC
Common Stock |
C - Conversion | 8,709,403 | 8,709,403 | |||||
| 2013-08-14 |
|
4 | CVT |
CVENT INC
Common Stock |
C - Conversion | 360,860 | 360,860 | |||||
| 2013-08-14 |
|
4 | CVT |
CVENT INC
Common Stock |
C - Conversion | 132,047 | 132,047 | |||||
| 2013-08-14 |
|
4 | CVT |
CVENT INC
Common Stock |
C - Conversion | 2,511,472 | 2,511,472 | |||||
| 2013-08-14 |
|
4 | CVT |
CVENT INC
Common Stock |
C - Conversion | 5,705,024 | 5,705,024 | |||||
| 2013-08-08 | 3 | CVT |
CVENT INC
Common Stock, par value $0.001 per share |
5,705,024 | ||||||||
| 2013-08-08 | 3 | CVT |
CVENT INC
Common Stock, par value $0.001 per share |
2,511,472 | ||||||||
| 2013-08-08 | 3 | CVT |
CVENT INC
Common Stock, par value $0.001 per share |
132,047 | ||||||||
| 2013-08-08 | 3 | CVT |
CVENT INC
Common Stock, par value $0.001 per share |
360,860 | ||||||||
| 2013-08-08 | 3 | CVT |
CVENT INC
Common Stock, par value $0.001 per share |
8,709,403 | ||||||||
| 2013-05-23 |
|
4 | SSTK |
Shutterstock, Inc.
Common Stock, par value $0.01 per share |
J - Other | -170,074 | 0 | -100.00 | ||||
| 2013-05-23 |
|
4 | SSTK |
Shutterstock, Inc.
Common Stock, par value $0.01 per share |
J - Other | 170,074 | 170,074 | |||||
| 2013-05-23 |
|
4 | SSTK |
Shutterstock, Inc.
Common Stock, par value $0.01 per share |
J - Other | -1,000,000 | 5,949,748 | -14.39 | ||||
| 2013-05-23 |
|
4 | SSTK |
Shutterstock, Inc.
Common Stock, par value $0.01 per share |
J - Other | -444,441 | 2,644,313 | -14.39 | ||||
| 2013-05-23 |
|
4 | SSTK |
Shutterstock, Inc.
Common Stock, par value $0.01 per share |
J - Other | -123,539 | 735,025 | -14.39 | ||||
| 2013-05-23 |
|
4 | SSTK |
Shutterstock, Inc.
Common Stock, par value $0.01 per share |
J - Other | -23,991 | 142,742 | -14.39 | ||||
| 2013-05-23 |
|
4 | SSTK |
Shutterstock, Inc.
Common Stock, par value $0.01 per share |
J - Other | -408,029 | 2,427,668 | -14.39 | ||||
| 2012-10-10 | 3 | SSTK |
Shutterstock, Inc.
Common Stock, par value $0.01 per share |
3,088,754 | ||||||||
| 2012-10-10 | 3 | SSTK |
Shutterstock, Inc.
Common Stock, par value $0.01 per share |
858,564 | ||||||||
| 2012-10-10 | 3 | SSTK |
Shutterstock, Inc.
Common Stock, par value $0.01 per share |
166,733 | ||||||||
| 2012-10-10 | 3 | SSTK |
Shutterstock, Inc.
Common Stock, par value $0.01 per share |
2,835,697 | ||||||||
| 2012-10-10 | 3 | SSTK |
Shutterstock, Inc.
Common Stock, par value $0.01 per share |
166,733 | ||||||||
| 2012-10-10 | 3 | SSTK |
Shutterstock, Inc.
Common Stock, par value $0.01 per share |
2,835,697 | ||||||||
| 2012-10-10 | 3 | SSTK |
Shutterstock, Inc.
Common Stock, par value $0.01 per share |
6,949,747 | ||||||||
| 2012-10-10 | 3 | SSTK |
Shutterstock, Inc.
Common Stock, par value $0.01 per share |
6,949,747 | ||||||||
| 2009-12-15 |
|
4 | MDSO |
Medidata Solutions, Inc.
Common Stock |
S - Sale | -2,960,528 | 1,844,343 | -61.62 | 14.18 | -41,965,484 | 26,143,562 | |
| 2009-12-15 |
|
4 | MDSO |
Medidata Solutions, Inc.
Common Stock |
S - Sale | -17,763 | 12,422 | -58.85 | 14.18 | -251,791 | 176,082 | |
| 2009-12-15 |
|
4 | MDSO |
Medidata Solutions, Inc.
Common Stock |
S - Sale | -287,171 | 180,974 | -61.34 | 14.18 | -4,070,649 | 2,565,306 | |
| 2009-12-15 |
|
4 | MDSO |
Medidata Solutions, Inc.
Common Stock |
S - Sale | -313,816 | 194,038 | -61.79 | 14.18 | -4,448,342 | 2,750,489 | |
| 2009-12-15 |
|
4 | MDSO |
Medidata Solutions, Inc.
Common Stock |
S - Sale | -2,341,778 | 1,456,909 | -61.65 | 14.18 | -33,194,703 | 20,651,685 | |
| 2006-08-03 |
|
4 | WSPI |
WEBSITE PROS INC
Common Stock |
S - Sale | -3,339,126 | 0 | -100.00 | 8.74 | -29,183,961 | ||
| 2006-08-03 |
|
4 | WSPI |
WEBSITE PROS INC
Common Stock |
S - Sale | -2,639,885 | 0 | -100.00 | 8.74 | -23,072,595 | ||
| 2006-08-03 |
|
4 | WSPI |
WEBSITE PROS INC
Common Stock |
S - Sale | -20,976 | 0 | -100.00 | 8.74 | -183,330 | ||
| 2006-08-03 |
|
4 | WSPI |
WEBSITE PROS INC
Common Stock |
S - Sale | -352,335 | 0 | -100.00 | 8.74 | -3,079,408 | ||
| 2006-08-03 |
|
4 | WSPI |
WEBSITE PROS INC
Common Stock |
S - Sale | -352,930 | 0 | -100.00 | 8.74 | -3,084,608 | ||
| 2005-11-07 |
|
4 | WSPI |
WEBSITE PROS INC
Common Stock |
S - Sale | -1,350,000 | 3,339,126 | -28.79 | 9.30 | -12,555,000 | 31,053,872 | |
| 2005-11-07 |
|
4 | WSPI |
WEBSITE PROS INC
Common Stock |
C - Conversion | 4,689,126 | 4,689,126 | |||||
| 2005-11-07 |
|
4 | WSPI |
WEBSITE PROS INC
Common Stock |
S - Sale | -1,067,297 | 2,639,885 | -28.79 | 9.30 | -9,925,862 | 24,550,930 | |
| 2005-11-07 |
|
4 | WSPI |
WEBSITE PROS INC
Common Stock |
C - Conversion | 3,707,182 | 3,707,182 | |||||
| 2005-11-07 |
|
4 | WSPI |
WEBSITE PROS INC
Common Stock |
S - Sale | -8,481 | 20,976 | -28.79 | 9.30 | -78,873 | 195,077 | |
| 2005-11-07 |
|
4 | WSPI |
WEBSITE PROS INC
Common Stock |
C - Conversion | 29,457 | 29,457 | |||||
| 2005-11-07 |
|
4 | WSPI |
WEBSITE PROS INC
Common Stock |
S - Sale | -131,533 | 325,335 | -28.79 | 9.30 | -1,223,257 | 3,025,616 | |
| 2005-11-07 |
|
4 | WSPI |
WEBSITE PROS INC
Common Stock |
C - Conversion | 456,868 | 456,868 | |||||
| 2005-11-07 |
|
4 | WSPI |
WEBSITE PROS INC
Common Stock |
S - Sale | -142,689 | 352,930 | -28.79 | 9.30 | -1,327,008 | 3,282,249 | |
| 2005-11-07 |
|
4 | WSPI |
WEBSITE PROS INC
Common Stock |
C - Conversion | 495,619 | 495,619 |
P
Pembelian sekuritas non-derivatif atau derivatif di pasar terbuka atau secara pribadi.
S
Penjualan terbuka atau penjualan pribadi atas sekuritas non-derivatif atau derivatif.
A
Hibah, penghargaan, atau perolehan sekuritas lainnya dari perusahaan (seperti opsi)
C
Konversi turunan
D
Penjualan atau pengalihan sekuritas kembali ke perusahaan.
F
Pembayaran harga pelaksanaan atau kewajiban pajak menggunakan sebagian sekuritas yang diterima dari perusahaan.
G
Pemberian sekuritas oleh atau kepada orang dalam.
K
Swap ekuitas dan transaksi lindung nilai serupa
M
Pelaksanaan atau konversi sekuritas derivatif yang diterima dari perusahaan (seperti opsi)
V
Transaksi yang dilaporkan secara sukarela pada Formulir 4.
J
Lainnya (disertai dengan catatan kaki yang menjelaskan transaksi tersebut)