Mga Batayang Estadistika
| Nilai Portofolio | $ 2,212,499,230 |
| Posisi Saat Ini | 58 |
Kepemilikan Terbaru, Kinerja, AUM (dari 13F, 13D)
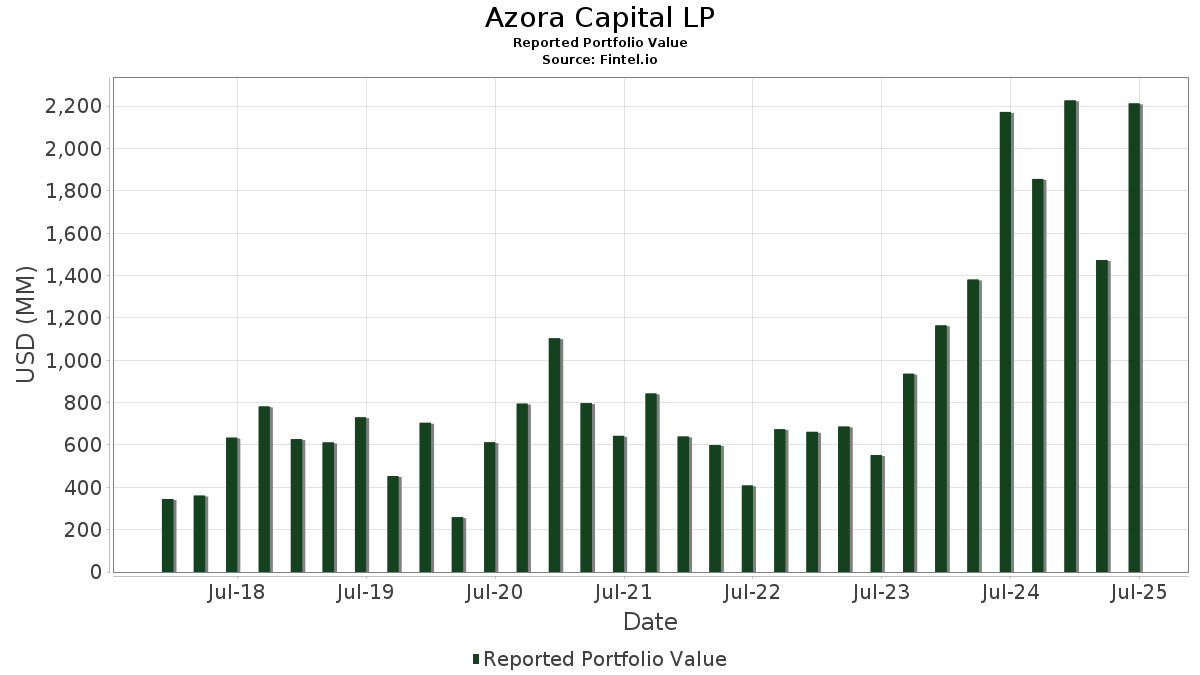
Azora Capital LP telah mengungkapkan total kepemilikan 58 dalam pengajuan SEC terbaru mereka. Nilai portofolio terbaru dihitung sebesar $ 2,212,499,230 USD. Aset yang Dikelola (AUM) sebenarnya adalah nilai ini ditambah kas (yang tidak diungkapkan). Aset-aset utama Azora Capital LP adalah LPL Financial Holdings Inc. (US:LPLA) , Bank of America Corporation (US:BAC) , Comerica Incorporated (US:CMA) , Webster Financial Corporation (US:WBS) , and KeyCorp (US:KEY) . Posisi baru Azora Capital LP meliputi: Dave Inc. (US:DAVE) , eToro Group Ltd. (US:ETOR) , Webull Corporation (US:BULL) , Mr. Cooper Group Inc. (US:COOP) , and Core Scientific, Inc. (US:CORZ) . Industri unggulan Azora Capital LP adalah "Real Estate" (sic 65) , "Holding And Other Investment Offices" (sic 67) , and "Insurance Carriers" (sic 63) .
Peningkatan Tertinggi Kuartal Ini
Kami menggunakan perubahan dalam alokasi portofolio karena ini adalah metrik yang paling bermakna. Perubahan dapat disebabkan oleh perdagangan atau perubahan harga saham.
| Keamanan | Saham (MM) |
Nilai (Juta Dolar AS) |
Portfolio % | ΔPorsyento ng Portfolio |
|---|---|---|---|---|
| 3.19 | 76.05 | 3.4373 | 3.4373 | |
| 0.61 | 52.09 | 2.3544 | 2.3544 | |
| 0.24 | 84.96 | 3.8402 | 2.2415 | |
| 2.61 | 55.34 | 2.5011 | 2.1941 | |
| 0.75 | 46.76 | 2.1136 | 2.1136 | |
| 0.68 | 45.79 | 2.0697 | 2.0697 | |
| 0.36 | 44.09 | 1.9926 | 1.9926 | |
| 1.04 | 40.57 | 1.8336 | 1.8336 | |
| 5.37 | 93.53 | 4.2273 | 1.7094 | |
| 4.86 | 78.01 | 3.5258 | 1.6880 |
Penurunan Tertinggi Kuartal Ini
Kami menggunakan perubahan dalam alokasi portofolio karena ini adalah metrik yang paling bermakna. Perubahan dapat disebabkan oleh perdagangan atau perubahan harga saham.
| Keamanan | Saham (MM) |
Nilai (Juta Dolar AS) |
Portfolio % | ΔPorsyento ng Portfolio |
|---|---|---|---|---|
| 0.51 | 46.28 | 2.0916 | -6.5139 | |
| 0.50 | 54.89 | 2.4809 | -4.7058 | |
| 2.97 | 140.33 | 6.3426 | -3.1304 | |
| 2.06 | 123.11 | 5.5644 | -2.0492 | |
| 0.47 | 177.12 | 8.0053 | -1.8191 | |
| 7.07 | 81.37 | 3.6779 | -1.8134 | |
| 0.30 | 16.84 | 0.7611 | -1.5975 | |
| 1.34 | 26.11 | 1.1800 | -1.0954 | |
| 1.09 | 72.56 | 3.2796 | -0.7749 | |
| 1.89 | 103.00 | 4.6552 | -0.4046 |
Pengajuan 13D/G
Ini adalah daftar pengajuan 13D dan 13G yang dibuat dalam setahun terakhir (jika ada). Klik ikon tautan untuk melihat riwayat transaksi lengkap. Baris berwarna hijau menunjukkan posisi baru. Baris berwarna merah menunjukkan posisi yang sudah ditutup.
| Tanggal File | Formulir | Keamanan | Sebelumnya Saham |
Saat ini Saham |
ΔPersentase Saham | % Kepemilikan |
% ΔKepemilikan | |
|---|---|---|---|---|---|---|---|---|
| 2025-08-14 | WT / WisdomTree, Inc. | 9,069,642 | 7,069,860 | -22.05 | 4.80 | -22.58 | ||
| 2025-05-15 | FFWM / First Foundation Inc. | 4,153,917 | 871,559 | -79.02 | 1.10 | -78.00 | ||
| 2025-02-14 | AAMI / Acadian Asset Management Inc. | 1,565,866 | 4.20 |
Pengajuan 13F dan Dana
Formulir ini diajukan pada 2025-08-14 untuk periode pelaporan 2025-06-30. Klik ikon tautan untuk melihat riwayat transaksi selengkapnya.
Tingkatkan ke versi premium untuk membuka data premium dan ekspor ke Excel. ![]() .
.
| Keamanan | Ketik | Harga Saham Rata-rata | Saham (MM) |
ΔSaham (%) |
ΔSaham (%) |
Nilai ($MM) |
Portpolyo (%) |
ΔPortofolio (%) |
|
|---|---|---|---|---|---|---|---|---|---|
| LPLA / LPL Financial Holdings Inc. | 0.47 | 6.76 | 177.12 | 22.37 | 8.0053 | -1.8191 | |||
| BAC / Bank of America Corporation | 2.97 | -11.33 | 140.33 | 0.55 | 6.3426 | -3.1304 | |||
| CMA / Comerica Incorporated | 2.06 | 8.67 | 123.11 | 9.76 | 5.5644 | -2.0492 | |||
| WBS / Webster Financial Corporation | 1.89 | 30.45 | 103.00 | 38.17 | 4.6552 | -0.4046 | |||
| KEY / KeyCorp | 5.37 | 131.44 | 93.53 | 152.14 | 4.2273 | 1.7094 | |||
| COIN / Coinbase Global, Inc. | 0.24 | 77.26 | 84.96 | 260.74 | 3.8402 | 2.2415 | |||
| WT / WisdomTree, Inc. | 7.07 | -22.05 | 81.37 | 0.58 | 3.6779 | -1.8134 | |||
| STNE / StoneCo Ltd. | 4.86 | 88.25 | 78.01 | 188.11 | 3.5258 | 1.6880 | |||
| BEN / Franklin Resources, Inc. | 3.19 | 76.05 | 3.4373 | 3.4373 | |||||
| NU / Nu Holdings Ltd. | 5.44 | 81.61 | 74.57 | 143.33 | 3.3704 | 1.2902 | |||
| TCBI / Texas Capital Bancshares, Inc. | 0.93 | 141.30 | 73.84 | 156.48 | 3.3375 | 1.3833 | |||
| CCB / Coastal Financial Corporation | 0.75 | 26.42 | 72.76 | 35.45 | 3.2885 | -0.3576 | |||
| IBOC / International Bancshares Corporation | 1.09 | 15.09 | 72.56 | 21.48 | 3.2796 | -0.7749 | |||
| SEIC / SEI Investments Company | 0.78 | 109.32 | 69.91 | 142.29 | 3.1596 | 1.2012 | |||
| RIOT / Riot Platforms, Inc. | 4.95 | 62.67 | 55.95 | 158.17 | 2.5290 | 1.0579 | |||
| FHN / First Horizon Corporation | 2.61 | 1,020.55 | 55.34 | 1,123.46 | 2.5011 | 2.1941 | |||
| PNFP / Pinnacle Financial Partners, Inc. | 0.50 | -50.21 | 54.89 | -48.16 | 2.4809 | -4.7058 | |||
| C / Citigroup Inc. | 0.61 | 52.09 | 2.3544 | 2.3544 | |||||
| MC / Moelis & Company | 0.75 | 46.76 | 2.1136 | 2.1136 | |||||
| SCHW / The Charles Schwab Corporation | 0.51 | -68.68 | 46.28 | -63.50 | 2.0916 | -6.5139 | |||
| KMX / CarMax, Inc. | 0.68 | 45.79 | 2.0697 | 2.0697 | |||||
| WTFC / Wintrust Financial Corporation | 0.36 | 44.09 | 1.9926 | 1.9926 | |||||
| SOFI / SoFi Technologies, Inc. | 2.36 | 4.94 | 43.04 | 64.31 | 1.9453 | 0.1673 | |||
| ALLY / Ally Financial Inc. | 1.04 | 40.57 | 1.8336 | 1.8336 | |||||
| FLYW / Flywire Corporation | 2.85 | 33.36 | 1.5076 | 1.5076 | |||||
| PAYO / Payoneer Global Inc. | 4.52 | 31.00 | 1.4010 | 1.4010 | |||||
| CG / The Carlyle Group Inc. | 0.60 | 30.79 | 1.3917 | 1.3917 | |||||
| FDS / FactSet Research Systems Inc. | 0.06 | 74.42 | 26.14 | 71.59 | 1.1815 | 0.1475 | |||
| PWP / Perella Weinberg Partners | 1.34 | -26.21 | 26.11 | -22.12 | 1.1800 | -1.0954 | |||
| EBC / Eastern Bankshares, Inc. | 1.68 | 33.64 | 25.67 | 24.43 | 1.1602 | -0.2401 | |||
| DBRG / DigitalBridge Group, Inc. | 2.28 | 23.58 | 1.0657 | 1.0657 | |||||
| DAVE / Dave Inc. | 0.07 | 19.04 | 0.8604 | 0.8604 | |||||
| UPBD / Upbound Group, Inc. | 0.76 | 18.96 | 0.8570 | 0.8570 | |||||
| BGC / BGC Group, Inc. | 1.74 | 40.93 | 17.76 | 57.21 | 0.8027 | 0.0359 | |||
| OMF / OneMain Holdings, Inc. | 0.30 | -58.44 | 16.84 | -51.54 | 0.7611 | -1.5975 | |||
| BRBS / Blue Ridge Bankshares, Inc. | 4.41 | 49.28 | 15.82 | 64.40 | 0.7149 | 0.0618 | |||
| NCNO / nCino, Inc. | 0.56 | 333.38 | 15.80 | 341.26 | 0.7140 | 0.4710 | |||
| HLI / Houlihan Lokey, Inc. | 0.09 | 15.66 | 0.7077 | 0.7077 | |||||
| ETOR / eToro Group Ltd. | 0.19 | 12.83 | 0.5799 | 0.5799 | |||||
| HOOD / Robinhood Markets, Inc. | 0.11 | 10.16 | 0.4593 | 0.4593 | |||||
| TPG / TPG Inc. | 0.18 | 9.36 | 0.4233 | 0.4233 | |||||
| BULL / Webull Corporation | 0.77 | 9.22 | 0.4165 | 0.4165 | |||||
| UWMC / UWM Holdings Corporation | 2.18 | 9.03 | 0.4082 | 0.4082 | |||||
| COOP / Mr. Cooper Group Inc. | 0.06 | 8.92 | 0.4033 | 0.4033 | |||||
| CORZ / Core Scientific, Inc. | 0.51 | 8.64 | 0.3903 | 0.3903 | |||||
| LC / LendingClub Corporation | 0.67 | 8.03 | 0.3630 | 0.3630 | |||||
| PPBI / Pacific Premier Bancorp, Inc. | 0.17 | 3.51 | 0.1587 | 0.1587 | |||||
| FIBK / First Interstate BancSystem, Inc. | 0.08 | 2.24 | 0.1014 | 0.1014 | |||||
| AUB / Atlantic Union Bankshares Corporation | 0.07 | 2.23 | 0.1007 | 0.1007 | |||||
| DOUG / Douglas Elliman Inc. | 0.61 | 1.42 | 0.0641 | 0.0641 | |||||
| OBT / Orange County Bancorp, Inc. | 0.05 | 1.29 | 0.0584 | 0.0584 | |||||
| XLF / The Select Sector SPDR Trust - The Financial Select Sector SPDR Fund | 0.02 | 1.01 | 0.0455 | 0.0455 | |||||
| OBK / Origin Bancorp, Inc. | 0.02 | 0.58 | 0.0264 | 0.0264 | |||||
| VBTX / Veritex Holdings, Inc. | 0.02 | 0.58 | 0.0260 | 0.0260 | |||||
| FSUN / FirstSun Capital Bancorp | 0.02 | 0.52 | 0.0236 | 0.0236 | |||||
| PGC / Peapack-Gladstone Financial Corporation | 0.01 | 0.30 | 0.0136 | 0.0136 | |||||
| YORKU / Yorkville Acquisition Corp. - Debt/Equity Composite Units | 0.01 | 0.14 | 0.0061 | 0.0061 | |||||
| LPRO / Open Lending Corporation | 0.03 | 0.06 | 0.0028 | 0.0028 | |||||
| COF / Capital One Financial Corporation | 0.00 | -100.00 | 0.00 | 0.0000 | |||||
| RKT / Rocket Companies, Inc. | 0.00 | -100.00 | 0.00 | 0.0000 | |||||
| FISI / Financial Institutions, Inc. | 0.00 | -100.00 | 0.00 | 0.0000 | |||||
| PRG / PROG Holdings, Inc. | 0.00 | -100.00 | 0.00 | 0.0000 | |||||
| ASB / Associated Banc-Corp | 0.00 | -100.00 | 0.00 | 0.0000 | |||||
| NYCB / Flagstar Financial, Inc. | 0.00 | -100.00 | 0.00 | 0.0000 | |||||
| PYPL / PayPal Holdings, Inc. | 0.00 | -100.00 | 0.00 | 0.0000 | |||||
| RITM / Rithm Capital Corp. | 0.00 | -100.00 | 0.00 | 0.0000 | |||||
| IWM / iShares Trust - iShares Russell 2000 ETF | 0.00 | -100.00 | 0.00 | 0.0000 | |||||
| AMTB / Amerant Bancorp Inc. | 0.00 | -100.00 | 0.00 | 0.0000 | |||||
| MELI / MercadoLibre, Inc. | 0.00 | -100.00 | 0.00 | 0.0000 | |||||
| DCOM / Dime Community Bancshares, Inc. | 0.00 | -100.00 | 0.00 | 0.0000 | |||||
| FULT / Fulton Financial Corporation | 0.00 | -100.00 | 0.00 | 0.0000 | |||||
| DLO / DLocal Limited | 0.00 | -100.00 | 0.00 | 0.0000 | |||||
| EFSI / Eagle Financial Services, Inc. | 0.00 | -100.00 | 0.00 | 0.0000 | |||||
| FFWM / First Foundation Inc. | 0.00 | -100.00 | 0.00 | 0.0000 |