Mga Batayang Estadistika
| Nilai Portofolio | $ 159,287,000 |
| Posisi Saat Ini | 80 |
Kepemilikan Terbaru, Kinerja, AUM (dari 13F, 13D)
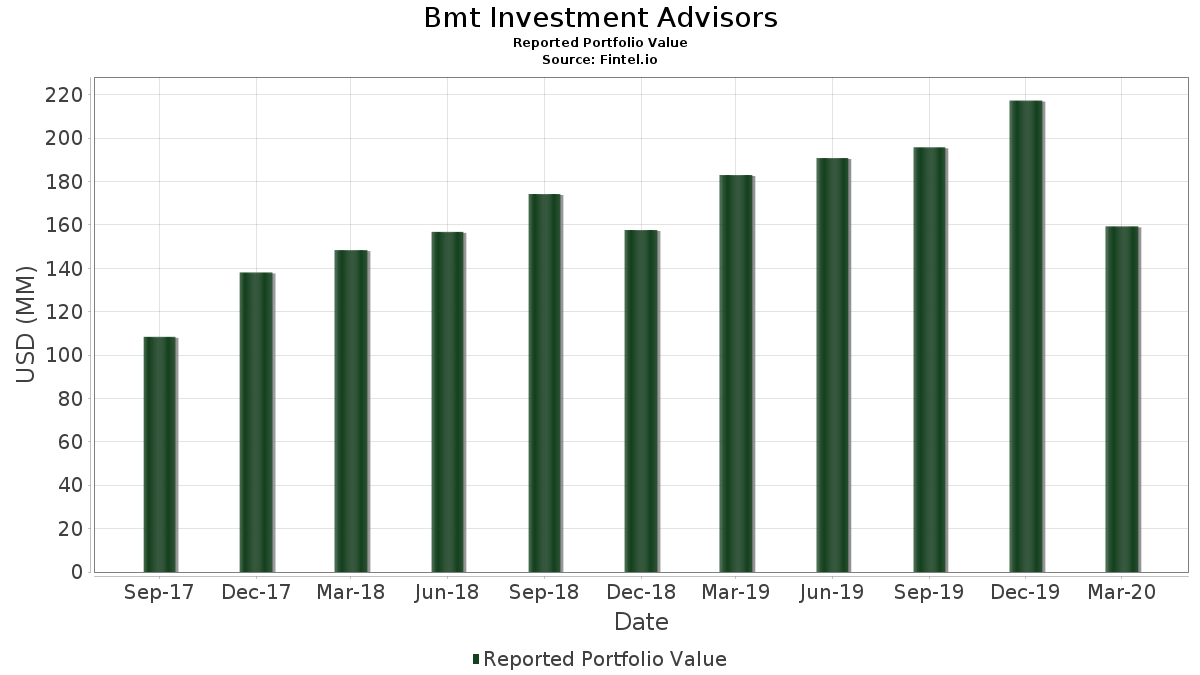
Bmt Investment Advisors telah mengungkapkan total kepemilikan 80 dalam pengajuan SEC terbaru mereka. Nilai portofolio terbaru dihitung sebesar $ 159,287,000 USD. Aset yang Dikelola (AUM) sebenarnya adalah nilai ini ditambah kas (yang tidak diungkapkan). Aset-aset utama Bmt Investment Advisors adalah Apple Inc. (US:AAPL) , Microsoft Corporation (US:MSFT) , Becton, Dickinson and Company (US:BDX) , JPMorgan Chase & Co. (US:JPM) , and Thermo Fisher Scientific Inc. (US:TMO) . Posisi baru Bmt Investment Advisors meliputi: Norwegian Cruise Line Holdings Ltd. (US:NCLH) , .
Peningkatan Tertinggi Kuartal Ini
Kami menggunakan perubahan dalam alokasi portofolio karena ini adalah metrik yang paling bermakna. Perubahan dapat disebabkan oleh perdagangan atau perubahan harga saham.
| Keamanan | Saham (MM) |
Nilai (Juta Dolar AS) |
Portfolio % | ΔPorsyento ng Portfolio |
|---|---|---|---|---|
| 0.07 | 2.11 | 1.3272 | 1.3272 | |
| 0.02 | 1.78 | 1.1156 | 1.1156 | |
| 0.03 | 5.20 | 3.2627 | 0.8706 | |
| 0.02 | 6.03 | 3.7869 | 0.5806 | |
| 0.06 | 2.87 | 1.8030 | 0.5244 | |
| 0.02 | 2.78 | 1.7459 | 0.4880 | |
| 0.02 | 3.96 | 2.4848 | 0.4661 | |
| 0.01 | 2.50 | 1.5676 | 0.3847 | |
| 0.04 | 0.61 | 0.3823 | 0.3823 | |
| 0.02 | 2.42 | 1.5186 | 0.3744 |
Penurunan Tertinggi Kuartal Ini
Kami menggunakan perubahan dalam alokasi portofolio karena ini adalah metrik yang paling bermakna. Perubahan dapat disebabkan oleh perdagangan atau perubahan harga saham.
| Keamanan | Saham (MM) |
Nilai (Juta Dolar AS) |
Portfolio % | ΔPorsyento ng Portfolio |
|---|---|---|---|---|
| 0.00 | 0.00 | -0.6729 | ||
| 0.02 | 0.59 | 0.3710 | -0.4570 | |
| 0.07 | 1.08 | 0.6812 | -0.4276 | |
| 0.04 | 1.69 | 1.0578 | -0.3957 | |
| 0.04 | 1.38 | 0.8689 | -0.3872 | |
| 0.03 | 1.45 | 0.9103 | -0.3766 | |
| 0.02 | 0.80 | 0.4991 | -0.3542 | |
| 0.05 | 1.48 | 0.9273 | -0.3472 | |
| 0.03 | 1.54 | 0.9687 | -0.3403 | |
| 0.02 | 1.14 | 0.7126 | -0.3332 |
Pengajuan 13F dan Dana
Formulir ini diajukan pada 2020-04-23 untuk periode pelaporan 2020-03-31. Klik ikon tautan untuk melihat riwayat transaksi selengkapnya.
Tingkatkan ke versi premium untuk membuka data premium dan ekspor ke Excel. ![]() .
.
| Keamanan | Ketik | Harga Saham Rata-rata | Saham (MM) |
ΔSaham (%) |
ΔSaham (%) |
Nilai ($MM) |
Portpolyo (%) |
ΔPortofolio (%) |
|
|---|---|---|---|---|---|---|---|---|---|
| AAPL / Apple Inc. | 0.02 | 0.00 | 6.03 | -13.41 | 3.7869 | 0.5806 | |||
| MSFT / Microsoft Corporation | 0.03 | 0.00 | 5.20 | 0.00 | 3.2627 | 0.8706 | |||
| BDX / Becton, Dickinson and Company | 0.02 | 6.82 | 3.96 | -9.76 | 2.4848 | 0.4661 | |||
| JPM / JPMorgan Chase & Co. | 0.04 | 0.00 | 3.89 | -35.41 | 2.4421 | -0.3301 | |||
| TMO / Thermo Fisher Scientific Inc. | 0.01 | -3.63 | 3.77 | -15.86 | 2.3649 | 0.3043 | |||
| MA / Mastercard Incorporated | 0.02 | 0.00 | 3.64 | -19.09 | 2.2877 | 0.2146 | |||
| CACI / CACI International Inc | 0.02 | 0.00 | 3.36 | -15.54 | 2.1094 | 0.2784 | |||
| HRL / Hormel Foods Corporation | 0.06 | 0.00 | 2.87 | 3.38 | 1.8030 | 0.5244 | |||
| HON / Honeywell International Inc. | 0.02 | 0.00 | 2.87 | -24.41 | 1.7999 | 0.0541 | |||
| TFX / Teleflex Incorporated | 0.01 | 0.00 | 2.85 | -22.20 | 1.7861 | 0.1029 | |||
| ABT / Abbott Laboratories | 0.04 | 0.00 | 2.81 | -9.16 | 1.7629 | 0.3401 | |||
| LHCG / LHC Group Inc | 0.02 | 0.00 | 2.78 | 1.76 | 1.7459 | 0.4880 | |||
| TJX / The TJX Companies, Inc. | 0.06 | 0.00 | 2.71 | -21.69 | 1.7020 | 0.1085 | |||
| SSB / SouthState Corporation | 0.05 | 3.56 | 2.68 | -29.88 | 1.6838 | -0.0768 | |||
| VZ / Verizon Communications Inc. | 0.05 | 0.00 | 2.68 | -12.52 | 1.6806 | 0.2722 | |||
| GOOG / Alphabet Inc. | 0.00 | 0.00 | 2.65 | -13.01 | 1.6618 | 0.2612 | |||
| SWKS / Skyworks Solutions, Inc. | 0.03 | 0.00 | 2.62 | -26.07 | 1.6448 | 0.0136 | |||
| SYK / Stryker Corporation | 0.02 | 0.00 | 2.60 | -20.68 | 1.6329 | 0.1237 | |||
| NDSN / Nordson Corporation | 0.02 | 0.00 | 2.58 | -17.06 | 1.6178 | 0.1878 | |||
| GPN / Global Payments Inc. | 0.02 | 0.00 | 2.52 | -20.99 | 1.5833 | 0.1141 | |||
| MASI / Masimo Corporation | 0.01 | -13.28 | 2.50 | -2.84 | 1.5676 | 0.3847 | |||
| AMGN / Amgen Inc. | 0.01 | 0.00 | 2.43 | -15.90 | 1.5237 | 0.1953 | |||
| AWK / American Water Works Company, Inc. | 0.02 | 0.00 | 2.42 | -2.70 | 1.5186 | 0.3744 | |||
| CSCO / Cisco Systems, Inc. | 0.06 | 0.00 | 2.41 | -18.04 | 1.5142 | 0.1597 | |||
| ADI / Analog Devices, Inc. | 0.03 | 0.00 | 2.39 | -24.57 | 1.4998 | 0.0421 | |||
| JNJ / Johnson & Johnson | 0.02 | 0.00 | 2.38 | -10.10 | 1.4973 | 0.2762 | |||
| UPS / United Parcel Service, Inc. | 0.02 | 0.00 | 2.33 | -20.20 | 1.4634 | 0.1189 | |||
| PEP / PepsiCo, Inc. | 0.02 | 0.00 | 2.25 | -12.12 | 1.4107 | 0.2337 | |||
| PAYX / Paychex, Inc. | 0.03 | 0.00 | 2.18 | -26.01 | 1.3699 | 0.0125 | |||
| CHD / Church & Dwight Co., Inc. | 0.03 | 0.00 | 2.14 | -8.75 | 1.3422 | 0.2638 | |||
| TFC / Truist Financial Corporation | 0.07 | 0.00 | 2.11 | -45.25 | 1.3272 | 1.3272 | |||
| CRUS / Cirrus Logic, Inc. | 0.03 | 0.00 | 2.09 | -20.35 | 1.3096 | 0.1041 | |||
| NSC / Norfolk Southern Corporation | 0.01 | 0.00 | 2.04 | -24.80 | 1.2832 | 0.0322 | |||
| AUB / Atlantic Union Bankshares Corporation | 0.09 | 2.21 | 2.02 | -40.37 | 1.2694 | -0.2914 | |||
| GLW / Corning Incorporated | 0.10 | 0.00 | 2.01 | -29.44 | 1.2638 | -0.0494 | |||
| JCI / Johnson Controls International plc | 0.07 | 0.00 | 2.01 | -33.77 | 1.2631 | -0.1352 | |||
| MMS / Maximus, Inc. | 0.03 | 0.00 | 2.00 | -21.77 | 1.2587 | 0.0791 | |||
| UFPI / UFP Industries, Inc. | 0.05 | 3.88 | 1.99 | -19.01 | 1.2493 | 0.1184 | |||
| BRC / Brady Corporation | 0.04 | 0.00 | 1.82 | -21.18 | 1.1445 | 0.0799 | |||
| CBOE / Cboe Global Markets, Inc. | 0.02 | 0.00 | 1.79 | -25.64 | 1.1250 | 0.0158 | |||
| LOW / Lowe's Companies, Inc. | 0.02 | 5.63 | 1.78 | -24.09 | 1.1156 | 1.1156 | |||
| LH / Labcorp Holdings Inc. | 0.01 | 0.00 | 1.77 | -25.30 | 1.1087 | 0.0206 | |||
| CAC / Camden National Corporation | 0.06 | 0.00 | 1.75 | -31.70 | 1.0999 | -0.0807 | |||
| BMI / Badger Meter, Inc. | 0.03 | 0.00 | 1.75 | -17.44 | 1.0993 | 0.1230 | |||
| SYY / Sysco Corporation | 0.04 | 0.00 | 1.69 | -46.64 | 1.0578 | -0.3957 | |||
| RJF / Raymond James Financial, Inc. | 0.03 | 0.00 | 1.65 | -29.34 | 1.0371 | -0.0390 | |||
| ABM / ABM Industries Incorporated | 0.07 | 0.00 | 1.63 | -35.41 | 1.0227 | -0.1381 | |||
| AMCR / Amcor plc | 0.20 | 0.00 | 1.63 | -25.08 | 1.0221 | 0.0219 | |||
| KMB / Kimberly-Clark Corporation | 0.01 | 0.00 | 1.62 | -7.00 | 1.0170 | 0.2152 | |||
| SXI / Standex International Corporation | 0.03 | 0.00 | 1.60 | -38.23 | 1.0032 | -0.1875 | |||
| US2296691064 / Cubic Corporation | 0.04 | 0.00 | 1.60 | -35.00 | 1.0026 | -0.1283 | |||
| MKC / McCormick & Company, Incorporated | 0.01 | 0.00 | 1.59 | -16.84 | 0.9982 | 0.1182 | |||
| PRU / Prudential Financial, Inc. | 0.03 | 0.00 | 1.56 | -44.37 | 0.9800 | -0.3115 | |||
| SXT / Sensient Technologies Corporation | 0.04 | 0.00 | 1.55 | -34.14 | 0.9762 | -0.1105 | |||
| VFC / V.F. Corporation | 0.03 | 0.00 | 1.54 | -45.75 | 0.9687 | -0.3403 | |||
| SCHW / The Charles Schwab Corporation | 0.05 | 0.00 | 1.52 | -29.33 | 0.9574 | -0.0359 | |||
| ASTE / Astec Industries, Inc. | 0.04 | 0.00 | 1.50 | -16.74 | 0.9430 | 0.1126 | |||
| WFC / Wells Fargo & Company | 0.05 | 0.00 | 1.48 | -46.66 | 0.9273 | -0.3472 | |||
| APTV / Aptiv PLC | 0.03 | 0.00 | 1.45 | -48.14 | 0.9103 | -0.3766 | |||
| CVX / Chevron Corporation | 0.02 | 0.00 | 1.40 | -39.88 | 0.8802 | -0.1932 | |||
| WSM / Williams-Sonoma, Inc. | 0.03 | 0.00 | 1.40 | -42.09 | 0.8802 | -0.2342 | |||
| MMSI / Merit Medical Systems, Inc. | 0.04 | 0.00 | 1.40 | 0.07 | 0.8758 | 0.2342 | |||
| HXL / Hexcel Corporation | 0.04 | 0.00 | 1.38 | -49.29 | 0.8689 | -0.3872 | |||
| KWR / Quaker Chemical Corporation | 0.01 | -4.03 | 1.29 | -26.36 | 0.8086 | 0.0036 | |||
| BC / Brunswick Corporation | 0.03 | 0.00 | 1.20 | -41.03 | 0.7552 | -0.1837 | |||
| USPH / U.S. Physical Therapy, Inc. | 0.02 | 0.00 | 1.19 | -39.68 | 0.7483 | -0.1612 | |||
| DOW / Dow Inc. | 0.03 | 89.98 | 1.15 | 0.88 | 0.7232 | 0.1976 | |||
| DRI / Darden Restaurants, Inc. | 0.02 | 0.00 | 1.14 | -50.04 | 0.7126 | -0.3332 | |||
| AAWW / Atlas Air Worldwide Holdings Inc. | 0.04 | 0.00 | 1.13 | -6.90 | 0.7113 | 0.1511 | |||
| WWW / Wolverine World Wide, Inc. | 0.07 | 0.00 | 1.08 | -54.96 | 0.6812 | -0.4276 | |||
| US5537771033 / MTS Systems Corporation | 0.04 | 0.00 | 0.83 | -53.17 | 0.5192 | -0.2937 | |||
| EOG / EOG Resources, Inc. | 0.02 | 0.00 | 0.80 | -57.12 | 0.4991 | -0.3542 | |||
| XOM / Exxon Mobil Corporation | 0.02 | 0.00 | 0.76 | -45.55 | 0.4759 | -0.1648 | |||
| DORM / Dorman Products, Inc. | 0.01 | 0.00 | 0.73 | -26.93 | 0.4564 | -0.0016 | |||
| MOS / The Mosaic Company | 0.06 | 0.00 | 0.64 | -50.04 | 0.3999 | -0.1869 | |||
| AEO / American Eagle Outfitters, Inc. | 0.08 | 0.00 | 0.62 | -45.93 | 0.3917 | -0.1394 | |||
| / ViacomCBS Inc | 0.04 | 0.00 | 0.61 | -66.61 | 0.3823 | 0.3823 | |||
| SPR / Spirit AeroSystems Holdings, Inc. | 0.02 | 0.00 | 0.59 | -67.15 | 0.3710 | -0.4570 | |||
| SLB / Schlumberger Limited | 0.04 | 15.25 | 0.57 | -61.31 | 0.3585 | -0.3209 | |||
| NCLH / Norwegian Cruise Line Holdings Ltd. | 0.03 | 0.33 | 0.2091 | 0.2091 | |||||
| AVT / Avnet, Inc. | 0.00 | -100.00 | 0.00 | -100.00 | -0.6729 |