Mga Batayang Estadistika
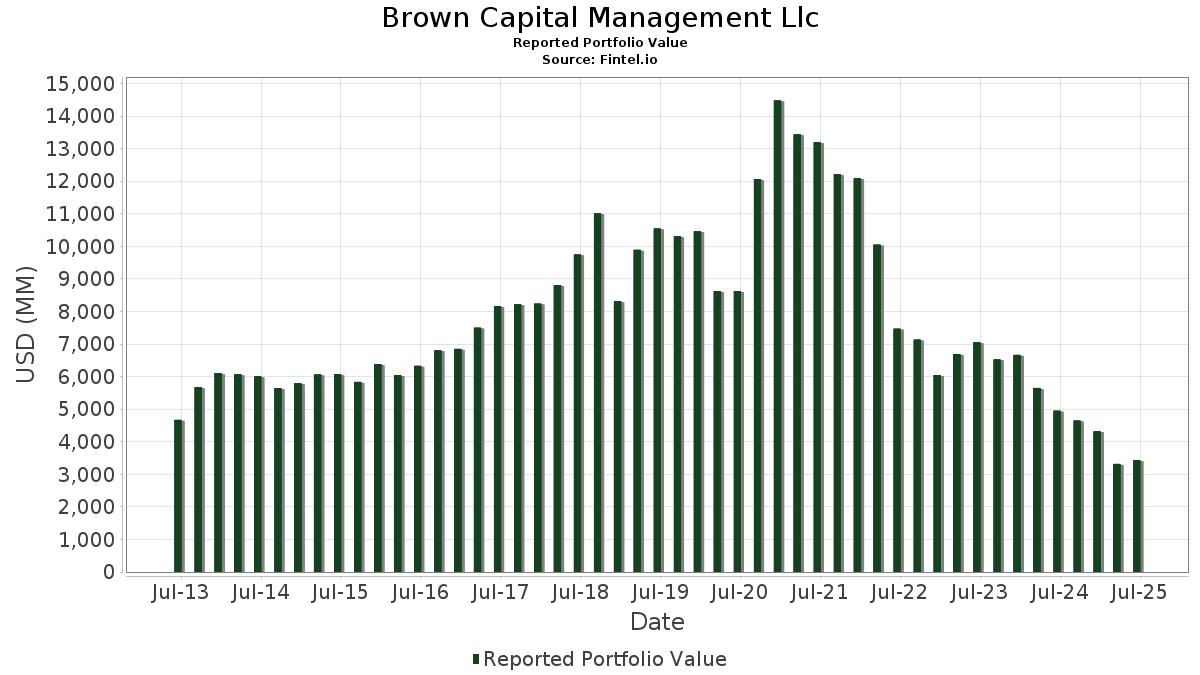
| Nilai Portofolio | $ 3,438,158,952 |
| Posisi Saat Ini | 83 |
Kepemilikan Terbaru, Kinerja, AUM (dari 13F, 13D)
Brown Capital Management Llc telah mengungkapkan total kepemilikan 83 dalam pengajuan SEC terbaru mereka. Nilai portofolio terbaru dihitung sebesar $ 3,438,158,952 USD. Aset yang Dikelola (AUM) sebenarnya adalah nilai ini ditambah kas (yang tidak diungkapkan). Aset-aset utama Brown Capital Management Llc adalah CyberArk Software Ltd. (US:CYBR) , Veeva Systems Inc. (US:VEEV) , Guidewire Software, Inc. (US:GWRE) , Datadog, Inc. (US:DDOG) , and Tyler Technologies, Inc. (US:TYL) . Industri unggulan Brown Capital Management Llc adalah "Home Furniture, Furnishings, And Equipment Stores" (sic 57) , "Petroleum Refining And Related Industries" (sic 29) , and "General Merchandise Stores" (sic 53) .
Peningkatan Tertinggi Kuartal Ini
Kami menggunakan perubahan dalam alokasi portofolio karena ini adalah metrik yang paling bermakna. Perubahan dapat disebabkan oleh perdagangan atau perubahan harga saham.
| Keamanan | Saham (MM) |
Nilai (Juta Dolar AS) |
Portfolio % | ΔPorsyento ng Portfolio |
|---|---|---|---|---|
| 0.59 | 242.05 | 7.0400 | 0.9720 | |
| 1.14 | 96.41 | 2.8041 | 0.8573 | |
| 0.45 | 60.49 | 1.7593 | 0.8100 | |
| 1.13 | 152.24 | 4.4279 | 0.7903 | |
| 1.43 | 50.47 | 1.4680 | 0.7664 | |
| 0.65 | 73.96 | 2.1513 | 0.7447 | |
| 2.94 | 99.46 | 2.8929 | 0.5544 | |
| 0.28 | 79.55 | 2.3137 | 0.4499 | |
| 6.56 | 58.39 | 1.6983 | 0.4228 | |
| 3.20 | 70.17 | 2.0409 | 0.3666 |
Penurunan Tertinggi Kuartal Ini
Kami menggunakan perubahan dalam alokasi portofolio karena ini adalah metrik yang paling bermakna. Perubahan dapat disebabkan oleh perdagangan atau perubahan harga saham.
| Keamanan | Saham (MM) |
Nilai (Juta Dolar AS) |
Portfolio % | ΔPorsyento ng Portfolio |
|---|---|---|---|---|
| 1.57 | 80.96 | 2.3548 | -0.5936 | |
| 2.81 | 119.65 | 3.4801 | -0.3961 | |
| 0.24 | 141.92 | 4.1278 | -0.3668 | |
| 2.48 | 31.69 | 0.9216 | -0.3217 | |
| 0.28 | 99.84 | 2.9038 | -0.3168 | |
| 0.37 | 47.68 | 1.3869 | -0.3047 | |
| 1.12 | 14.55 | 0.4232 | -0.2978 | |
| 1.56 | 33.44 | 0.9726 | -0.2676 | |
| 1.70 | 96.37 | 2.8030 | -0.2098 | |
| 0.18 | 26.11 | 0.7595 | -0.2007 |
Pengajuan 13D/G
Ini adalah daftar pengajuan 13D dan 13G yang dibuat dalam setahun terakhir (jika ada). Klik ikon tautan untuk melihat riwayat transaksi lengkap. Baris berwarna hijau menunjukkan posisi baru. Baris berwarna merah menunjukkan posisi yang sudah ditutup.
| Tanggal File | Formulir | Keamanan | Sebelumnya Saham |
Saat ini Saham |
ΔPersentase Saham | % Kepemilikan |
% ΔKepemilikan | |
|---|---|---|---|---|---|---|---|---|
| 2025-08-13 | XMTR / Xometry, Inc. | 3,446,223 | 2,943,593 | -14.58 | 5.98 | -16.60 | ||
| 2025-08-13 | CYRX / Cryoport, Inc. | 4,458,774 | 3,798,962 | -14.80 | 7.58 | -15.96 | ||
| 2025-05-15 | CTKB / Cytek Biosciences, Inc. | 9,493,474 | 7,463,967 | -21.38 | 5.89 | -18.42 | ||
| 2025-05-15 | ENFN / Enfusion, Inc. | 7,873,643 | 5,143,042 | -34.68 | 5.43 | -35.74 | ||
| 2025-05-15 | INGN / Inogen, Inc. | 1,560,409 | 0 | -100.00 | 0.00 | -100.00 | ||
| 2025-05-15 | VCEL / Vericel Corporation | 3,235,731 | 3,235,731 | 0.00 | 6.56 | 0.00 | ||
| 2025-05-15 | OLO / Olo Inc. | 8,022,158 | 8,022,158 | 0.00 | 7.18 | 0.00 | ||
| 2025-05-15 | ERII / Energy Recovery, Inc. | 1,530,748 | 2,919,453 | 90.72 | 5.04 | 9.57 | ||
| 2025-05-15 | KIDS / OrthoPediatrics Corp. | 1,882,405 | 1,882,405 | 0.00 | 7.77 | 0.00 | ||
| 2025-05-15 | ALRM / Alarm.com Holdings, Inc. | 2,392,630 | 2,392,630 | 0.00 | 4.84 | 0.00 | ||
| 2024-11-14 | GKOS / Glaukos Corporation | 2,697,794 | 1,634,591 | -39.41 | 2.97 | -46.29 | ||
| 2024-11-14 | APPF / AppFolio, Inc. | 1,585,560 | 804,645 | -49.25 | 3.50 | -52.25 | ||
| 2024-11-14 | HLIO / Helios Technologies, Inc. | 3,114,144 | 1,813,404 | -41.77 | 5.46 | -42.04 |
Pengajuan 13F dan Dana
Formulir ini diajukan pada 2025-08-13 untuk periode pelaporan 2025-06-30. Klik ikon tautan untuk melihat riwayat transaksi selengkapnya.
Tingkatkan ke versi premium untuk membuka data premium dan ekspor ke Excel. ![]() .
.
| Keamanan | Ketik | Harga Saham Rata-rata | Saham (MM) |
ΔSaham (%) |
ΔSaham (%) |
Nilai ($MM) |
Portpolyo (%) |
ΔPortofolio (%) |
|
|---|---|---|---|---|---|---|---|---|---|
| CYBR / CyberArk Software Ltd. | 0.59 | -0.12 | 242.05 | 20.23 | 7.0400 | 0.9720 | |||
| VEEV / Veeva Systems Inc. | 0.56 | -14.81 | 160.36 | 5.91 | 4.6642 | 0.1004 | |||
| GWRE / Guidewire Software, Inc. | 0.65 | -15.63 | 152.83 | 6.02 | 4.4452 | 0.1003 | |||
| DDOG / Datadog, Inc. | 1.13 | -6.84 | 152.24 | 26.14 | 4.4279 | 0.7903 | |||
| TYL / Tyler Technologies, Inc. | 0.24 | -6.67 | 141.92 | -4.83 | 4.1278 | -0.3668 | |||
| APPF / AppFolio, Inc. | 0.58 | -5.41 | 133.27 | -0.94 | 3.8763 | -0.1789 | |||
| MANH / Manhattan Associates, Inc. | 0.65 | -4.30 | 128.01 | 9.21 | 3.7231 | 0.1902 | |||
| RGEN / Repligen Corporation | 1.01 | 16.35 | 125.04 | 13.73 | 3.6367 | 0.3230 | |||
| VCEL / Vericel Corporation | 2.81 | -2.43 | 119.65 | -6.96 | 3.4801 | -0.3961 | |||
| GKOS / Glaukos Corporation | 1.14 | -4.48 | 117.66 | 0.24 | 3.4222 | -0.1156 | |||
| PAYC / Paycom Software, Inc. | 0.47 | -5.86 | 109.84 | -0.29 | 3.1946 | -0.1255 | |||
| QTWO / Q2 Holdings, Inc. | 1.15 | -7.52 | 107.97 | 8.17 | 3.1403 | 0.1319 | |||
| ANSS / ANSYS, Inc. | 0.28 | -15.78 | 99.84 | -6.56 | 2.9038 | -0.3168 | |||
| XMTR / Xometry, Inc. | 2.94 | -5.45 | 99.46 | 28.20 | 2.8929 | 0.5544 | |||
| CAMT / Camtek Ltd. | 1.14 | 3.49 | 96.41 | 49.27 | 2.8041 | 0.8573 | |||
| ALRM / Alarm.com Holdings, Inc. | 1.70 | -5.16 | 96.37 | -3.59 | 2.8030 | -0.2098 | |||
| TECH / Bio-Techne Corporation | 1.57 | -5.68 | 80.96 | -17.23 | 2.3548 | -0.5936 | |||
| FLUT / Flutter Entertainment plc | 0.28 | -0.26 | 79.55 | 28.65 | 2.3137 | 0.4499 | |||
| AGYS / Agilysys, Inc. | 0.65 | 0.29 | 73.96 | 58.49 | 2.1513 | 0.7447 | |||
| GLBE / Global-E Online Ltd. | 2.17 | 1.61 | 72.90 | -4.40 | 2.1203 | -0.1782 | |||
| CGNX / Cognex Corporation | 2.27 | -5.31 | 71.87 | 0.69 | 2.0904 | -0.0610 | |||
| CWAN / Clearwater Analytics Holdings, Inc. | 3.20 | 54.37 | 70.17 | 26.32 | 2.0409 | 0.3666 | |||
| MELI / MercadoLibre, Inc. | 0.02 | -9.14 | 63.67 | 21.73 | 1.8520 | 0.2753 | |||
| TMDX / TransMedics Group, Inc. | 0.45 | -3.58 | 60.49 | 92.06 | 1.7593 | 0.8100 | |||
| OLO / Olo Inc. | 6.56 | -6.36 | 58.39 | 37.98 | 1.6983 | 0.4228 | |||
| NCNO / nCino, Inc. | 2.06 | -5.53 | 57.61 | -3.81 | 1.6757 | -0.1296 | |||
| VERX / Vertex, Inc. | 1.43 | 114.85 | 50.47 | 116.84 | 1.4680 | 0.7664 | |||
| WK / Workiva Inc. | 0.70 | 0.94 | 48.05 | -8.98 | 1.3976 | -0.1936 | |||
| SHOP / Shopify Inc. | 0.42 | -1.87 | 47.96 | 18.66 | 1.3949 | 0.1767 | |||
| INSP / Inspire Medical Systems, Inc. | 0.37 | 4.29 | 47.68 | -15.04 | 1.3869 | -0.3047 | |||
| UFPT / UFP Technologies, Inc. | 0.17 | 11.41 | 41.71 | 34.86 | 1.2130 | 0.2809 | |||
| BMI / Badger Meter, Inc. | 0.16 | 15.77 | 40.09 | 49.06 | 1.1661 | 0.3554 | |||
| SPSC / SPS Commerce, Inc. | 0.26 | -2.06 | 35.56 | 0.42 | 1.0343 | -0.0331 | |||
| KIDS / OrthoPediatrics Corp. | 1.56 | -6.81 | 33.44 | -18.73 | 0.9726 | -0.2676 | |||
| DUOL / Duolingo, Inc. | 0.08 | 3.95 | 32.47 | 37.24 | 0.9444 | 0.2313 | |||
| MNDY / monday.com Ltd. | 0.10 | -1.47 | 32.08 | 27.42 | 0.9331 | 0.1742 | |||
| DV / DoubleVerify Holdings, Inc. | 2.13 | -5.10 | 31.85 | 6.25 | 0.9263 | 0.0229 | |||
| ERII / Energy Recovery, Inc. | 2.48 | -4.49 | 31.69 | -23.19 | 0.9216 | -0.3217 | |||
| CYRX / Cryoport, Inc. | 3.80 | -6.28 | 28.34 | 14.99 | 0.8243 | 0.0814 | |||
| ICLR / ICON Public Limited Company | 0.18 | -1.39 | 26.11 | -18.03 | 0.7595 | -0.2007 | |||
| CTKB / Cytek Biosciences, Inc. | 7.11 | -4.74 | 24.17 | -19.23 | 0.7031 | -0.1990 | |||
| RDVT / Red Violet, Inc. | 0.47 | 31.31 | 23.09 | 71.87 | 0.6716 | 0.2667 | |||
| TEAM / Atlassian Corporation | 0.11 | -1.57 | 22.09 | -5.80 | 0.6424 | -0.0643 | |||
| CHKP / Check Point Software Technologies Ltd. | 0.07 | -1.57 | 14.65 | -4.46 | 0.4260 | -0.0360 | |||
| RXST / RxSight, Inc. | 1.12 | 18.15 | 14.55 | -39.17 | 0.4232 | -0.2978 | |||
| TNDM / Tandem Diabetes Care, Inc. | 0.55 | -6.74 | 10.27 | -9.26 | 0.2988 | -0.0425 | |||
| PRO / PROS Holdings, Inc. | 0.53 | -14.88 | 8.26 | -29.95 | 0.2403 | -0.1152 | |||
| AAPL / Apple Inc. | 0.01 | -17.13 | 2.36 | -23.49 | 0.0687 | -0.0243 | |||
| MSFT / Microsoft Corporation | 0.00 | -58.60 | 2.12 | -45.15 | 0.0615 | -0.0547 | |||
| GOOGL / Alphabet Inc. | 0.01 | -23.15 | 2.00 | -12.43 | 0.0582 | -0.0107 | |||
| META / Meta Platforms, Inc. | 0.00 | -55.40 | 1.61 | -42.88 | 0.0468 | -0.0381 | |||
| AMZN / Amazon.com, Inc. | 0.01 | -33.97 | 1.52 | -23.85 | 0.0442 | -0.0160 | |||
| MA / Mastercard Incorporated | 0.00 | -20.86 | 0.99 | -18.87 | 0.0289 | -0.0080 | |||
| NVDA / NVIDIA Corporation | 0.01 | -40.78 | 0.96 | -13.72 | 0.0280 | -0.0056 | |||
| JPM / JPMorgan Chase & Co. | 0.00 | -16.70 | 0.67 | -1.47 | 0.0196 | -0.0010 | |||
| HD / The Home Depot, Inc. | 0.00 | -71.90 | 0.51 | -71.91 | 0.0149 | -0.0400 | |||
| PWR / Quanta Services, Inc. | 0.00 | -14.76 | 0.50 | 26.77 | 0.0146 | 0.0027 | |||
| CMG / Chipotle Mexican Grill, Inc. | 0.01 | -34.90 | 0.47 | -27.22 | 0.0136 | -0.0058 | |||
| HUBS / HubSpot, Inc. | 0.00 | -33.05 | 0.44 | -34.86 | 0.0129 | -0.0076 | |||
| FAST / Fastenal Company | 0.01 | 71.16 | 0.41 | -7.38 | 0.0121 | -0.0014 | |||
| ORCL / Oracle Corporation | 0.00 | -53.82 | 0.40 | -27.86 | 0.0118 | -0.0051 | |||
| FI / Fiserv, Inc. | 0.00 | -29.21 | 0.40 | -44.69 | 0.0117 | -0.0102 | |||
| TROW / T. Rowe Price Group, Inc. | 0.00 | -64.01 | 0.39 | -62.20 | 0.0114 | -0.0199 | |||
| ECL / Ecolab Inc. | 0.00 | -64.63 | 0.38 | -62.45 | 0.0112 | -0.0196 | |||
| PODD / Insulet Corporation | 0.00 | -39.13 | 0.36 | -27.11 | 0.0106 | -0.0045 | |||
| ADP / Automatic Data Processing, Inc. | 0.00 | -74.98 | 0.35 | -74.77 | 0.0103 | -0.0318 | |||
| SBUX / Starbucks Corporation | 0.00 | -13.65 | 0.31 | -19.43 | 0.0091 | -0.0026 | |||
| ADBE / Adobe Inc. | 0.00 | -26.64 | 0.31 | -26.09 | 0.0089 | -0.0036 | |||
| DRI / Darden Restaurants, Inc. | 0.00 | -7.64 | 0.30 | -2.88 | 0.0088 | -0.0006 | |||
| ADSK / Autodesk, Inc. | 0.00 | -35.38 | 0.29 | -23.73 | 0.0083 | -0.0030 | |||
| WEC / WEC Energy Group, Inc. | 0.00 | -69.20 | 0.27 | -70.54 | 0.0078 | -0.0197 | |||
| MTB / M&T Bank Corporation | 0.00 | -7.89 | 0.25 | 0.00 | 0.0074 | -0.0003 | |||
| PAYX / Paychex, Inc. | 0.00 | -14.53 | 0.25 | -19.49 | 0.0073 | -0.0021 | |||
| PEP / PepsiCo, Inc. | 0.00 | -66.55 | 0.24 | -70.63 | 0.0071 | -0.0178 | |||
| TJX / The TJX Companies, Inc. | 0.00 | -7.24 | 0.24 | -5.95 | 0.0069 | -0.0007 | |||
| CRM / Salesforce, Inc. | 0.00 | -31.39 | 0.23 | -30.45 | 0.0068 | -0.0033 | |||
| MCD / McDonald's Corporation | 0.00 | -77.12 | 0.23 | -78.68 | 0.0067 | -0.0257 | |||
| SYY / Sysco Corporation | 0.00 | -63.65 | 0.23 | -63.30 | 0.0067 | -0.0122 | |||
| PG / The Procter & Gamble Company | 0.00 | -71.38 | 0.22 | -73.25 | 0.0063 | -0.0182 | |||
| HRB / H&R Block, Inc. | 0.00 | -6.54 | 0.21 | -6.96 | 0.0063 | -0.0007 | |||
| SNA / Snap-on Incorporated | 0.00 | -9.57 | 0.21 | -16.80 | 0.0061 | -0.0015 | |||
| TXN / Texas Instruments Incorporated | 0.00 | 0.20 | 0.0059 | 0.0059 | |||||
| APD / Air Products and Chemicals, Inc. | 0.00 | -10.20 | 0.20 | -14.35 | 0.0059 | -0.0012 | |||
| TGT / Target Corporation | 0.00 | -100.00 | 0.00 | 0.0000 | |||||
| ITW / Illinois Tool Works Inc. | 0.00 | -100.00 | 0.00 | 0.0000 | |||||
| EW / Edwards Lifesciences Corporation | 0.00 | -100.00 | 0.00 | 0.0000 | |||||
| HLIO / Helios Technologies, Inc. | 0.00 | -100.00 | 0.00 | 0.0000 | |||||
| JNJ / Johnson & Johnson | 0.00 | -100.00 | 0.00 | 0.0000 | |||||
| SCHW / The Charles Schwab Corporation | 0.00 | -100.00 | 0.00 | 0.0000 | |||||
| DKS / DICK'S Sporting Goods, Inc. | 0.00 | -100.00 | 0.00 | 0.0000 | |||||
| MRK / Merck & Co., Inc. | 0.00 | -100.00 | 0.00 | 0.0000 | |||||
| CRL / Charles River Laboratories International, Inc. | 0.00 | -100.00 | 0.00 | 0.0000 | |||||
| PM / Philip Morris International Inc. | 0.00 | -100.00 | 0.00 | 0.0000 | |||||
| TSCO / Tractor Supply Company | 0.00 | -100.00 | 0.00 | 0.0000 | |||||
| BOH / Bank of Hawaii Corporation | 0.00 | -100.00 | 0.00 | 0.0000 | |||||
| BR / Broadridge Financial Solutions, Inc. | 0.00 | -100.00 | 0.00 | 0.0000 | |||||
| ENFN / Enfusion, Inc. | 0.00 | -100.00 | 0.00 | 0.0000 | |||||
| ABBV / AbbVie Inc. | 0.00 | -100.00 | 0.00 | 0.0000 | |||||
| ABT / Abbott Laboratories | 0.00 | -100.00 | 0.00 | 0.0000 | |||||
| MS / Morgan Stanley | 0.00 | -100.00 | 0.00 | 0.0000 | |||||
| UNH / UnitedHealth Group Incorporated | 0.00 | -100.00 | 0.00 | 0.0000 | |||||
| YORW / The York Water Company | 0.00 | -100.00 | 0.00 | 0.0000 | |||||
| UPS / United Parcel Service, Inc. | 0.00 | -100.00 | 0.00 | 0.0000 | |||||
| FICO / Fair Isaac Corporation | 0.00 | -100.00 | 0.00 | 0.0000 | |||||
| GWW / W.W. Grainger, Inc. | 0.00 | -100.00 | 0.00 | 0.0000 | |||||
| VICR / Vicor Corporation | 0.00 | -100.00 | 0.00 | 0.0000 |