Mga Batayang Estadistika
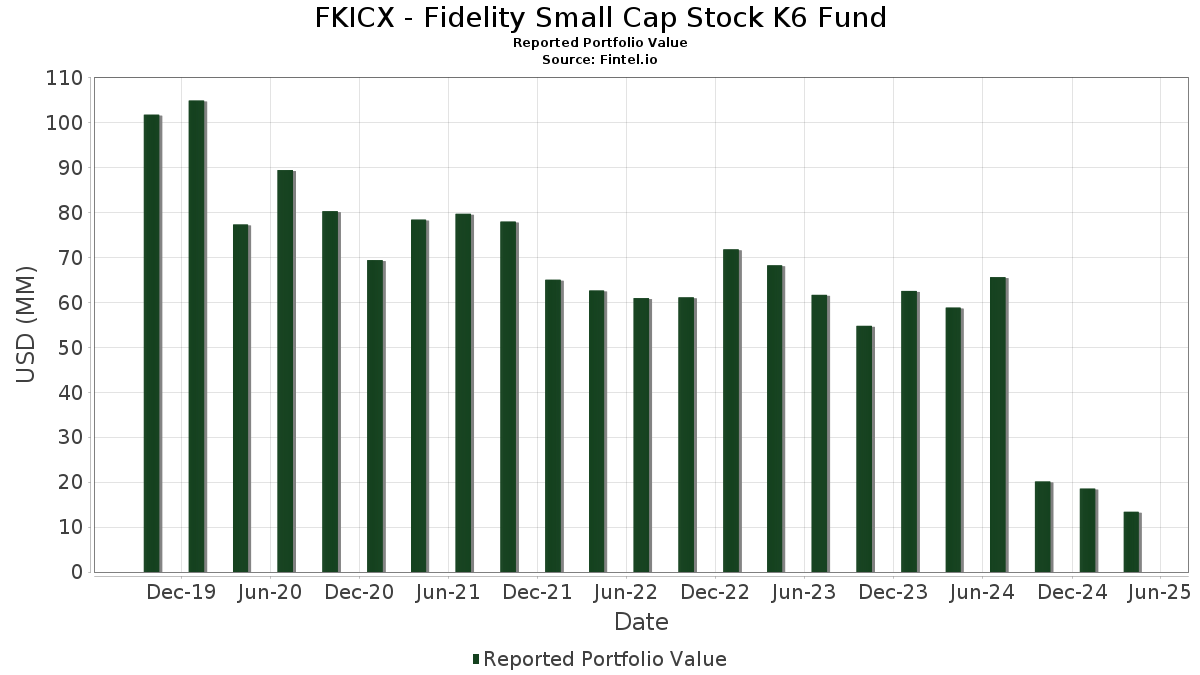
| Nilai Portofolio | $ 13,395,613 |
| Posisi Saat Ini | 124 |
Kepemilikan Terbaru, Kinerja, AUM (dari 13F, 13D)
FKICX - Fidelity Small Cap Stock K6 Fund telah mengungkapkan total kepemilikan 124 dalam pengajuan SEC terbaru mereka. Nilai portofolio terbaru dihitung sebesar $ 13,395,613 USD. Aset yang Dikelola (AUM) sebenarnya adalah nilai ini ditambah kas (yang tidak diungkapkan). Aset-aset utama FKICX - Fidelity Small Cap Stock K6 Fund adalah Fidelity Securities Lending Cash Central Fund (US:US31635A3032) , Performance Food Group Company (US:PFGC) , FirstCash Holdings, Inc. (US:FCFS) , The Baldwin Insurance Group, Inc. (US:BWIN) , and Grand Canyon Education, Inc. (US:LOPE) . Posisi baru FKICX - Fidelity Small Cap Stock K6 Fund meliputi: MarketAxess Holdings Inc. (US:MKTX) , Webster Financial Corporation (US:WBS) , Element Solutions Inc (US:ESI) , Chart Industries, Inc. (US:GTLS) , and Abercrombie & Fitch Co. (US:ANF) .
Peningkatan Tertinggi Kuartal Ini
Kami menggunakan perubahan dalam alokasi portofolio karena ini adalah metrik yang paling bermakna. Perubahan dapat disebabkan oleh perdagangan atau perubahan harga saham.
| Keamanan | Saham (MM) |
Nilai (Juta Dolar AS) |
Portfolio % | ΔPorsyento ng Portfolio |
|---|---|---|---|---|
| 1.40 | 1.40 | 11.6473 | 4.7361 | |
| 0.00 | 0.26 | 2.1609 | 2.0520 | |
| 0.21 | 0.21 | 1.7762 | 1.6112 | |
| 0.00 | 0.17 | 1.3964 | 1.3964 | |
| 0.00 | 0.23 | 1.9414 | 1.1805 | |
| 0.00 | 0.13 | 1.0524 | 1.0524 | |
| 0.01 | 0.15 | 1.2421 | 0.9928 | |
| 0.01 | 0.28 | 2.3201 | 0.8940 | |
| 0.00 | 0.10 | 0.8134 | 0.8134 | |
| 0.00 | 0.09 | 0.7676 | 0.7676 |
Penurunan Tertinggi Kuartal Ini
Kami menggunakan perubahan dalam alokasi portofolio karena ini adalah metrik yang paling bermakna. Perubahan dapat disebabkan oleh perdagangan atau perubahan harga saham.
| Keamanan | Saham (MM) |
Nilai (Juta Dolar AS) |
Portfolio % | ΔPorsyento ng Portfolio |
|---|---|---|---|---|
| 0.00 | 0.05 | 0.3932 | -2.0018 | |
| 0.00 | 0.10 | 0.8707 | -1.1952 | |
| 0.00 | 0.03 | 0.2298 | -1.1536 | |
| 0.00 | 0.13 | 1.1056 | -1.0555 | |
| 0.00 | 0.00 | -0.6617 | ||
| 0.00 | 0.06 | 0.5205 | -0.6491 | |
| 0.00 | 0.18 | 1.5078 | -0.6411 | |
| 0.03 | 0.06 | 0.4658 | -0.6208 | |
| 0.00 | 0.00 | -0.5965 | ||
| 0.00 | 0.02 | 0.1573 | -0.5587 |
Pengajuan 13F dan Dana
Formulir ini diajukan pada 2025-06-26 untuk periode pelaporan 2025-04-30. Klik ikon tautan untuk melihat riwayat transaksi selengkapnya.
Tingkatkan ke versi premium untuk membuka data premium dan ekspor ke Excel. ![]() .
.
| Keamanan | Ketik | Harga Saham Rata-rata | Saham (MM) |
ΔSaham (%) |
ΔSaham (%) |
Nilai ($MM) |
Portpolyo (%) |
ΔPortofolio (%) |
|
|---|---|---|---|---|---|---|---|---|---|
| US31635A3032 / Fidelity Securities Lending Cash Central Fund | 1.40 | 17.89 | 1.40 | 17.82 | 11.6473 | 4.7361 | |||
| PFGC / Performance Food Group Company | 0.00 | -27.84 | 0.39 | -35.60 | 3.2338 | -0.2761 | |||
| FCFS / FirstCash Holdings, Inc. | 0.00 | -31.84 | 0.32 | -16.49 | 2.6948 | 0.4413 | |||
| BWIN / The Baldwin Insurance Group, Inc. | 0.01 | -37.53 | 0.32 | -36.63 | 2.6624 | -0.2707 | |||
| LOPE / Grand Canyon Education, Inc. | 0.00 | -39.60 | 0.28 | -38.74 | 2.3531 | -0.3307 | |||
| G / Genpact Limited | 0.01 | 10.25 | 0.28 | 13.88 | 2.3201 | 0.8940 | |||
| LITE / Lumentum Holdings Inc. | 0.00 | -4.95 | 0.26 | -34.26 | 2.1749 | -0.1311 | |||
| SNX / TD SYNNEX Corporation | 0.00 | 273.45 | 0.26 | 312.70 | 2.1609 | 2.0520 | |||
| LAUR / Laureate Education, Inc. | 0.01 | -21.35 | 0.25 | -15.81 | 2.0409 | 0.3478 | |||
| IWM / iShares Trust - iShares Russell 2000 ETF | 0.00 | -45.45 | 0.23 | -52.64 | 1.9414 | 1.1805 | |||
| IESC / IES Holdings, Inc. | 0.00 | 7.93 | 0.23 | -4.17 | 1.9121 | 0.5178 | |||
| PRI / Primerica, Inc. | 0.00 | -18.65 | 0.22 | -26.58 | 1.8407 | 0.0881 | |||
| US31635A1051 / Fidelity Cash Central Fund | 0.21 | 558.07 | 0.21 | 565.63 | 1.7762 | 1.6112 | |||
| CHE / Chemed Corporation | 0.00 | 11.56 | 0.19 | 15.15 | 1.5836 | 0.6240 | |||
| CROX / Crocs, Inc. | 0.00 | -10.72 | 0.19 | -15.38 | 1.5530 | 0.2649 | |||
| SSB / SouthState Corporation | 0.00 | -12.68 | 0.18 | -28.35 | 1.5137 | 0.0383 | |||
| SIGI / Selective Insurance Group, Inc. | 0.00 | -52.66 | 0.18 | -51.08 | 1.5078 | -0.6411 | |||
| CBZ / CBIZ, Inc. | 0.00 | 33.21 | 0.18 | 5.39 | 1.4695 | 0.4971 | |||
| MKTX / MarketAxess Holdings Inc. | 0.00 | 0.17 | 1.3964 | 1.3964 | |||||
| BOOT / Boot Barn Holdings, Inc. | 0.00 | 24.20 | 0.17 | -19.32 | 1.3869 | 0.1827 | |||
| EBC / Eastern Bankshares, Inc. | 0.01 | -21.49 | 0.16 | -36.11 | 1.3381 | -0.1291 | |||
| VEC / V2X Inc | 0.00 | 6.44 | 0.16 | 1.28 | 1.3179 | 0.4105 | |||
| CRS / Carpenter Technology Corporation | 0.00 | 15.74 | 0.16 | 17.91 | 1.3138 | 0.5301 | |||
| CNR / Core Natural Resources, Inc. | 0.00 | 60.47 | 0.15 | 28.57 | 1.2728 | 0.5786 | |||
| WNS / WNS (Holdings) Limited | 0.00 | 21.54 | 0.15 | 19.84 | 1.2587 | 0.5255 | |||
| ONB / Old National Bancorp | 0.01 | 303.67 | 0.15 | 254.76 | 1.2421 | 0.9928 | |||
| IBP / Installed Building Products, Inc. | 0.00 | 70.69 | 0.14 | 42.00 | 1.1868 | 0.6036 | |||
| FN / Fabrinet | 0.00 | 52.64 | 0.14 | 44.90 | 1.1798 | 0.6097 | |||
| EVTC / EVERTEC, Inc. | 0.00 | -19.97 | 0.14 | -16.36 | 1.1494 | 0.1882 | |||
| NSIT / Insight Enterprises, Inc. | 0.00 | -55.29 | 0.13 | -64.25 | 1.1056 | -1.0555 | |||
| GPOR / Gulfport Energy Corporation | 0.00 | -21.19 | 0.13 | -24.14 | 1.1028 | 0.0899 | |||
| ROAD / Construction Partners, Inc. | 0.00 | 6.05 | 0.13 | 8.40 | 1.0761 | 0.3813 | |||
| CLBT / Cellebrite DI Ltd. | 0.01 | -11.61 | 0.13 | -27.43 | 1.0604 | 0.0409 | |||
| SF / Stifel Financial Corp. | 0.00 | 2.13 | 0.13 | -24.40 | 1.0558 | 0.0781 | |||
| WBS / Webster Financial Corporation | 0.00 | 0.13 | 1.0524 | 1.0524 | |||||
| EXP / Eagle Materials Inc. | 0.00 | -22.36 | 0.13 | -31.52 | 1.0507 | -0.0229 | |||
| WAL / Western Alliance Bancorporation | 0.00 | -79.71 | 0.13 | -74.44 | 1.0418 | 0.5463 | |||
| KGS / Kodiak Gas Services, Inc. | 0.00 | -3.23 | 0.11 | -29.37 | 0.9383 | 0.0053 | |||
| ENSG / The Ensign Group, Inc. | 0.00 | 147.71 | 0.11 | 131.25 | 0.9285 | 0.6446 | |||
| HALO / Halozyme Therapeutics, Inc. | 0.00 | -2.07 | 0.11 | 6.80 | 0.9163 | 0.3127 | |||
| LSDAF / Lassonde Industries Inc. | 0.00 | 25.74 | 0.11 | 50.70 | 0.8962 | 0.4807 | |||
| SWX / Southwest Gas Holdings, Inc. | 0.00 | -31.41 | 0.11 | -33.54 | 0.8903 | -0.0487 | |||
| EXLS / ExlService Holdings, Inc. | 0.00 | -22.44 | 0.11 | -25.17 | 0.8891 | 0.0578 | |||
| CDRE / Cadre Holdings, Inc. | 0.00 | 9.25 | 0.11 | -17.19 | 0.8804 | 0.1349 | |||
| BIPC / Brookfield Infrastructure Corporation | 0.00 | -67.15 | 0.10 | -70.70 | 0.8707 | -1.1952 | |||
| YETI / YETI Holdings, Inc. | 0.00 | -25.20 | 0.10 | -42.70 | 0.8498 | -0.1874 | |||
| TPB / Turning Point Brands, Inc. | 0.00 | 12.21 | 0.10 | 8.60 | 0.8429 | 0.2972 | |||
| SNV / Synovus Financial Corp. | 0.00 | -7.24 | 0.10 | -28.87 | 0.8427 | 0.0150 | |||
| TMDX / TransMedics Group, Inc. | 0.00 | 82.17 | 0.10 | 150.00 | 0.8349 | 0.5996 | |||
| ESI / Element Solutions Inc | 0.00 | 0.10 | 0.8134 | 0.8134 | |||||
| MMSI / Merit Medical Systems, Inc. | 0.00 | -27.40 | 0.10 | -37.42 | 0.8124 | -0.0900 | |||
| TGLS / Tecnoglass Inc. | 0.00 | -27.66 | 0.10 | -32.39 | 0.8018 | -0.0250 | |||
| HWKN / Hawkins, Inc. | 0.00 | -34.49 | 0.10 | -25.58 | 0.8008 | 0.0501 | |||
| SANM / Sanmina Corporation | 0.00 | -13.63 | 0.10 | -20.83 | 0.7918 | 0.0925 | |||
| PENG / Penguin Solutions, Inc. | 0.01 | -20.49 | 0.10 | -33.10 | 0.7894 | -0.0357 | |||
| AKR / Acadia Realty Trust | 0.00 | -19.06 | 0.09 | -33.33 | 0.7878 | -0.0335 | |||
| GTLS / Chart Industries, Inc. | 0.00 | 0.09 | 0.7676 | 0.7676 | |||||
| CTRI / Centuri Holdings, Inc. | 0.00 | 68.28 | 0.09 | 37.50 | 0.7317 | 0.3544 | |||
| R / Ryder System, Inc. | 0.00 | -35.17 | 0.08 | -44.00 | 0.6995 | -0.1745 | |||
| DRS / Leonardo DRS, Inc. | 0.00 | -62.44 | 0.08 | -60.77 | 0.6855 | -0.5287 | |||
| CNOB / ConnectOne Bancorp, Inc. | 0.00 | -38.26 | 0.08 | -45.58 | 0.6723 | -0.1844 | |||
| ANF / Abercrombie & Fitch Co. | 0.00 | 0.08 | 0.6686 | 0.6686 | |||||
| WEAV / Weave Communications, Inc. | 0.01 | 48.66 | 0.08 | -3.66 | 0.6606 | 0.1820 | |||
| WHD / Cactus, Inc. | 0.00 | -6.31 | 0.08 | -40.31 | 0.6404 | -0.1121 | |||
| SIMO / Silicon Motion Technology Corporation - Depositary Receipt (Common Stock) | 0.00 | -49.36 | 0.07 | -54.05 | 0.5675 | -0.2974 | |||
| REVG / REV Group, Inc. | 0.00 | -21.92 | 0.07 | -26.37 | 0.5601 | 0.0276 | |||
| ADMA / ADMA Biologics, Inc. | 0.00 | -14.09 | 0.07 | 26.92 | 0.5531 | 0.2475 | |||
| BYCRF / Baycurrent, Inc. | 0.00 | -21.38 | 0.07 | 0.00 | 0.5413 | 0.1602 | |||
| LMN / Lumine Group Inc. | 0.00 | 110.54 | 0.06 | 162.50 | 0.5307 | 0.3860 | |||
| KBR / KBR, Inc. | 0.00 | 0.06 | 0.5261 | 0.5261 | |||||
| GPS / The Gap, Inc. | 0.00 | 0.06 | 0.5255 | 0.5255 | |||||
| TRNO / Terreno Realty Corporation | 0.00 | -15.99 | 0.06 | -27.59 | 0.5233 | 0.0172 | |||
| PIPR / Piper Sandler Companies | 0.00 | -59.06 | 0.06 | -69.15 | 0.5205 | -0.6491 | |||
| MASI / Masimo Corporation | 0.00 | -21.34 | 0.06 | -27.06 | 0.5172 | 0.0193 | |||
| SKT / Tanger Inc. | 0.00 | -21.40 | 0.06 | -24.39 | 0.5159 | 0.0376 | |||
| PWP / Perella Weinberg Partners | 0.00 | 138.55 | 0.06 | 60.53 | 0.5125 | 0.2865 | |||
| CIEN / Ciena Corporation | 0.00 | -52.01 | 0.06 | -63.25 | 0.5113 | -0.4558 | |||
| CPRX / Catalyst Pharmaceuticals, Inc. | 0.00 | 0.06 | 0.5044 | 0.5044 | |||||
| CTRE / CareTrust REIT, Inc. | 0.00 | -27.55 | 0.06 | -20.00 | 0.5035 | 0.0633 | |||
| ASGN / ASGN Incorporated | 0.00 | 0.06 | 0.5019 | 0.5019 | |||||
| FNB / F.N.B. Corporation | 0.00 | 0.06 | 0.4891 | 0.4891 | |||||
| PRM / Perimeter Solutions, Inc. | 0.01 | 0.06 | 0.4878 | 0.4878 | |||||
| PEN / Penumbra, Inc. | 0.00 | -21.14 | 0.06 | -13.85 | 0.4717 | 0.0902 | |||
| FCPT / Four Corners Property Trust, Inc. | 0.00 | -5.04 | 0.06 | -3.45 | 0.4674 | 0.1295 | |||
| KRKNF / Kraken Robotics Inc. | 0.03 | -69.47 | 0.06 | -70.05 | 0.4658 | -0.6208 | |||
| CVBF / CVB Financial Corp. | 0.00 | 0.06 | 0.4618 | 0.4618 | |||||
| PAR / PAR Technology Corporation | 0.00 | -47.94 | 0.05 | -58.46 | 0.4543 | -0.3045 | |||
| TPH / Tri Pointe Homes, Inc. | 0.00 | -82.38 | 0.05 | -67.31 | 0.4284 | 0.2220 | |||
| SHOO / Steven Madden, Ltd. | 0.00 | 0.05 | 0.4109 | 0.4109 | |||||
| BTSG / BrightSpring Health Services, Inc. | 0.00 | -23.18 | 0.05 | -43.02 | 0.4096 | -0.0925 | |||
| UFPI / UFP Industries, Inc. | 0.00 | 0.05 | 0.3948 | 0.3948 | |||||
| MUSA / Murphy USA Inc. | 0.00 | -88.41 | 0.05 | -88.59 | 0.3932 | -2.0018 | |||
| NUVL / Nuvalent, Inc. | 0.00 | 0.05 | 0.3766 | 0.3766 | |||||
| ULS / UL Solutions Inc. | 0.00 | 7.06 | 0.05 | 15.38 | 0.3746 | 0.1439 | |||
| TXNM / TXNM Energy, Inc. | 0.00 | -46.29 | 0.04 | -41.10 | 0.3609 | -0.0662 | |||
| ARCB / ArcBest Corporation | 0.00 | -66.67 | 0.04 | -84.85 | 0.3401 | -0.0688 | |||
| PRSU / Pursuit Attractions and Hospitality, Inc. | 0.00 | 220.00 | 0.04 | 143.75 | 0.3268 | 0.2305 | |||
| CRNX / Crinetics Pharmaceuticals, Inc. | 0.00 | -9.67 | 0.04 | -24.00 | 0.3160 | 0.0207 | |||
| CRY / Artivion Inc | 0.00 | 156.83 | 0.04 | 100.00 | 0.3031 | 0.1952 | |||
| CBLL / CeriBell, Inc. | 0.00 | -3.65 | 0.04 | -33.33 | 0.3028 | -0.0116 | |||
| ASMDEE B / Asmodee Group AB (publ) | 0.00 | 0.04 | 0.3019 | 0.3019 | |||||
| PCVX / Vaxcyte, Inc. | 0.00 | -3.19 | 0.03 | -61.36 | 0.2889 | -0.2256 | |||
| SOBO / South Bow Corporation | 0.00 | -32.70 | 0.03 | -30.43 | 0.2668 | -0.0019 | |||
| NXSN / NextVision Stabilized Systems, Ltd. | 0.00 | -45.86 | 0.03 | -22.50 | 0.2598 | 0.0223 | |||
| NOG / Northern Oil and Gas, Inc. | 0.00 | -82.81 | 0.03 | -88.66 | 0.2298 | -1.1536 | |||
| OLO / Olo Inc. | 0.00 | -72.20 | 0.02 | -77.45 | 0.1981 | -0.3954 | |||
| KBH / KB Home | 0.00 | 0.02 | 0.1938 | 0.1938 | |||||
| ELVN / Enliven Therapeutics, Inc. | 0.00 | -21.35 | 0.02 | -31.25 | 0.1865 | -0.0050 | |||
| CLDX / Celldex Therapeutics, Inc. | 0.00 | -7.02 | 0.02 | -21.43 | 0.1856 | 0.0214 | |||
| IMVT / Immunovant, Inc. | 0.00 | 24.15 | 0.02 | -8.33 | 0.1854 | 0.0448 | |||
| TENB / Tenable Holdings, Inc. | 0.00 | -74.15 | 0.02 | -81.90 | 0.1777 | -0.5000 | |||
| XENE / Xenon Pharmaceuticals Inc. | 0.00 | -23.16 | 0.02 | -26.92 | 0.1589 | 0.0075 | |||
| CTOS / Custom Truck One Source, Inc. | 0.00 | -92.46 | 0.02 | -95.82 | 0.1573 | -0.5587 | |||
| VRDN / Viridian Therapeutics, Inc. | 0.00 | -21.35 | 0.02 | -45.45 | 0.1509 | -0.0410 | |||
| MLI / Mueller Industries, Inc. | 0.00 | -81.40 | 0.02 | -83.50 | 0.1490 | -0.4510 | |||
| DNTH / Dianthus Therapeutics, Inc. | 0.00 | 0.02 | 0.1455 | 0.1455 | |||||
| MLTX / MoonLake Immunotherapeutics | 0.00 | -21.29 | 0.02 | -29.17 | 0.1446 | 0.0041 | |||
| MRUS / Merus N.V. | 0.00 | -21.23 | 0.02 | -15.79 | 0.1402 | 0.0282 | |||
| UPB / Upstream Bio, Inc. | 0.00 | 0.01 | 0.1167 | 0.1167 | |||||
| GPCR / Structure Therapeutics Inc. - Depositary Receipt (Common Stock) | 0.00 | 33.14 | 0.01 | 20.00 | 0.1045 | 0.0435 | |||
| VKTX / Viking Therapeutics, Inc. | 0.00 | -45.30 | 0.01 | -52.00 | 0.1004 | -0.0453 | |||
| SYRE / Spyre Therapeutics, Inc. | 0.00 | -21.34 | 0.01 | -47.62 | 0.0937 | -0.0321 | |||
| NRIX / Nurix Therapeutics, Inc. | 0.00 | 0.01 | 0.0909 | 0.0909 | |||||
| COGT / Cogent Biosciences, Inc. | 0.00 | -45.88 | 0.01 | -70.83 | 0.0609 | -0.0797 | |||
| RDNT / RadNet, Inc. | 0.00 | -100.00 | 0.00 | -100.00 | -0.1521 | ||||
| INFA / Informatica Inc. | 0.00 | -100.00 | 0.00 | -100.00 | -0.6617 | ||||
| US36164VAA52 / GCI Liberty, Inc. DBT | 0.01 | 0.00 | 0.0000 | 0.0000 | |||||
| NSSC / Napco Security Technologies, Inc. | 0.00 | -100.00 | 0.00 | -100.00 | -0.2801 | ||||
| FLOC / Flowco Holdings Inc. | 0.00 | -100.00 | 0.00 | -100.00 | -0.0488 | ||||
| FTRE / Fortrea Holdings Inc. | 0.00 | -100.00 | 0.00 | -100.00 | -0.4969 | ||||
| VITL / Vital Farms, Inc. | 0.00 | -100.00 | 0.00 | -100.00 | -0.2964 | ||||
| GPI / Group 1 Automotive, Inc. | 0.00 | -100.00 | 0.00 | -100.00 | -0.5965 | ||||
| FRPT / Freshpet, Inc. | 0.00 | -100.00 | 0.00 | -100.00 | -0.3251 | ||||
| AEHR / Aehr Test Systems, Inc. | 0.00 | -100.00 | 0.00 | -100.00 | -0.1410 | ||||
| BLND / Blend Labs, Inc. | 0.00 | -100.00 | 0.00 | -100.00 | -0.4371 |