Mga Batayang Estadistika
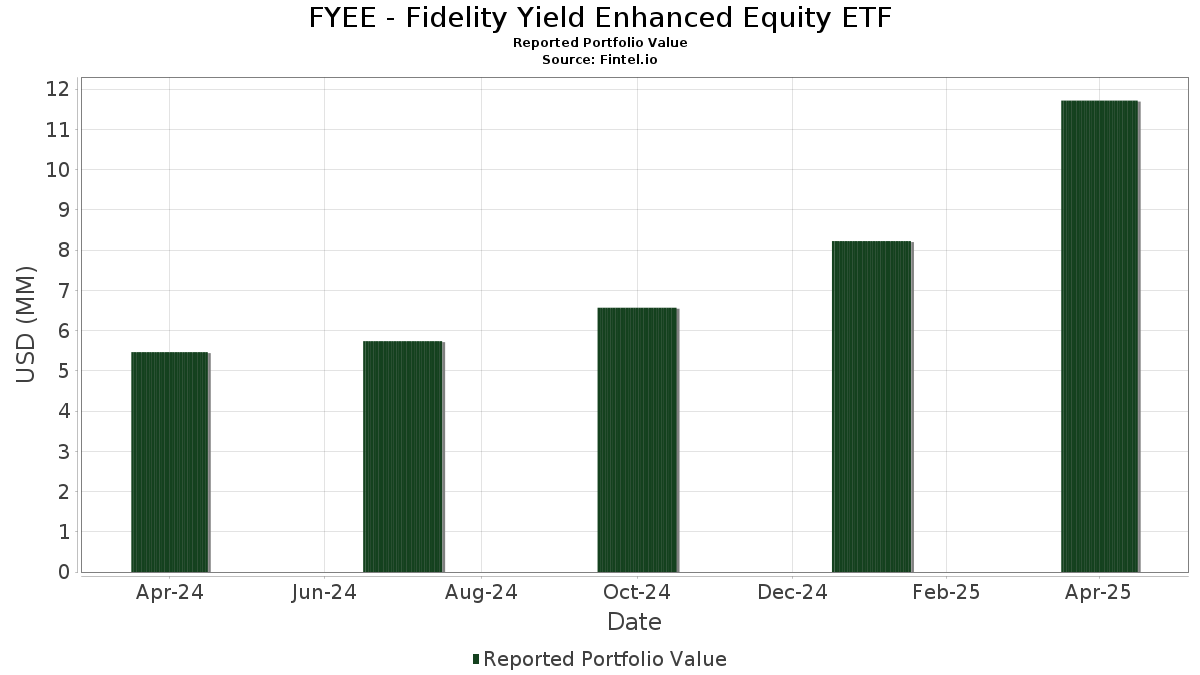
| Nilai Portofolio | $ 11,716,896 |
| Posisi Saat Ini | 169 |
Kepemilikan Terbaru, Kinerja, AUM (dari 13F, 13D)
FYEE - Fidelity Yield Enhanced Equity ETF telah mengungkapkan total kepemilikan 169 dalam pengajuan SEC terbaru mereka. Nilai portofolio terbaru dihitung sebesar $ 11,716,896 USD. Aset yang Dikelola (AUM) sebenarnya adalah nilai ini ditambah kas (yang tidak diungkapkan). Aset-aset utama FYEE - Fidelity Yield Enhanced Equity ETF adalah Apple Inc. (US:AAPL) , NVIDIA Corporation (US:NVDA) , Microsoft Corporation (DE:MSF) , Amazon.com, Inc. (US:AMZN) , and Meta Platforms, Inc. (US:META) . Posisi baru FYEE - Fidelity Yield Enhanced Equity ETF meliputi: The Williams Companies, Inc. (US:WMB) , Airbnb, Inc. (US:ABNB) , New Residential Investment Corp (US:NRZ) , Global Business Travel Group, Inc. (US:GBTG) , and FedEx Corporation (US:FDX) .
Peningkatan Tertinggi Kuartal Ini
Kami menggunakan perubahan dalam alokasi portofolio karena ini adalah metrik yang paling bermakna. Perubahan dapat disebabkan oleh perdagangan atau perubahan harga saham.
| Keamanan | Saham (MM) |
Nilai (Juta Dolar AS) |
Portfolio % | ΔPorsyento ng Portfolio |
|---|---|---|---|---|
| 0.00 | 0.10 | 0.8266 | 0.6903 | |
| 0.00 | 0.12 | 0.9981 | 0.6766 | |
| 0.00 | 0.07 | 0.6082 | 0.6082 | |
| 0.00 | 0.15 | 1.2845 | 0.5650 | |
| 0.00 | 0.07 | 0.5610 | 0.5610 | |
| 0.00 | 0.06 | 0.5327 | 0.5327 | |
| 0.00 | 0.06 | 0.5026 | 0.5026 | |
| 0.00 | 0.13 | 1.1266 | 0.4573 | |
| 0.00 | 0.31 | 2.6033 | 0.4277 | |
| 0.00 | 0.05 | 0.4084 | 0.4084 |
Penurunan Tertinggi Kuartal Ini
Kami menggunakan perubahan dalam alokasi portofolio karena ini adalah metrik yang paling bermakna. Perubahan dapat disebabkan oleh perdagangan atau perubahan harga saham.
| Keamanan | Saham (MM) |
Nilai (Juta Dolar AS) |
Portfolio % | ΔPorsyento ng Portfolio |
|---|---|---|---|---|
| 0.03 | 0.03 | 0.2665 | -0.8129 | |
| -0.09 | -0.7836 | -0.7836 | ||
| 0.00 | 0.17 | 1.4423 | -0.7213 | |
| 0.00 | 0.14 | 1.1663 | -0.6971 | |
| -0.07 | -0.5754 | -0.5754 | ||
| 0.00 | 0.48 | 4.0986 | -0.5342 | |
| 0.00 | 0.34 | 2.8623 | -0.5127 | |
| -0.05 | -0.4659 | -0.4659 | ||
| 0.00 | 0.05 | 0.4147 | -0.4147 | |
| 0.00 | 0.03 | 0.2369 | -0.3979 |
Pengajuan 13F dan Dana
Formulir ini diajukan pada 2025-06-26 untuk periode pelaporan 2025-04-30. Klik ikon tautan untuk melihat riwayat transaksi selengkapnya.
Tingkatkan ke versi premium untuk membuka data premium dan ekspor ke Excel. ![]() .
.
| Keamanan | Ketik | Harga Saham Rata-rata | Saham (MM) |
ΔSaham (%) |
ΔSaham (%) |
Nilai ($MM) |
Portpolyo (%) |
ΔPortofolio (%) |
|
|---|---|---|---|---|---|---|---|---|---|
| AAPL / Apple Inc. | 0.00 | 53.46 | 0.85 | 38.27 | 7.2222 | -0.2457 | |||
| NVDA / NVIDIA Corporation | 0.01 | 58.52 | 0.73 | 43.70 | 6.2160 | 0.0398 | |||
| MSF / Microsoft Corporation | 0.00 | 57.18 | 0.68 | 49.78 | 5.8125 | 0.2644 | |||
| AMZN / Amazon.com, Inc. | 0.00 | 62.91 | 0.48 | 26.25 | 4.0986 | -0.5342 | |||
| META / Meta Platforms, Inc. | 0.00 | 52.11 | 0.34 | 21.30 | 2.8623 | -0.5127 | |||
| BRK.B / Berkshire Hathaway Inc. | 0.00 | 50.26 | 0.31 | 70.95 | 2.6033 | 0.4277 | |||
| AVGO / Broadcom Inc. | 0.00 | 55.34 | 0.27 | 34.98 | 2.3343 | -0.1340 | |||
| GOOGL / Alphabet Inc. | 0.00 | 58.00 | 0.23 | 23.28 | 1.9868 | -0.3214 | |||
| JPM / JPMorgan Chase & Co. | 0.00 | 30.32 | 0.20 | 19.39 | 1.6811 | -0.3328 | |||
| GOOG / Alphabet Inc. | 0.00 | 21.71 | 0.17 | -5.06 | 1.4423 | -0.7213 | |||
| MA / Mastercard Incorporated | 0.00 | 44.23 | 0.16 | 42.61 | 1.3984 | -0.0055 | |||
| NFLX / Netflix, Inc. | 0.00 | 24.35 | 0.16 | 43.75 | 1.3764 | 0.0115 | |||
| XOM / Exxon Mobil Corporation | 0.00 | 37.09 | 0.16 | 35.96 | 1.3215 | -0.0714 | |||
| LLY / Eli Lilly and Company | 0.00 | 130.14 | 0.15 | 155.93 | 1.2845 | 0.5650 | |||
| ABBV / AbbVie Inc. | 0.00 | 48.93 | 0.15 | 58.51 | 1.2727 | 0.1218 | |||
| HD / The Home Depot, Inc. | 0.00 | 59.62 | 0.15 | 39.25 | 1.2724 | -0.0292 | |||
| TSLA / Tesla, Inc. | 0.00 | 28.23 | 0.14 | -10.46 | 1.1663 | -0.6971 | |||
| PM / Philip Morris International Inc. | 0.00 | 82.74 | 0.13 | 140.00 | 1.1266 | 0.4573 | |||
| PG / The Procter & Gamble Company | 0.00 | 111.56 | 0.13 | 108.20 | 1.0882 | 0.3378 | |||
| WMT / Walmart Inc. | 0.00 | 15.41 | 0.13 | 14.55 | 1.0777 | -0.2689 | |||
| CRM / Salesforce, Inc. | 0.00 | 77.65 | 0.12 | 39.08 | 1.0353 | -0.0235 | |||
| COST / Costco Wholesale Corporation | 0.00 | 337.04 | 0.12 | 350.00 | 0.9981 | 0.6766 | |||
| MRK / Merck & Co., Inc. | 0.00 | 59.95 | 0.11 | 37.97 | 0.9319 | -0.0336 | |||
| QCOM / QUALCOMM Incorporated | 0.00 | 57.14 | 0.10 | 34.21 | 0.8750 | -0.0517 | |||
| PGR / The Progressive Corporation | 0.00 | 72.51 | 0.10 | 100.00 | 0.8722 | 0.2404 | |||
| ADBE / Adobe Inc. | 0.00 | 65.45 | 0.10 | 41.67 | 0.8707 | -0.0064 | |||
| SCHW / The Charles Schwab Corporation | 0.00 | 52.26 | 0.10 | 50.77 | 0.8391 | 0.0390 | |||
| MS / Morgan Stanley | 0.00 | 939.51 | 0.10 | 781.82 | 0.8266 | 0.6903 | |||
| DIS / The Walt Disney Company | 0.00 | 57.64 | 0.09 | 27.03 | 0.8060 | -0.1021 | |||
| GILD / Gilead Sciences, Inc. | 0.00 | 28.97 | 0.09 | 42.42 | 0.8028 | -0.0086 | |||
| WFC / Wells Fargo & Company | 0.00 | 51.03 | 0.09 | 34.78 | 0.7990 | -0.0398 | |||
| V / Visa Inc. | 0.00 | 60.36 | 0.09 | 63.16 | 0.7963 | 0.0944 | |||
| AMAT / Applied Materials, Inc. | 0.00 | 91.82 | 0.09 | 59.65 | 0.7819 | 0.0850 | |||
| TT / Trane Technologies plc | 0.00 | 66.43 | 0.09 | 78.00 | 0.7596 | 0.1425 | |||
| UNH / UnitedHealth Group Incorporated | 0.00 | 82.35 | 0.09 | 39.06 | 0.7594 | -0.0251 | |||
| LMT / Lockheed Martin Corporation | 0.00 | 55.46 | 0.09 | 60.00 | 0.7517 | 0.0823 | |||
| PFE / Pfizer Inc. | 0.00 | 46.34 | 0.09 | 34.38 | 0.7383 | -0.0448 | |||
| BAC / Bank of America Corporation | 0.00 | 60.39 | 0.09 | 39.34 | 0.7252 | -0.0248 | |||
| CTAS / Cintas Corporation | 0.00 | 45.93 | 0.08 | 53.70 | 0.7093 | 0.0513 | |||
| FTNT / Fortinet, Inc. | 0.00 | 158.75 | 0.08 | 170.00 | 0.6919 | 0.3204 | |||
| AMT / American Tower Corporation | 0.00 | 103.51 | 0.08 | 151.61 | 0.6672 | 0.2828 | |||
| CSCO / Cisco Systems, Inc. | 0.00 | 8.31 | 0.08 | 4.00 | 0.6658 | -0.2562 | |||
| ECL / Ecolab Inc. | 0.00 | 49.76 | 0.08 | 50.98 | 0.6629 | 0.0336 | |||
| TJX / The TJX Companies, Inc. | 0.00 | 22.01 | 0.07 | 25.42 | 0.6370 | -0.0864 | |||
| CVNA / Carvana Co. | 0.00 | 74.12 | 0.07 | 71.43 | 0.6152 | 0.1039 | |||
| WMB / The Williams Companies, Inc. | 0.00 | 0.07 | 0.6082 | 0.6082 | |||||
| LDOS / Leidos Holdings, Inc. | 0.00 | 58.33 | 0.07 | 64.29 | 0.5946 | 0.0768 | |||
| BMY / Bristol-Myers Squibb Company | 0.00 | 53.71 | 0.07 | 30.19 | 0.5926 | -0.0542 | |||
| BDX / Becton, Dickinson and Company | 0.00 | 63.11 | 0.07 | 35.29 | 0.5918 | -0.0280 | |||
| T / AT&T Inc. | 0.00 | 58.33 | 0.07 | 86.49 | 0.5909 | 0.1341 | |||
| ELV / Elevance Health, Inc. | 0.00 | 150.00 | 0.07 | 97.14 | 0.5902 | -0.0181 | |||
| CME / CME Group Inc. | 0.00 | 57.96 | 0.07 | 83.78 | 0.5844 | 0.1332 | |||
| JNJ / Johnson & Johnson | 0.00 | 12.50 | 0.07 | 15.52 | 0.5743 | -0.1357 | |||
| ABNB / Airbnb, Inc. | 0.00 | 0.07 | 0.5610 | 0.5610 | |||||
| CSX / CSX Corporation | 0.00 | 102.27 | 0.06 | 72.97 | 0.5524 | 0.0955 | |||
| ITRI / Itron, Inc. | 0.00 | 181.64 | 0.06 | 236.84 | 0.5518 | 0.2029 | |||
| PYPL / PayPal Holdings, Inc. | 0.00 | 45.14 | 0.06 | 6.78 | 0.5437 | -0.1764 | |||
| GRMN / Garmin Ltd. | 0.00 | 253.12 | 0.06 | 215.00 | 0.5388 | 0.2870 | |||
| BIIB / Biogen Inc. | 0.00 | 464.13 | 0.06 | 287.50 | 0.5345 | 0.2909 | |||
| VEEV / Veeva Systems Inc. | 0.00 | 0.06 | 0.5327 | 0.5327 | |||||
| CMCSA / Comcast Corporation | 0.00 | 5.79 | 0.06 | 7.02 | 0.5259 | -0.1731 | |||
| DASH / DoorDash, Inc. | 0.00 | 490.38 | 0.06 | 555.56 | 0.5037 | 0.3843 | |||
| AMD / Advanced Micro Devices, Inc. | 0.00 | 0.06 | 0.5026 | 0.5026 | |||||
| COP / ConocoPhillips | 0.00 | 8.60 | 0.06 | -1.69 | 0.4980 | -0.2286 | |||
| EOG / EOG Resources, Inc. | 0.00 | 57.62 | 0.06 | 39.02 | 0.4851 | -0.0162 | |||
| INCY / Incyte Corporation | 0.00 | 89.17 | 0.06 | 60.00 | 0.4839 | 0.0513 | |||
| NEE / NextEra Energy, Inc. | 0.00 | -9.50 | 0.06 | -15.15 | 0.4767 | -0.3286 | |||
| MSI / Motorola Solutions, Inc. | 0.00 | 12.39 | 0.06 | 3.77 | 0.4757 | -0.1687 | |||
| ADP / Automatic Data Processing, Inc. | 0.00 | 87.88 | 0.06 | 89.66 | 0.4755 | 0.1110 | |||
| ZBRA / Zebra Technologies Corporation | 0.00 | 220.29 | 0.06 | 103.70 | 0.4705 | 0.1419 | |||
| GS / The Goldman Sachs Group, Inc. | 0.00 | 669.23 | 0.05 | 575.00 | 0.4657 | 0.3645 | |||
| F / Ford Motor Company | 0.01 | 58.21 | 0.05 | 57.58 | 0.4503 | 0.0408 | |||
| NOC / Northrop Grumman Corporation | 0.00 | 9.09 | 0.05 | 8.33 | 0.4469 | -0.1393 | |||
| GE / General Electric Company | 0.00 | 41.30 | 0.05 | 67.74 | 0.4457 | -0.0352 | |||
| TMUS / T-Mobile US, Inc. | 0.00 | 344.68 | 0.05 | 410.00 | 0.4390 | 0.3059 | |||
| UNP / Union Pacific Corporation | 0.00 | -13.72 | 0.05 | -25.00 | 0.4384 | -0.3957 | |||
| KLAC / KLA Corporation | 0.00 | 65.91 | 0.05 | 59.38 | 0.4363 | 0.0416 | |||
| MMC / Marsh & McLennan Companies, Inc. | 0.00 | -17.84 | 0.05 | -15.52 | 0.4238 | -0.2851 | |||
| LYFT / Lyft, Inc. | 0.00 | 925.26 | 0.05 | 880.00 | 0.4195 | 0.3557 | |||
| AXP / American Express Company | 0.00 | -14.88 | 0.05 | -29.41 | 0.4147 | -0.4147 | |||
| ALRM / Alarm.com Holdings, Inc. | 0.00 | 57.22 | 0.05 | 41.18 | 0.4121 | -0.0118 | |||
| NRZ / New Residential Investment Corp | 0.00 | 0.05 | 0.4084 | 0.4084 | |||||
| MCD / McDonald's Corporation | 0.00 | 190.00 | 0.05 | 253.85 | 0.3942 | 0.1643 | |||
| GBTG / Global Business Travel Group, Inc. | 0.01 | 0.05 | 0.3840 | 0.3840 | |||||
| FDX / FedEx Corporation | 0.00 | 0.04 | 0.3775 | 0.3775 | |||||
| SPGI / S&P Global Inc. | 0.00 | 63.46 | 0.04 | 55.56 | 0.3615 | 0.0320 | |||
| CRH / CRH plc | 0.00 | -1.35 | 0.04 | -6.82 | 0.3563 | -0.1792 | |||
| CAT / Caterpillar Inc. | 0.00 | 5.56 | 0.04 | -10.87 | 0.3498 | -0.2189 | |||
| VICI / VICI Properties Inc. | 0.00 | 303.16 | 0.04 | 344.44 | 0.3470 | 0.1758 | |||
| VZ / Verizon Communications Inc. | 0.00 | 0.04 | 0.3459 | 0.3459 | |||||
| NOW / ServiceNow, Inc. | 0.00 | 7.69 | 0.04 | 2.56 | 0.3411 | -0.1415 | |||
| CCI / Crown Castle Inc. | 0.00 | 641.18 | 0.04 | 875.00 | 0.3400 | 0.2847 | |||
| EXEL / Exelixis, Inc. | 0.00 | 33.69 | 0.04 | 58.33 | 0.3290 | 0.0313 | |||
| XPRO / Expro Group Holdings N.V. | 0.00 | 0.04 | 0.3124 | 0.3124 | |||||
| EXPE / Expedia Group, Inc. | 0.00 | 200.00 | 0.04 | 176.92 | 0.3123 | 0.1503 | |||
| ESE / ESCO Technologies Inc. | 0.00 | 0.04 | 0.3074 | 0.3074 | |||||
| ZM / Zoom Communications Inc. | 0.00 | -6.63 | 0.04 | -16.28 | 0.3067 | -0.2195 | |||
| ALLE / Allegion plc | 0.00 | 15.62 | 0.04 | 24.14 | 0.3066 | -0.0547 | |||
| LNG / Cheniere Energy, Inc. | 0.00 | 3,750.00 | 0.04 | 0.3027 | 0.2918 | ||||
| RTX / RTX Corporation | 0.00 | 46.52 | 0.03 | 41.67 | 0.2939 | 0.0009 | |||
| VTR / Ventas, Inc. | 0.00 | 0.03 | 0.2897 | 0.2897 | |||||
| JCI / Johnson Controls International plc | 0.00 | 0.03 | 0.2883 | 0.2883 | |||||
| ALL / The Allstate Corporation | 0.00 | 18.31 | 0.03 | 22.22 | 0.2835 | -0.0484 | |||
| US31635A1051 / Fidelity Cash Central Fund | 0.03 | -64.72 | 0.03 | -64.77 | 0.2665 | -0.8129 | |||
| KMI / Kinder Morgan, Inc. | 0.00 | 0.03 | 0.2633 | 0.2633 | |||||
| TMO / Thermo Fisher Scientific Inc. | 0.00 | 59.09 | 0.03 | 15.38 | 0.2554 | -0.0642 | |||
| VMI / Valmont Industries, Inc. | 0.00 | 70.00 | 0.03 | 52.63 | 0.2544 | 0.0125 | |||
| ABT / Abbott Laboratories | 0.00 | -42.12 | 0.03 | -34.15 | 0.2369 | -0.3979 | |||
| MSCI / MSCI Inc. | 0.00 | -10.71 | 0.03 | -18.18 | 0.2318 | -0.1743 | |||
| CTRE / CareTrust REIT, Inc. | 0.00 | 115.29 | 0.03 | 150.00 | 0.2138 | 0.0854 | |||
| GLPI / Gaming and Leisure Properties, Inc. | 0.00 | 0.03 | 0.2133 | 0.2133 | |||||
| OXY / Occidental Petroleum Corporation | 0.00 | 208.33 | 0.02 | 166.67 | 0.2108 | 0.0952 | |||
| TROW / T. Rowe Price Group, Inc. | 0.00 | 43.81 | 0.02 | 9.09 | 0.2101 | -0.0655 | |||
| BBWI / Bath & Body Works, Inc. | 0.00 | -5.98 | 0.02 | -23.33 | 0.2001 | -0.1747 | |||
| COMP / Compass, Inc. | 0.00 | 166.61 | 0.02 | 187.50 | 0.1992 | 0.0990 | |||
| EME / EMCOR Group, Inc. | 0.00 | 81.25 | 0.02 | 64.29 | 0.1977 | 0.0234 | |||
| TAP / Molson Coors Beverage Company | 0.00 | 0.02 | 0.1835 | 0.1835 | |||||
| LRCX / Lam Research Corporation | 0.00 | 7.53 | 0.02 | -4.55 | 0.1829 | -0.0919 | |||
| OPCH / Option Care Health, Inc. | 0.00 | 58.33 | 0.02 | 75.00 | 0.1827 | 0.0249 | |||
| CMS / CMS Energy Corporation | 0.00 | 0.02 | 0.1804 | 0.1804 | |||||
| BCPC / Balchem Corporation | 0.00 | 0.02 | 0.1798 | 0.1798 | |||||
| GL / Globe Life Inc. | 0.00 | 57.14 | 0.02 | 63.64 | 0.1616 | 0.0162 | |||
| AIT / Applied Industrial Technologies, Inc. | 0.00 | 75.00 | 0.02 | 63.64 | 0.1593 | 0.0203 | |||
| SYF / Synchrony Financial | 0.00 | 0.02 | 0.1591 | 0.1591 | |||||
| PEP / PepsiCo, Inc. | 0.00 | 41.67 | 0.02 | 28.57 | 0.1568 | -0.0190 | |||
| BBY / Best Buy Co., Inc. | 0.00 | 0.02 | 0.1543 | 0.1543 | |||||
| SWX / Southwest Gas Holdings, Inc. | 0.00 | 0.02 | 0.1529 | 0.1529 | |||||
| ANF / Abercrombie & Fitch Co. | 0.00 | 55.49 | 0.02 | -10.53 | 0.1506 | -0.0874 | |||
| SO / The Southern Company | 0.00 | 58.33 | 0.02 | 70.00 | 0.1485 | 0.0261 | |||
| HON / Honeywell International Inc. | 0.00 | 0.02 | 0.1450 | 0.1450 | |||||
| GAP / The Gap, Inc. | 0.00 | 202.89 | 0.02 | 220.00 | 0.1365 | 0.0657 | |||
| ROL / Rollins, Inc. | 0.00 | 0.02 | 0.1341 | 0.1341 | |||||
| MTH / Meritage Homes Corporation | 0.00 | 0.02 | 0.1292 | 0.1292 | |||||
| MHO / M/I Homes, Inc. | 0.00 | 0.02 | 0.1279 | 0.1279 | |||||
| CRUS / Cirrus Logic, Inc. | 0.00 | -46.18 | 0.01 | -50.00 | 0.1266 | -0.2249 | |||
| EA / Electronic Arts Inc. | 0.00 | 0.01 | 0.1259 | 0.1259 | |||||
| OSK / Oshkosh Corporation | 0.00 | 0.01 | 0.1247 | 0.1247 | |||||
| INTU / Intuit Inc. | 0.00 | 0.01 | 0.1227 | 0.1227 | |||||
| BSX / Boston Scientific Corporation | 0.00 | 0.01 | 0.1216 | 0.1216 | |||||
| TRV / The Travelers Companies, Inc. | 0.00 | -20.90 | 0.01 | -18.75 | 0.1191 | -0.1316 | |||
| GM / General Motors Company | 0.00 | 0.01 | 0.1147 | 0.1147 | |||||
| COKE / Coca-Cola Consolidated, Inc. | 0.00 | 0.01 | 0.1038 | 0.1038 | |||||
| MNST / Monster Beverage Corporation | 0.00 | 0.01 | 0.0982 | 0.0982 | |||||
| RNG / RingCentral, Inc. | 0.00 | 24.10 | 0.01 | -8.33 | 0.0972 | -0.1220 | |||
| TSN / Tyson Foods, Inc. | 0.00 | 0.01 | 0.0932 | 0.0932 | |||||
| PECO / Phillips Edison & Company, Inc. | 0.00 | 0.01 | 0.0897 | 0.0897 | |||||
| TDC / Teradata Corporation | 0.00 | -50.96 | 0.01 | -67.74 | 0.0883 | -0.2936 | |||
| BAH / Booz Allen Hamilton Holding Corporation | 0.00 | -37.68 | 0.01 | -41.18 | 0.0878 | -0.1285 | |||
| PLTK / Playtika Holding Corp. | 0.00 | 96.13 | 0.01 | 42.86 | 0.0863 | -0.0307 | |||
| AVA / Avista Corporation | 0.00 | 0.01 | 0.0822 | 0.0822 | |||||
| KO / The Coca-Cola Company | 0.00 | 309.38 | 0.01 | 350.00 | 0.0808 | 0.0490 | |||
| BRX / Brixmor Property Group Inc. | 0.00 | 0.01 | 0.0608 | 0.0608 | |||||
| NEM / Newmont Corporation | 0.00 | 0.01 | 0.0569 | 0.0569 | |||||
| TWLO / Twilio Inc. | 0.00 | -16.67 | 0.01 | -45.45 | 0.0535 | -0.0855 | |||
| DOCS / Doximity, Inc. | 0.00 | 0.01 | 0.0532 | 0.0532 | |||||
| TOL / Toll Brothers, Inc. | 0.00 | 742.86 | 0.01 | 0.0506 | 0.0391 | ||||
| 1ILMN / Illumina, Inc. | 0.00 | 0.00 | 0.0396 | 0.0396 | |||||
| WEN / The Wendy's Company | 0.00 | 0.00 | 0.0394 | 0.0394 | |||||
| MMS / Maximus, Inc. | 0.00 | -60.51 | 0.00 | -63.64 | 0.0353 | -0.1083 | |||
| DUOL / Duolingo, Inc. | 0.00 | 0.00 | 0.0331 | 0.0331 | |||||
| MWA / Mueller Water Products, Inc. | 0.00 | 0.00 | 0.0216 | 0.0216 | |||||
| CVX / Chevron Corporation | 0.00 | -42.86 | 0.00 | -50.00 | 0.0093 | -0.0161 | |||
| TOU / Tourmaline Oil Corp. | 0.00 | 0.00 | 0.0090 | 0.0090 | |||||
| SKYW / SkyWest, Inc. | 0.00 | -97.55 | 0.00 | -100.00 | 0.0038 | -0.2960 | |||
| YOU / Clear Secure, Inc. | 0.00 | 0.00 | 0.00 | 0.0015 | -0.0005 | ||||
| ULTA / Ulta Beauty, Inc. | 0.00 | -100.00 | 0.00 | -100.00 | -0.1703 | ||||
| CSL / Carlisle Companies Incorporated | 0.00 | -100.00 | 0.00 | -100.00 | -0.1420 | ||||
| PEG / Public Service Enterprise Group Incorporated | 0.00 | -100.00 | 0.00 | -100.00 | -0.0284 | ||||
| EL / The Estée Lauder Companies Inc. | 0.00 | -100.00 | 0.00 | -100.00 | -0.0892 | ||||
| BKNG / Booking Holdings Inc. | 0.00 | -100.00 | 0.00 | -100.00 | -0.2303 | ||||
| A / Agilent Technologies, Inc. | 0.00 | -100.00 | 0.00 | -100.00 | -0.0718 | ||||
| RSG / Republic Services, Inc. | 0.00 | -100.00 | 0.00 | -100.00 | -0.0738 | ||||
| TENB / Tenable Holdings, Inc. | 0.00 | -100.00 | 0.00 | -100.00 | -0.1765 | ||||
| ORCL / Oracle Corporation | 0.00 | -100.00 | 0.00 | -100.00 | -0.0248 | ||||
| CBOE MINI SPX INDEX OPTIONS CALL 558 05/09/2025 / DE (N/A) | -0.04 | -0.3618 | -0.3618 | ||||||
| CBOE MINI SPX INDEX OPTIONS CALL 550 05/02/2025 / DE (N/A) | -0.05 | -0.4659 | -0.4659 | ||||||
| CBOE MINI SPX INDEX OPTIONS CALL 554 05/16/2025 / DE (N/A) | -0.07 | -0.5754 | -0.5754 | ||||||
| CBOE MINI SPX INDEX OPTIONS CALL 550 05/23/2025 / DE (N/A) | -0.09 | -0.7836 | -0.7836 |