Mga Batayang Estadistika
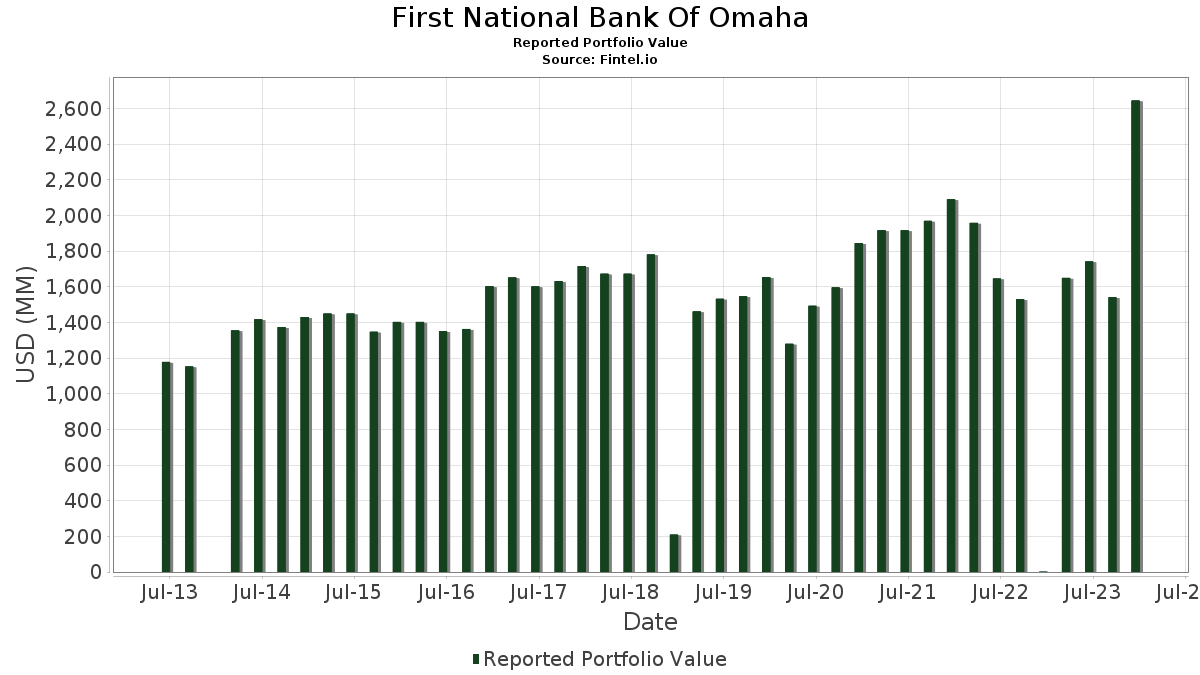
| Nilai Portofolio | $ 1,539,304,931 |
| Posisi Saat Ini | 307 |
Kepemilikan Terbaru, Kinerja, AUM (dari 13F, 13D)
First National Bank Of Omaha telah mengungkapkan total kepemilikan 307 dalam pengajuan SEC terbaru mereka. Nilai portofolio terbaru dihitung sebesar $ 1,539,304,931 USD. Aset yang Dikelola (AUM) sebenarnya adalah nilai ini ditambah kas (yang tidak diungkapkan). Aset-aset utama First National Bank Of Omaha adalah Microsoft Corporation (US:MSFT) , Apple Inc. (US:AAPL) , Dimensional ETF Trust - Dimensional International Core Equity Market ETF (US:DFAI) , JPMorgan Chase & Co. (US:JPM) , and Amazon.com, Inc. (US:AMZN) .
Peningkatan Tertinggi Kuartal Ini
Kami menggunakan perubahan dalam alokasi portofolio karena ini adalah metrik yang paling bermakna. Perubahan dapat disebabkan oleh perdagangan atau perubahan harga saham.
| Keamanan | Saham (MM) |
Nilai (Juta Dolar AS) |
Portfolio % | ΔPorsyento ng Portfolio |
|---|---|---|---|---|
| 0.28 | 70.28 | 4.5655 | 2.0800 | |
| 0.17 | 70.58 | 4.5850 | 1.8466 | |
| 1.45 | 42.24 | 2.7440 | 1.6418 | |
| 0.02 | 17.70 | 1.1496 | 1.1496 | |
| 0.16 | 34.26 | 2.2255 | 1.1058 | |
| 0.15 | 35.99 | 2.3378 | 1.0947 | |
| 0.21 | 27.86 | 1.8097 | 0.8162 | |
| 0.05 | 26.63 | 1.7301 | 0.7833 | |
| 0.12 | 23.52 | 1.5281 | 0.7584 | |
| 0.04 | 23.64 | 1.5359 | 0.6686 |
Penurunan Tertinggi Kuartal Ini
Kami menggunakan perubahan dalam alokasi portofolio karena ini adalah metrik yang paling bermakna. Perubahan dapat disebabkan oleh perdagangan atau perubahan harga saham.
| Keamanan | Saham (MM) |
Nilai (Juta Dolar AS) |
Portfolio % | ΔPorsyento ng Portfolio |
|---|---|---|---|---|
| 0.01 | 0.53 | 0.0342 | -0.1750 | |
| 0.00 | 0.29 | 0.0192 | -0.1447 | |
| 0.07 | 1.59 | 0.1032 | -0.0474 | |
| 0.00 | 0.00 | -0.0171 | ||
| 0.00 | 0.00 | -0.0143 | ||
| 0.00 | 0.00 | -0.0080 | ||
| 0.12 | 3.31 | 0.1264 | -0.0051 | |
| 0.00 | 0.41 | 0.0268 | -0.0019 |
Pengajuan 13F dan Dana
Formulir ini diajukan pada 2025-02-11 untuk periode pelaporan 2024-12-31. Klik ikon tautan untuk melihat riwayat transaksi selengkapnya.
Tingkatkan ke versi premium untuk membuka data premium dan ekspor ke Excel. ![]() .
.
| Keamanan | Ketik | Harga Saham Rata-rata | Saham (MM) |
ΔSaham (%) |
ΔSaham (%) |
Nilai ($MM) |
Portpolyo (%) |
ΔPortofolio (%) |
|
|---|---|---|---|---|---|---|---|---|---|
| MSFT / Microsoft Corporation | 0.17 | -2.48 | 70.58 | -4.47 | 4.5850 | 1.8466 | |||
| AAPL / Apple Inc. | 0.28 | -2.49 | 70.28 | 4.80 | 4.5655 | 2.0800 | |||
| DFAI / Dimensional ETF Trust - Dimensional International Core Equity Market ETF | 1.45 | 54.58 | 42.24 | 42.04 | 2.7440 | 1.6418 | |||
| JPM / JPMorgan Chase & Co. | 0.15 | -5.62 | 35.99 | 7.30 | 2.3378 | 1.0947 | |||
| AMZN / Amazon.com, Inc. | 0.16 | -3.69 | 34.26 | 13.39 | 2.2255 | 1.1058 | |||
| NVDA / NVIDIA Corporation | 0.21 | -6.02 | 27.86 | 3.93 | 1.8097 | 0.8162 | |||
| VOO / Vanguard Index Funds - Vanguard S&P 500 ETF | 0.05 | 2.10 | 26.63 | 4.25 | 1.7301 | 0.7833 | |||
| META / Meta Platforms, Inc. | 0.04 | -1.22 | 23.64 | 1.03 | 1.5359 | 0.6686 | |||
| GOOGL / Alphabet Inc. | 0.12 | -0.76 | 23.52 | 13.28 | 1.5281 | 0.7584 | |||
| PEP / PepsiCo, Inc. | 0.14 | 7.30 | 21.85 | -4.05 | 1.4194 | 0.5754 | |||
| ABT / Abbott Laboratories | 0.19 | -2.25 | 21.44 | -3.02 | 1.3930 | 0.5735 | |||
| BRK.B / Berkshire Hathaway Inc. | 0.04 | -4.64 | 20.25 | -6.09 | 1.3153 | 0.5162 | |||
| GOOG / Alphabet Inc. | 0.10 | -1.80 | 18.55 | 11.86 | 1.2050 | 0.5904 | |||
| BLK / BlackRock, Inc. | 0.02 | 17.70 | 1.1496 | 1.1496 | |||||
| CVX / Chevron Corporation | 0.11 | -1.34 | 16.11 | -2.97 | 1.0469 | 0.4313 | |||
| LEBENS FAMILY ENTERPRISES II / SHS (52238A912) | 0.00 | 15.66 | 0.0000 | ||||||
| COST / Costco Wholesale Corporation | 0.02 | -3.47 | 14.61 | -0.24 | 0.9493 | 0.4064 | |||
| BR / Broadridge Financial Solutions, Inc. | 0.06 | -1.73 | 14.60 | 3.33 | 0.9485 | 0.4247 | |||
| MKL / Markel Group Inc. | 0.01 | -0.55 | 14.37 | 9.44 | 0.9335 | 0.4469 | |||
| CFR / Cullen/Frost Bankers, Inc. | 0.10 | -0.99 | 14.08 | 18.82 | 0.9150 | 0.4756 | |||
| VTV / Vanguard Index Funds - Vanguard Value ETF | 0.08 | -1.04 | 14.05 | -4.02 | 0.9128 | 0.3701 | |||
| PTC / PTC Inc. | 0.07 | -1.14 | 13.75 | 0.61 | 0.8934 | 0.3868 | |||
| NEE / NextEra Energy, Inc. | 0.18 | -3.05 | 12.71 | -17.77 | 0.8255 | 0.2527 | |||
| TJX / The TJX Companies, Inc. | 0.11 | -3.64 | 12.70 | -0.95 | 0.8253 | 0.3499 | |||
| BKNG / Booking Holdings Inc. | 0.00 | -3.83 | 12.36 | 13.45 | 0.8031 | 0.3992 | |||
| CMCSA / Comcast Corporation | 0.33 | -5.76 | 12.33 | -15.32 | 0.8008 | 0.2612 | |||
| EOG / EOG Resources, Inc. | 0.10 | -2.44 | 12.14 | -2.72 | 0.7890 | 0.3263 | |||
| LFUS / Littelfuse, Inc. | 0.05 | 13.20 | 11.95 | 0.56 | 0.7765 | 0.3360 | |||
| SPY / SPDR S&P 500 ETF | 0.02 | 43.54 | 11.25 | 46.63 | 0.7305 | 0.4463 | |||
| TXN / Texas Instruments Incorporated | 0.06 | -1.28 | 11.19 | -10.38 | 0.7271 | 0.2642 | |||
| HUNZEKER HOLDINGS, LLC CLASS / SHS (44458A912) | 0.00 | 11.00 | 0.0000 | ||||||
| ETN / Eaton Corporation plc | 0.03 | -3.98 | 10.88 | -3.86 | 0.7069 | 0.2874 | |||
| MCGOO PARTNERSHIP, LLP / SHS (55269A909) | 0.00 | 10.84 | 0.0000 | ||||||
| JNJ / Johnson & Johnson | 0.07 | -0.91 | 10.79 | -11.57 | 0.7008 | 0.2486 | |||
| GJR / Strats Trust For Procter & Gambel Security - Preferred Security | 0.06 | -1.59 | 10.78 | -4.75 | 0.7000 | 0.2808 | |||
| ACN / Accenture plc | 0.03 | -0.90 | 10.75 | -1.38 | 0.6982 | 0.2943 | |||
| XOM / Exxon Mobil Corporation | 0.10 | -3.41 | 10.57 | -11.36 | 0.6870 | 0.2448 | |||
| VUG / Vanguard Index Funds - Vanguard Growth ETF | 0.03 | -1.67 | 10.48 | 5.11 | 0.6809 | 0.3114 | |||
| DIS / The Walt Disney Company | 0.09 | -0.32 | 10.20 | 15.38 | 0.6628 | 0.3351 | |||
| RVTY / Revvity, Inc. | 0.09 | -0.79 | 9.93 | -13.33 | 0.6452 | 0.2205 | |||
| TOWNSEND REAL ESTATE FUND-E / SHS (89219A909) | 0.01 | 9.55 | 0.0000 | ||||||
| TRV / The Travelers Companies, Inc. | 0.04 | -1.88 | 9.49 | 0.97 | 0.6165 | 0.2681 | |||
| ORLY / O'Reilly Automotive, Inc. | 0.01 | -3.25 | 9.47 | -0.38 | 0.6152 | 0.2629 | |||
| MCHP / Microchip Technology Incorporated | 0.16 | -2.93 | 9.46 | -30.67 | 0.6145 | 0.1089 | |||
| MRK / Merck & Co., Inc. | 0.10 | -8.66 | 9.46 | -19.99 | 0.6143 | 0.1763 | |||
| JLL / Jones Lang LaSalle Incorporated | 0.04 | -0.82 | 9.45 | -6.94 | 0.6139 | 0.2375 | |||
| UNP / Union Pacific Corporation | 0.04 | -0.61 | 9.42 | -8.04 | 0.6120 | 0.2323 | |||
| RHI / Robert Half Inc. | 0.13 | 2.39 | 9.41 | 7.02 | 0.6110 | 0.2853 | |||
| PWR / Quanta Services, Inc. | 0.03 | -16.72 | 9.38 | -11.72 | 0.6092 | 0.2155 | |||
| V / Visa Inc. | 0.03 | 3.01 | 9.26 | 18.39 | 0.6018 | 0.3118 | |||
| LLY / Eli Lilly and Company | 0.01 | -0.01 | 9.17 | -12.86 | 0.5959 | 0.2057 | |||
| ZTS / Zoetis Inc. | 0.06 | -2.17 | 9.03 | -18.42 | 0.5867 | 0.1764 | |||
| ADBE / Adobe Inc. | 0.02 | 88.67 | 9.03 | 62.03 | 0.5863 | 0.3799 | |||
| RTX / RTX Corporation | 0.08 | -4.65 | 8.87 | -8.93 | 0.5760 | 0.2152 | |||
| MDT / Medtronic plc | 0.11 | -1.78 | 8.73 | -12.85 | 0.5668 | 0.1958 | |||
| VEA / Vanguard Tax-Managed Funds - Vanguard FTSE Developed Markets ETF | 0.18 | -1.71 | 8.72 | -11.00 | 0.5662 | 0.2032 | |||
| BLACK CAT III LLC / SHS (09190A959) | 0.00 | 8.58 | 0.0000 | ||||||
| LOW / Lowe's Companies, Inc. | 0.03 | -1.71 | 8.51 | -10.45 | 0.5526 | 0.2006 | |||
| APD / Air Products and Chemicals, Inc. | 0.03 | -1.50 | 8.24 | -4.05 | 0.5356 | 0.2171 | |||
| MDLZ / Mondelez International, Inc. | 0.14 | 30.61 | 8.12 | 5.89 | 0.5275 | 0.2433 | |||
| XEL / Xcel Energy Inc. | 0.12 | -1.67 | 8.00 | 1.66 | 0.5198 | 0.2281 | |||
| HD / The Home Depot, Inc. | 0.02 | -3.15 | 7.97 | -7.03 | 0.5179 | 0.2001 | |||
| QCOM / QUALCOMM Incorporated | 0.05 | -4.74 | 7.89 | -13.94 | 0.5125 | 0.1727 | |||
| UNH / UnitedHealth Group Incorporated | 0.02 | -2.03 | 7.87 | -15.24 | 0.5111 | 0.1671 | |||
| ECL / Ecolab Inc. | 0.03 | -6.44 | 7.79 | -14.14 | 0.5061 | 0.1698 | |||
| MKSI / MKS Inc. | 0.07 | 0.70 | 7.68 | -3.30 | 0.4991 | 0.2046 | |||
| COP / ConocoPhillips | 0.08 | 0.58 | 7.65 | -5.25 | 0.4967 | 0.1976 | |||
| USB / U.S. Bancorp | 0.16 | -1.89 | 7.59 | 2.61 | 0.4928 | 0.2188 | |||
| AMGN / Amgen Inc. | 0.03 | -7.95 | 7.19 | -25.55 | 0.4671 | 0.1092 | |||
| ICE / Intercontinental Exchange, Inc. | 0.05 | -3.00 | 7.17 | -10.03 | 0.4658 | 0.1704 | |||
| WMT / Walmart Inc. | 0.08 | -3.92 | 6.92 | 7.50 | 0.4495 | 0.2109 | |||
| HCM CAYMAN FEEDER LIMTED / SHS (40413A906) | 0.01 | 6.77 | 0.0000 | ||||||
| MA / Mastercard Incorporated | 0.01 | -5.96 | 6.71 | 0.28 | 0.4358 | 0.1879 | |||
| ROP / Roper Technologies, Inc. | 0.01 | -1.01 | 6.64 | -7.52 | 0.4315 | 0.1653 | |||
| WFC / Wells Fargo & Company | 0.09 | -4.59 | 6.50 | 18.64 | 0.4226 | 0.2193 | |||
| QQQ / Invesco QQQ Trust, Series 1 | 0.01 | 0.00 | 6.19 | 4.75 | 0.4023 | 0.1832 | |||
| KEYS / Keysight Technologies, Inc. | 0.04 | -1.05 | 6.07 | 0.00 | 0.3946 | 0.1695 | |||
| UPS / United Parcel Service, Inc. | 0.05 | -0.58 | 6.02 | -8.06 | 0.3908 | 0.1483 | |||
| IVV / iShares Trust - iShares Core S&P 500 ETF | 0.01 | 0.00 | 5.81 | 2.06 | 0.3773 | 0.1664 | |||
| RPM / RPM International Inc. | 0.05 | -4.42 | 5.68 | -2.79 | 0.3689 | 0.1524 | |||
| TSCO / Tractor Supply Company | 0.10 | 370.24 | 5.52 | -14.24 | 0.3585 | 0.1200 | |||
| IDA / IDACORP, Inc. | 0.05 | 0.09 | 5.50 | 6.10 | 0.3571 | 0.1651 | |||
| CSCO / Cisco Systems, Inc. | 0.09 | -0.36 | 5.48 | 10.83 | 0.3557 | 0.1726 | |||
| LEBENS FAMILY ENTERPRISES IV / SHS (52321A910) | 0.00 | 5.34 | 0.0000 | ||||||
| MS / Morgan Stanley | 0.04 | -3.66 | 5.33 | 16.20 | 0.3463 | 0.1763 | |||
| TGT / Target Corporation | 0.04 | -2.72 | 5.23 | -15.63 | 0.3399 | 0.1101 | |||
| BRO / Brown & Brown, Inc. | 0.05 | -8.14 | 5.10 | -9.54 | 0.3314 | 0.1224 | |||
| CSX / CSX Corporation | 0.16 | -5.51 | 5.10 | -11.68 | 0.3311 | 0.1172 | |||
| AGG / iShares Trust - iShares Core U.S. Aggregate Bond ETF | 0.05 | -6.99 | 5.03 | -11.00 | 0.3268 | 0.1173 | |||
| APH / Amphenol Corporation | 0.07 | -5.50 | 4.98 | 0.71 | 0.3233 | 0.1401 | |||
| IJH / iShares Trust - iShares Core S&P Mid-Cap ETF | 0.08 | -2.88 | 4.86 | -2.90 | 0.3159 | 0.1303 | |||
| DORM / Dorman Products, Inc. | 0.04 | -12.19 | 4.85 | 0.56 | 0.3152 | 0.1364 | |||
| HON / Honeywell International Inc. | 0.02 | -1.01 | 4.85 | 8.17 | 0.3149 | 0.1488 | |||
| FELE / Franklin Electric Co., Inc. | 0.05 | -0.24 | 4.63 | -7.25 | 0.3009 | 0.1158 | |||
| TMO / Thermo Fisher Scientific Inc. | 0.01 | -17.28 | 4.56 | -30.43 | 0.2960 | 0.0532 | |||
| VZ / Verizon Communications Inc. | 0.11 | -23.94 | 4.55 | -32.27 | 0.2957 | 0.0466 | |||
| VTI / Vanguard Index Funds - Vanguard Total Stock Market ETF | 0.02 | 6.76 | 4.54 | 9.26 | 0.2951 | 0.1410 | |||
| LEBENS INVESTMENTS (MCCARTHY / SHS (50196A908) | 0.00 | 4.50 | 0.0000 | ||||||
| NDAQ / Nasdaq, Inc. | 0.06 | 4.40 | 4.39 | 10.58 | 0.2853 | 0.1380 | |||
| FI / Fiserv, Inc. | 0.02 | -7.14 | 4.26 | 6.18 | 0.2767 | 0.1280 | |||
| LIN / Linde plc | 0.01 | -5.87 | 4.24 | -17.35 | 0.2757 | 0.0854 | |||
| WM / Waste Management, Inc. | 0.02 | -6.41 | 4.18 | -9.03 | 0.2717 | 0.1013 | |||
| AME / AMETEK, Inc. | 0.02 | -24.46 | 4.12 | -20.71 | 0.2674 | 0.0750 | |||
| MTZ / MasTec, Inc. | 0.03 | -25.79 | 4.08 | -17.92 | 0.2649 | 0.0808 | |||
| SYF / Synchrony Financial | 0.06 | -4.40 | 4.05 | 24.59 | 0.2633 | 0.1427 | |||
| OLLI / Ollie's Bargain Outlet Holdings, Inc. | 0.04 | -1.39 | 4.05 | 11.31 | 0.2628 | 0.1281 | |||
| BURL / Burlington Stores, Inc. | 0.01 | 0.63 | 3.91 | 8.89 | 0.2540 | 0.1209 | |||
| CTAS / Cintas Corporation | 0.02 | -19.95 | 3.83 | -28.97 | 0.2489 | 0.0490 | |||
| SF / Stifel Financial Corp. | 0.04 | 0.62 | 3.74 | 13.69 | 0.2429 | 0.1210 | |||
| CB / Chubb Limited | 0.01 | -6.57 | 3.69 | -10.50 | 0.2398 | 0.0870 | |||
| BAX / Baxter International Inc. | 0.13 | 37.55 | 3.66 | 5.65 | 0.2380 | 0.1095 | |||
| CME / CME Group Inc. | 0.02 | -21.27 | 3.65 | -17.13 | 0.2373 | 0.0739 | |||
| STT / State Street Corporation | 0.04 | -3.42 | 3.56 | 7.13 | 0.2313 | 0.1081 | |||
| MANH / Manhattan Associates, Inc. | 0.01 | -4.39 | 3.53 | -8.17 | 0.2292 | 0.0868 | |||
| FR / First Industrial Realty Trust, Inc. | 0.07 | -5.08 | 3.48 | -15.00 | 0.2264 | 0.0744 | |||
| TKR / The Timken Company | 0.05 | -5.36 | 3.47 | -19.88 | 0.2253 | 0.0649 | |||
| VMIS.X / Vanguard Index Funds - Vanguard Mid-Cap ETF | 0.01 | 0.30 | 3.39 | 0.41 | 0.2205 | 0.0952 | |||
| EW / Edwards Lifesciences Corporation | 0.05 | -5.91 | 3.36 | 5.53 | 0.2181 | 0.1002 | |||
| EQH / Equitable Holdings, Inc. | 0.07 | -5.44 | 3.34 | 6.11 | 0.2167 | 0.1002 | |||
| AMD / Advanced Micro Devices, Inc. | 0.03 | 0.71 | 3.33 | -25.86 | 0.2165 | 0.0499 | |||
| GNTX / Gentex Corporation | 0.12 | -3.49 | 3.31 | -6.60 | 0.1264 | -0.0051 | |||
| EXLS / ExlService Holdings, Inc. | 0.07 | -1.68 | 3.30 | 14.36 | 0.2143 | 0.1074 | |||
| LMT / Lockheed Martin Corporation | 0.01 | -2.97 | 3.29 | -19.33 | 0.2136 | 0.0625 | |||
| MCO / Moody's Corporation | 0.01 | -6.54 | 3.29 | -6.78 | 0.2136 | 0.0829 | |||
| LDOS / Leidos Holdings, Inc. | 0.02 | -1.55 | 3.23 | -12.97 | 0.2101 | 0.0723 | |||
| CHD / Church & Dwight Co., Inc. | 0.03 | -5.98 | 3.23 | -5.99 | 0.2100 | 0.0826 | |||
| MC / Moelis & Company | 0.04 | -2.04 | 3.21 | 5.63 | 0.2085 | 0.0959 | |||
| BDX / Becton, Dickinson and Company | 0.01 | -1.05 | 3.18 | -6.89 | 0.2063 | 0.0799 | |||
| PAYX / Paychex, Inc. | 0.02 | -3.20 | 3.17 | 1.15 | 0.2062 | 0.0899 | |||
| AMT / American Tower Corporation | 0.02 | -4.98 | 3.16 | -25.05 | 0.2050 | 0.0489 | |||
| IEF / iShares Trust - iShares 7-10 Year Treasury Bond ETF | 0.03 | 0.00 | 3.15 | -5.79 | 0.2049 | 0.0808 | |||
| NSSC / Napco Security Technologies, Inc. | 0.09 | -4.20 | 3.15 | -15.81 | 0.2048 | 0.0660 | |||
| SO / The Southern Company | 0.04 | -5.21 | 3.11 | -13.48 | 0.2018 | 0.0687 | |||
| TSLA / Tesla, Inc. | 0.01 | 3.10 | 0.2013 | 0.2013 | |||||
| NTRS / Northern Trust Corporation | 0.03 | -0.68 | 3.08 | 13.06 | 0.2002 | 0.0992 | |||
| FICO / Fair Isaac Corporation | 0.00 | 90.75 | 3.08 | 95.37 | 0.2001 | 0.1417 | |||
| SIGI / Selective Insurance Group, Inc. | 0.03 | 8.20 | 3.06 | 8.44 | 0.1986 | 0.0942 | |||
| DUK / Duke Energy Corporation | 0.03 | -3.14 | 3.02 | -9.49 | 0.1964 | 0.0726 | |||
| FAF / First American Financial Corporation | 0.05 | -5.60 | 3.02 | -10.71 | 0.1962 | 0.0708 | |||
| ITGR / Integer Holdings Corporation | 0.02 | -2.74 | 3.01 | -0.86 | 0.1953 | 0.0829 | |||
| SSB / SouthState Corporation | 0.03 | -7.62 | 3.00 | -5.43 | 0.1948 | 0.0773 | |||
| ENTG / Entegris, Inc. | 0.03 | -6.59 | 2.99 | -17.78 | 0.1942 | 0.0594 | |||
| PCT / PureCycle Technologies, Inc. | 0.29 | -25.89 | 2.98 | -20.05 | 0.1935 | 0.0554 | |||
| RCL / Royal Caribbean Cruises Ltd. | 0.01 | -30.23 | 2.96 | -9.27 | 0.1922 | 0.0714 | |||
| GVI / iShares Trust - iShares Intermediate Government/Credit Bond ETF | 0.03 | 0.00 | 2.92 | -2.70 | 0.1895 | 0.0784 | |||
| LW / Lamb Weston Holdings, Inc. | 0.04 | -5.41 | 2.90 | -2.32 | 0.1887 | 0.0784 | |||
| CDW / CDW Corporation | 0.02 | -6.06 | 2.89 | -27.77 | 0.1875 | 0.0394 | |||
| STZ / Constellation Brands, Inc. | 0.01 | -6.02 | 2.88 | -19.41 | 0.1870 | 0.0546 | |||
| ENOV / Enovis Corporation | 0.06 | 18.85 | 2.81 | 21.18 | 0.1825 | 0.0965 | |||
| EFA / iShares Trust - iShares MSCI EAFE ETF | 0.04 | 25.35 | 2.80 | 13.31 | 0.1820 | 0.0904 | |||
| FANG / Diamondback Energy, Inc. | 0.02 | 19.41 | 2.76 | 13.47 | 0.1795 | 0.0893 | |||
| NPO / Enpro Inc. | 0.02 | -2.45 | 2.76 | 3.72 | 0.1791 | 0.0806 | |||
| TTEK / Tetra Tech, Inc. | 0.07 | 0.63 | 2.75 | -14.99 | 0.1787 | 0.0588 | |||
| VWO / Vanguard International Equity Index Funds - Vanguard FTSE Emerging Markets ETF | 0.06 | -1.26 | 2.68 | -9.15 | 0.1742 | 0.0648 | |||
| ICFI / ICF International, Inc. | 0.02 | 0.74 | 2.68 | -28.00 | 0.1741 | 0.0361 | |||
| THE HUNDRED ACRE WOODS LLC / SHS (44553A908) | 0.00 | 2.67 | 0.0000 | ||||||
| JAZZ / Jazz Pharmaceuticals plc | 0.02 | -28.24 | 2.65 | -20.66 | 0.1722 | 0.0483 | |||
| IWV / iShares Trust - iShares Russell 3000 ETF | 0.01 | 0.00 | 2.64 | 2.32 | 0.1716 | 0.0759 | |||
| CASY / Casey's General Stores, Inc. | 0.01 | 5.58 | 2.61 | 11.38 | 0.1698 | 0.0828 | |||
| POOL / Pool Corporation | 0.01 | -6.12 | 2.60 | -15.04 | 0.1692 | 0.0555 | |||
| LNTH / Lantheus Holdings, Inc. | 0.03 | -6.13 | 2.54 | -23.49 | 0.1651 | 0.0420 | |||
| SM / SM Energy Company | 0.07 | -0.81 | 2.53 | -3.84 | 0.1643 | 0.0669 | |||
| IJR / iShares Trust - iShares Core S&P Small-Cap ETF | 0.02 | -1.49 | 2.51 | -2.97 | 0.1633 | 0.0673 | |||
| ADC / Agree Realty Corporation | 0.04 | -11.03 | 2.49 | -16.81 | 0.1615 | 0.0508 | |||
| NKE / NIKE, Inc. | 0.03 | -7.18 | 2.46 | -20.57 | 0.1599 | 0.0451 | |||
| POWI / Power Integrations, Inc. | 0.04 | -1.51 | 2.46 | -5.21 | 0.1597 | 0.0636 | |||
| AMBA / Ambarella, Inc. | 0.03 | -9.97 | 2.43 | 16.07 | 0.1582 | 0.0804 | |||
| AUB / Atlantic Union Bankshares Corporation | 0.06 | 16.29 | 2.42 | 16.94 | 0.1570 | 0.0804 | |||
| BLKB / Blackbaud, Inc. | 0.03 | -1.77 | 2.40 | -14.23 | 0.1558 | 0.0521 | |||
| SBUX / Starbucks Corporation | 0.03 | -5.72 | 2.36 | -11.76 | 0.1532 | 0.0541 | |||
| ENS / EnerSys | 0.02 | 0.43 | 2.31 | -9.06 | 0.1501 | 0.0560 | |||
| CSL / Carlisle Companies Incorporated | 0.01 | 0.69 | 2.31 | -17.41 | 0.1498 | 0.0463 | |||
| MOH / Molina Healthcare, Inc. | 0.01 | 20.88 | 2.29 | 2.09 | 0.1491 | 0.0658 | |||
| UMBF / UMB Financial Corporation | 0.02 | -2.01 | 2.28 | 5.21 | 0.1484 | 0.0679 | |||
| PR / Permian Resources Corporation | 0.16 | 12.90 | 2.28 | 19.29 | 0.1483 | 0.0773 | |||
| BCPC / Balchem Corporation | 0.01 | -1.96 | 2.26 | -9.19 | 0.1470 | 0.0546 | |||
| CACI / CACI International Inc | 0.01 | 15.31 | 2.25 | -7.67 | 0.1463 | 0.0559 | |||
| LAMR / Lamar Advertising Company | 0.02 | 0.62 | 2.21 | -8.30 | 0.1435 | 0.0542 | |||
| BATTEN PROPERTIES LLC / SHS (07039A909) | 0.00 | 2.20 | 0.0000 | ||||||
| ATO / Atmos Energy Corporation | 0.02 | -7.11 | 2.15 | -6.74 | 0.1394 | 0.0541 | |||
| MGV / Vanguard World Fund - Vanguard Mega Cap Value ETF | 0.02 | 0.27 | 2.12 | -2.35 | 0.1378 | 0.0573 | |||
| UPBD / Upbound Group, Inc. | 0.07 | -5.98 | 2.09 | -14.28 | 0.1357 | 0.0454 | |||
| KO / The Coca-Cola Company | 0.03 | 4.05 | 2.02 | -9.88 | 0.1310 | 0.0481 | |||
| NOG / Northern Oil and Gas, Inc. | 0.05 | 258.68 | 2.01 | 276.78 | 0.1307 | 0.1109 | |||
| VB / Vanguard Index Funds - Vanguard Small-Cap ETF | 0.01 | 5.09 | 1.97 | 6.48 | 0.1282 | 0.0595 | |||
| WH / Wyndham Hotels & Resorts, Inc. | 0.02 | 0.58 | 1.95 | 29.75 | 0.1270 | 0.0711 | |||
| UTHR / United Therapeutics Corporation | 0.01 | -4.28 | 1.93 | -5.75 | 0.1256 | 0.0496 | |||
| SUI / Sun Communities, Inc. | 0.02 | -7.43 | 1.93 | -15.78 | 0.1251 | 0.0404 | |||
| ONTO / Onto Innovation Inc. | 0.01 | 38.72 | 1.91 | 11.39 | 0.1239 | 0.0604 | |||
| IBM / International Business Machines Corporation | 0.01 | 2.44 | 1.89 | 1.89 | 0.1225 | 0.0539 | |||
| BND / Vanguard Bond Index Funds - Vanguard Total Bond Market ETF | 0.03 | 4.81 | 1.87 | 0.32 | 0.1215 | 0.0524 | |||
| VNQ / Vanguard Specialized Funds - Vanguard Real Estate ETF | 0.02 | -4.40 | 1.85 | -12.60 | 0.1199 | 0.0417 | |||
| O / Realty Income Corporation | 0.03 | -16.39 | 1.81 | -29.59 | 0.1174 | 0.0223 | |||
| PAYC / Paycom Software, Inc. | 0.01 | -6.60 | 1.74 | 14.92 | 0.1131 | 0.0570 | |||
| DIOD / Diodes Incorporated | 0.03 | -2.23 | 1.74 | -5.90 | 0.1129 | 0.0444 | |||
| LGIH / LGI Homes, Inc. | 0.02 | -2.02 | 1.72 | -26.11 | 0.1116 | 0.0255 | |||
| QLYS / Qualys, Inc. | 0.01 | 0.53 | 1.69 | 9.79 | 0.1100 | 0.0528 | |||
| IWP / iShares Trust - iShares Russell Mid-Cap Growth ETF | 0.01 | -3.30 | 1.68 | 4.53 | 0.1094 | 0.0497 | |||
| FBIN / Fortune Brands Innovations, Inc. | 0.02 | 27.30 | 1.62 | -2.88 | 0.1052 | 0.0434 | |||
| ICLR / ICON Public Limited Company | 0.01 | 45.60 | 1.61 | 6.29 | 0.1043 | 0.0483 | |||
| AMN / AMN Healthcare Services, Inc. | 0.07 | -30.74 | 1.59 | -60.93 | 0.1032 | -0.0474 | |||
| FMC / FMC Corporation | 0.03 | -5.09 | 1.57 | -30.04 | 0.1017 | 0.0188 | |||
| PSX / Phillips 66 | 0.01 | -8.17 | 1.54 | -20.41 | 0.1004 | 0.0284 | |||
| IR / Ingersoll Rand Inc. | 0.02 | 1.53 | 0.0995 | 0.0995 | |||||
| TMUS / T-Mobile US, Inc. | 0.01 | 1.48 | 0.0961 | 0.0961 | |||||
| MZTI / The Marzetti Company | 0.01 | 0.51 | 1.45 | -1.43 | 0.0940 | 0.0396 | |||
| MCD / McDonald's Corporation | 0.00 | 17.83 | 1.35 | 12.17 | 0.0875 | 0.0430 | |||
| NXST / Nexstar Media Group, Inc. | 0.01 | 0.75 | 1.28 | -3.76 | 0.0832 | 0.0339 | |||
| MMM / 3M Company | 0.01 | 2.49 | 1.24 | -3.21 | 0.0804 | 0.0330 | |||
| STRAUSS HOUSE, LLC / SHS (86316A907) | 0.00 | 1.20 | 0.0000 | ||||||
| OSK / Oshkosh Corporation | 0.01 | 0.57 | 1.20 | -4.62 | 0.0778 | 0.0313 | |||
| ABBV / AbbVie Inc. | 0.01 | 0.00 | 1.20 | -10.02 | 0.0776 | 0.0284 | |||
| IWR / iShares Trust - iShares Russell Mid-Cap ETF | 0.01 | 0.00 | 1.18 | 0.26 | 0.0766 | 0.0330 | |||
| WICKENBURG LAND CO LLC 55.5PCT / SHS (44979A912) | 0.00 | 1.15 | 0.0000 | ||||||
| PFE / Pfizer Inc. | 0.04 | -12.26 | 1.12 | -19.55 | 0.0725 | 0.0211 | |||
| VMI / Valmont Industries, Inc. | 0.00 | 0.36 | 1.10 | 6.15 | 0.0718 | 0.0332 | |||
| PARKER TEN MILE RANCH LP / SHS (995004884) | 0.00 | 1.05 | 0.0000 | ||||||
| BSV / Vanguard Bond Index Funds - Vanguard Short-Term Bond ETF | 0.01 | 5.90 | 1.04 | 4.02 | 0.0673 | 0.0304 | |||
| PACIFIC DIABETES TECHNOLOGIE / SHS (69404A906) | 0.00 | 1.00 | 0.0000 | ||||||
| SON / Sonoco Products Company | 0.02 | 2.10 | 0.92 | -8.70 | 0.0600 | 0.0225 | |||
| HUM / Humana Inc. | 0.00 | -7.47 | 0.91 | -25.90 | 0.0590 | 0.0136 | |||
| BOOT / Boot Barn Holdings, Inc. | 0.01 | -9.00 | 0.88 | -17.46 | 0.0572 | 0.0177 | |||
| SHW / The Sherwin-Williams Company | 0.00 | 0.00 | 0.82 | -10.99 | 0.0532 | 0.0191 | |||
| SHEL / Shell plc - Depositary Receipt (Common Stock) | 0.01 | 2.08 | 0.81 | -3.11 | 0.0527 | 0.0217 | |||
| EMR / Emerson Electric Co. | 0.01 | 2.67 | 0.80 | 16.30 | 0.0520 | 0.0265 | |||
| CLX / The Clorox Company | 0.00 | 0.00 | 0.80 | -0.38 | 0.0517 | 0.0221 | |||
| UFPT / UFP Technologies, Inc. | 0.00 | 0.78 | 0.0507 | 0.0507 | |||||
| VIG / Vanguard Specialized Funds - Vanguard Dividend Appreciation ETF | 0.00 | 0.00 | 0.72 | -1.09 | 0.0470 | 0.0199 | |||
| SPYG / SPDR Series Trust - SPDR Portfolio S&P 500 Growth ETF | 0.01 | 0.00 | 0.71 | 5.98 | 0.0461 | 0.0213 | |||
| BHE / Benchmark Electronics, Inc. | 0.02 | -9.03 | 0.70 | -6.76 | 0.0457 | 0.0177 | |||
| ADUS / Addus HomeCare Corporation | 0.01 | -8.96 | 0.69 | -14.22 | 0.0451 | 0.0151 | |||
| SPYV / SPDR Series Trust - SPDR Portfolio S&P 500 Value ETF | 0.01 | 0.00 | 0.69 | -3.23 | 0.0447 | 0.0183 | |||
| BRK.A / Berkshire Hathaway Inc. | 0.00 | 0.00 | 0.68 | -1.59 | 0.0442 | 0.0186 | |||
| PATK / Patrick Industries, Inc. | 0.01 | 36.52 | 0.68 | -20.31 | 0.0441 | 0.0125 | |||
| GE / General Electric Company | 0.00 | -1.22 | 0.67 | -12.69 | 0.0438 | 0.0152 | |||
| MMI / Marcus & Millichap, Inc. | 0.02 | -9.02 | 0.67 | -12.16 | 0.0437 | 0.0153 | |||
| SCHW / The Charles Schwab Corporation | 0.01 | -33.90 | 0.67 | -24.52 | 0.0432 | 0.0106 | |||
| CI / The Cigna Group | 0.00 | 0.00 | 0.66 | -20.27 | 0.0427 | 0.0121 | |||
| KFRC / Kforce Inc. | 0.01 | 28.54 | 0.65 | 18.65 | 0.0422 | 0.0219 | |||
| ESE / ESCO Technologies Inc. | 0.00 | -9.04 | 0.65 | -6.10 | 0.0421 | 0.0165 | |||
| VEU / Vanguard International Equity Index Funds - Vanguard FTSE All-World ex-US ETF | 0.01 | 0.00 | 0.65 | -8.90 | 0.0420 | 0.0157 | |||
| KFY / Korn Ferry | 0.01 | -9.01 | 0.64 | -18.46 | 0.0413 | 0.0124 | |||
| CSW / CSW Industrials, Inc. | 0.00 | -36.18 | 0.63 | -38.50 | 0.0410 | 0.0029 | |||
| AVGO / Broadcom Inc. | 0.00 | 0.00 | 0.62 | 34.42 | 0.0404 | 0.0232 | |||
| ALG / Alamo Group Inc. | 0.00 | 6.46 | 0.59 | 9.85 | 0.0384 | 0.0185 | |||
| STC / Stewart Information Services Corporation | 0.01 | -8.99 | 0.59 | -17.80 | 0.0384 | 0.0117 | |||
| AEIS / Advanced Energy Industries, Inc. | 0.01 | -9.01 | 0.58 | 0.00 | 0.0377 | 0.0162 | |||
| MCRI / Monarch Casino & Resort, Inc. | 0.01 | -9.00 | 0.58 | -9.53 | 0.0377 | 0.0139 | |||
| GLEASON-WESTSIDE INVESTMENTS / SHS (37733A996) | 0.00 | 0.57 | 0.0000 | ||||||
| YUM / Yum! Brands, Inc. | 0.00 | 7.31 | 0.55 | 2.99 | 0.0358 | 0.0160 | |||
| BAC / Bank of America Corporation | 0.01 | -8.41 | 0.55 | 1.49 | 0.0355 | 0.0155 | |||
| CL / Colgate-Palmolive Company | 0.01 | 1.47 | 0.54 | -11.17 | 0.0352 | 0.0126 | |||
| SAIA / Saia, Inc. | 0.00 | 0.00 | 0.53 | 4.30 | 0.0347 | 0.0157 | |||
| ACWX / iShares Trust - iShares MSCI ACWI ex U.S. ETF | 0.01 | 0.00 | 0.53 | -8.90 | 0.0346 | 0.0129 | |||
| DG / Dollar General Corporation | 0.01 | -89.59 | 0.53 | -90.68 | 0.0342 | -0.1750 | |||
| KALU / Kaiser Aluminum Corporation | 0.01 | -9.02 | 0.51 | -11.94 | 0.0331 | 0.0117 | |||
| GOLF / Acushnet Holdings Corp. | 0.01 | -9.02 | 0.50 | 1.61 | 0.0327 | 0.0143 | |||
| VIRTUAL RIGHTS MANAGEMENT LL / SHS (91258A907) | 0.10 | 0.50 | 0.0000 | ||||||
| IWS / iShares Trust - iShares Russell Mid-Cap Value ETF | 0.00 | 0.00 | 0.50 | -2.17 | 0.0322 | 0.0134 | |||
| NVEE / NV5 Global, Inc. | 0.03 | 362.91 | 0.49 | -6.65 | 0.0319 | 0.0124 | |||
| BRP / The Baldwin Insurance Group, Inc. | 0.01 | -8.88 | 0.49 | -29.19 | 0.0319 | 0.0062 | |||
| SBCF / Seacoast Banking Corporation of Florida | 0.02 | 16.10 | 0.49 | 20.00 | 0.0316 | 0.0166 | |||
| T / AT&T Inc. | 0.02 | -1.32 | 0.47 | 2.16 | 0.0307 | 0.0136 | |||
| REET / iShares Trust - iShares Global REIT ETF | 0.02 | 4.33 | 0.46 | -6.30 | 0.0300 | 0.0117 | |||
| CTS / CTS Corporation | 0.01 | -9.01 | 0.43 | -0.69 | 0.0281 | 0.0119 | |||
| CPK / Chesapeake Utilities Corporation | 0.00 | -9.02 | 0.43 | -11.11 | 0.0281 | 0.0101 | |||
| COHU / Cohu, Inc. | 0.02 | -9.03 | 0.43 | -5.48 | 0.0281 | 0.0111 | |||
| SHO / Sunstone Hotel Investors, Inc. | 0.04 | -9.02 | 0.42 | 4.48 | 0.0273 | 0.0124 | |||
| RAMP / LiveRamp Holdings, Inc. | 0.01 | 0.41 | 0.0269 | 0.0269 | |||||
| RSP / Invesco Exchange-Traded Fund Trust - Invesco S&P 500 Equal Weight ETF | 0.00 | -45.48 | 0.41 | -46.76 | 0.0268 | -0.0019 | |||
| OBK / Origin Bancorp, Inc. | 0.01 | 5.32 | 0.41 | 9.04 | 0.0267 | 0.0127 | |||
| DCI / Donaldson Company, Inc. | 0.01 | 0.00 | 0.40 | -8.74 | 0.0258 | 0.0097 | |||
| AVNS / Avanos Medical, Inc. | 0.02 | 12.33 | 0.39 | -25.67 | 0.0255 | 0.0059 | |||
| CTRE / CareTrust REIT, Inc. | 0.01 | -9.03 | 0.39 | -20.37 | 0.0255 | 0.0072 | |||
| VTLE / Vital Energy, Inc. | 0.01 | 1.37 | 0.39 | 16.62 | 0.0251 | 0.0128 | |||
| ADP / Automatic Data Processing, Inc. | 0.00 | -0.90 | 0.39 | 4.62 | 0.0251 | 0.0114 | |||
| LHTV / Lightstone Value Plus REIT I, Inc. | 0.03 | 0.00 | 0.37 | 0.00 | 0.0240 | 0.0103 | |||
| CASS / Cass Information Systems, Inc. | 0.01 | -9.04 | 0.35 | -10.23 | 0.0228 | 0.0083 | |||
| VIAV / Viavi Solutions Inc. | 0.03 | -9.01 | 0.35 | 1.77 | 0.0224 | 0.0099 | |||
| MBWM / Mercantile Bank Corporation | 0.01 | 6.55 | 0.35 | 8.49 | 0.0224 | 0.0106 | |||
| NTST / NETSTREIT Corp. | 0.02 | 0.34 | 0.0224 | 0.0224 | |||||
| VGT / Vanguard World Fund - Vanguard Information Technology ETF | 0.00 | 0.34 | 0.0223 | 0.0223 | |||||
| SUPN / Supernus Pharmaceuticals, Inc. | 0.01 | -8.98 | 0.33 | 5.75 | 0.0215 | 0.0099 | |||
| VTHR / Vanguard Scottsdale Funds - Vanguard Russell 3000 ETF | 0.00 | 0.00 | 0.33 | 2.17 | 0.0215 | 0.0095 | |||
| GEV / GE Vernova Inc. | 0.00 | 0.00 | 0.33 | 28.91 | 0.0215 | 0.0120 | |||
| KMB / Kimberly-Clark Corporation | 0.00 | -0.32 | 0.33 | -8.08 | 0.0215 | 0.0081 | |||
| IYW / iShares Trust - iShares U.S. Technology ETF | 0.00 | 0.00 | 0.32 | 5.28 | 0.0207 | 0.0095 | |||
| EEM / iShares, Inc. - iShares MSCI Emerging Markets ETF | 0.01 | 0.00 | 0.32 | -8.93 | 0.0206 | 0.0077 | |||
| DIA / SPDR Dow Jones Industrial Average ETF Trust | 0.00 | 0.00 | 0.31 | 0.66 | 0.0198 | 0.0086 | |||
| SLP / Simulations Plus, Inc. | 0.01 | 12.28 | 0.30 | -2.26 | 0.0197 | 0.0082 | |||
| VTWO / Vanguard Scottsdale Funds - Vanguard Russell 2000 ETF | 0.00 | 1.83 | 0.30 | 1.71 | 0.0193 | 0.0085 | |||
| EA / Electronic Arts Inc. | 0.00 | -93.46 | 0.29 | -93.35 | 0.0192 | -0.1447 | |||
| MTB / M&T Bank Corporation | 0.00 | 0.00 | 0.28 | 5.60 | 0.0184 | 0.0085 | |||
| C / Citigroup Inc. | 0.00 | -4.07 | 0.25 | 7.83 | 0.0162 | 0.0076 | |||
| NOW / ServiceNow, Inc. | 0.00 | 0.00 | 0.25 | 18.66 | 0.0161 | 0.0084 | |||
| IWO / iShares Trust - iShares Russell 2000 Growth ETF | 0.00 | 0.00 | 0.25 | 1.23 | 0.0161 | 0.0070 | |||
| TT / Trane Technologies plc | 0.00 | 0.00 | 0.25 | -5.04 | 0.0160 | 0.0064 | |||
| TPL / Texas Pacific Land Corporation | 0.00 | -24.31 | 0.24 | -5.12 | 0.0157 | 0.0062 | |||
| IWF / iShares Trust - iShares Russell 1000 Growth ETF | 0.00 | 0.00 | 0.24 | 7.27 | 0.0153 | 0.0072 | |||
| DD / DuPont de Nemours, Inc. | 0.00 | 0.00 | 0.22 | -14.50 | 0.0146 | 0.0049 | |||
| BA / The Boeing Company | 0.00 | 0.21 | 0.0139 | 0.0139 | |||||
| VXUS / Vanguard STAR Funds - Vanguard Total International Stock ETF | 0.00 | 0.00 | 0.21 | -8.97 | 0.0138 | 0.0052 | |||
| AWK / American Water Works Company, Inc. | 0.00 | -17.18 | 0.21 | -29.67 | 0.0138 | 0.0026 | |||
| ISRG / Intuitive Surgical, Inc. | 0.00 | 0.21 | 0.0079 | 0.0079 | |||||
| RSG / Republic Services, Inc. | 0.00 | 0.00 | 0.20 | 0.50 | 0.0131 | 0.0056 | |||
| AMCR / Amcor plc | 0.02 | 0.00 | 0.15 | -17.03 | 0.0098 | 0.0031 | |||
| ARES REAL ESTATE INCOME TR C / SHS (09186L100) | 0.02 | 0.14 | 0.0000 | ||||||
| MARDA PROPERTIES, LLC / SHS (56642A905) | 0.00 | -100.00 | 0.00 | 0.0000 | |||||
| C.WSA / Citigroup, Inc. | 0.00 | -100.00 | 0.00 | 0.0000 | |||||
| SPSC / SPS Commerce, Inc. | 0.00 | -100.00 | 0.00 | -100.00 | -0.0171 | ||||
| SEAOF / SeaCo Ltd. | 0.02 | 0.00 | 0.00 | 0.0000 | 0.0000 | ||||
| AMWD / American Woodmark Corporation | 0.00 | -100.00 | 0.00 | -100.00 | -0.0143 | ||||
| CAT / Caterpillar Inc. | 0.00 | -100.00 | 0.00 | -100.00 | -0.0080 | ||||
| CNX / CNX Resources Corporation | 0.00 | -100.00 | 0.00 | 0.0000 |