Mga Batayang Estadistika
| Profil Orang Dalam | FJ Capital Management LLC |
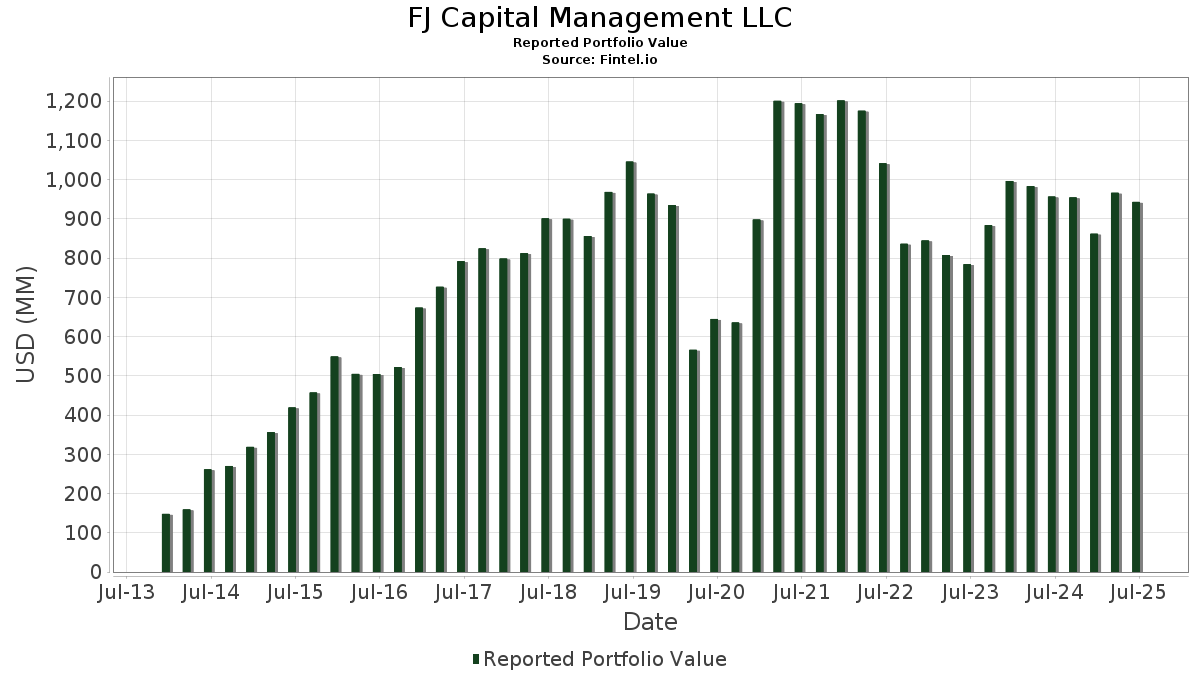
| Nilai Portofolio | $ 942,980,010 |
| Posisi Saat Ini | 128 |
Kepemilikan Terbaru, Kinerja, AUM (dari 13F, 13D)
FJ Capital Management LLC telah mengungkapkan total kepemilikan 128 dalam pengajuan SEC terbaru mereka. Nilai portofolio terbaru dihitung sebesar $ 942,980,010 USD. Aset yang Dikelola (AUM) sebenarnya adalah nilai ini ditambah kas (yang tidak diungkapkan). Aset-aset utama FJ Capital Management LLC adalah HomeTrust Bancshares, Inc. (US:HTB) , SouthState Corporation (US:SSB) , Equity Bancshares, Inc. (US:EQBK) , Western Alliance Bancorporation (US:WAL) , and Independent Bank Corp. (US:INDB) . Posisi baru FJ Capital Management LLC meliputi: Morgan Stanley (US:MS) , Mercury General Corporation (US:MCY) , Marex Group plc (US:MRX) , Houlihan Lokey, Inc. (US:HLI) , and CME Group Inc. (US:CME) . Industri unggulan FJ Capital Management LLC adalah "Building Construction General Contractors And Operative Builders" (sic 15) , "Security And Commodity Brokers, Dealers, Exchanges, And Services" (sic 62) , and "Non-depository Credit Institutions" (sic 61) .
Peningkatan Tertinggi Kuartal Ini
Kami menggunakan perubahan dalam alokasi portofolio karena ini adalah metrik yang paling bermakna. Perubahan dapat disebabkan oleh perdagangan atau perubahan harga saham.
| Keamanan | Saham (MM) |
Nilai (Juta Dolar AS) |
Portfolio % | ΔPorsyento ng Portfolio |
|---|---|---|---|---|
| 1.15 | 31.89 | 3.3814 | 2.3376 | |
| 0.70 | 64.64 | 6.8546 | 1.5110 | |
| 1.37 | 19.18 | 2.0344 | 1.4862 | |
| 0.30 | 10.30 | 1.0919 | 1.0919 | |
| 0.55 | 42.82 | 4.5412 | 1.0224 | |
| 0.27 | 15.37 | 1.6295 | 1.0108 | |
| 0.65 | 40.83 | 4.3302 | 1.0000 | |
| 0.06 | 8.13 | 0.8618 | 0.8618 | |
| 0.62 | 13.17 | 1.3968 | 0.7430 | |
| 1.73 | 64.83 | 6.8747 | 0.7264 |
Penurunan Tertinggi Kuartal Ini
Kami menggunakan perubahan dalam alokasi portofolio karena ini adalah metrik yang paling bermakna. Perubahan dapat disebabkan oleh perdagangan atau perubahan harga saham.
| Keamanan | Saham (MM) |
Nilai (Juta Dolar AS) |
Portfolio % | ΔPorsyento ng Portfolio |
|---|---|---|---|---|
| 0.02 | 1.26 | 0.1333 | -1.8790 | |
| 0.08 | 2.37 | 0.2519 | -1.1741 | |
| 0.63 | 7.47 | 0.7920 | -0.9996 | |
| 0.61 | 3.34 | 0.3538 | -0.7648 | |
| 0.01 | 1.71 | 0.1809 | -0.5739 | |
| 0.60 | 38.97 | 4.1327 | -0.5465 | |
| 0.01 | 0.29 | 0.0302 | -0.5308 | |
| 0.01 | 1.34 | 0.1417 | -0.3961 | |
| 0.00 | 0.28 | 0.0302 | -0.3892 | |
| 0.24 | 7.89 | 0.8367 | -0.3742 |
Pengajuan 13D/G
Ini adalah daftar pengajuan 13D dan 13G yang dibuat dalam setahun terakhir (jika ada). Klik ikon tautan untuk melihat riwayat transaksi lengkap. Baris berwarna hijau menunjukkan posisi baru. Baris berwarna merah menunjukkan posisi yang sudah ditutup.
| Tanggal File | Formulir | Keamanan | Sebelumnya Saham |
Saat ini Saham |
ΔPersentase Saham | % Kepemilikan |
% ΔKepemilikan | |
|---|---|---|---|---|---|---|---|---|
| 2025-08-13 | RVSB / Riverview Bancorp, Inc. | 1,912,970 | 606,634 | -68.29 | 2.89 | -68.31 | ||
| 2025-08-13 | FVCB / FVCBankcorp, Inc. | 1,685,555 | 632,902 | -62.45 | 3.52 | -61.61 | ||
| 2025-08-13 | FSFG / First Savings Financial Group, Inc. | 609,854 | 498,246 | -18.30 | 7.20 | -18.92 | ||
| 2025-08-13 | FDSB / Fifth District Bancorp, Inc. | 364,949 | 247,691 | -32.13 | 4.46 | -32.01 | ||
| 2025-08-13 | ESSA / ESSA Bancorp, Inc. | 884,194 | 684,979 | -22.53 | 6.75 | -22.50 | ||
| 2025-08-13 | SBFG / SB Financial Group, Inc. | 371,571 | 265,791 | -28.47 | 4.07 | -27.19 | ||
| 2025-08-13 | EQBK / Equity Bancshares, Inc. | 1,206,571 | 1,126,096 | -6.67 | 6.43 | -6.68 | ||
| 2025-08-13 | CZWI / Citizens Community Bancorp, Inc. | 648,859 | 489,611 | -24.54 | 4.90 | -24.27 | ||
| 2025-08-13 | CBNA / Chain Bridge Bancorp, Inc. | 338,236 | 293,788 | -13.14 | 9.42 | -13.10 | ||
| 2025-08-13 | RBB / RBB Bancorp | 1,756,006 | 1,766,083 | 0.57 | 9.96 | 0.61 | ||
| 2025-08-13 | HBCP / Home Bancorp, Inc. | 440,433 | 30,731 | -93.02 | 0.39 | -92.83 | ||
| 2025-05-14 | LNKB / LINKBANCORP, Inc. | 3,539,938 | 3,728,660 | 5.33 | 9.98 | 5.39 | ||
| 2025-05-14 | HTBK / Heritage Commerce Corp | 3,383,156 | 2,364,824 | -30.10 | 3.85 | -30.25 | ||
| 2025-05-14 | HTB / HomeTrust Bancshares, Inc. | 1,627,586 | 1,732,877 | 6.47 | 9.86 | 6.25 | ||
| 2025-05-09 | SBT / Sterling Bancorp, Inc. (Southfield, MI) | 4,300,157 | 4,002,428 | -6.92 | 7.65 | -6.93 | ||
| 2025-02-11 | OPOF / Old Point Financial Corporation | 0 | 0.00 | |||||
| 2025-02-07 | HMNF / HMN Financial, Inc. | 0 | 0.00 | |||||
| 2025-02-05 | EVBN / Evans Bancorp, Inc. | 493,510 | ||||||
| 2025-02-05 | FCCO / First Community Corporation | 255,796 | 3.35 | |||||
| 2025-02-05 | HWBK / Hawthorn Bancshares, Inc. | 334,849 | 4.79 | |||||
| 2024-11-13 | OSBC / Old Second Bancorp, Inc. | 2,647,725 | 1,870,988 | -29.34 | 4.17 | -29.56 | ||
| 2024-11-13 | SFST / Southern First Bancshares, Inc. | 791,009 | 807,223 | 2.05 | 9.90 | 1.23 | ||
| 2024-11-13 | PBFS / Pioneer Bancorp, Inc. | 1,607,359 | 803,529 | -50.01 | 3.07 | -50.40 | ||
| 2024-11-13 | SFBC / Sound Financial Bancorp, Inc. | 203,574 | 118,866 | -41.61 | 4.64 | -41.12 | ||
| 2024-11-13 | IBCP / Independent Bank Corporation | 1,288,658 | 805,367 | -37.50 | 3.85 | -37.70 | ||
| 2024-11-13 | FBMS / The First Bancshares, Inc. | 1,579,236 | 167,274 | -89.41 | 0.54 | -89.33 | ||
| 2024-11-13 | CVLY / Codorus Valley Bancorp, Inc. | 855,131 | 0 | -100.00 | 0.00 | -100.00 | ||
| 2024-11-13 | MSBI / Midland States Bancorp, Inc. | 1,269,108 | 8,257 | -99.35 | 0.04 | -99.32 | ||
| 2024-11-12 | SMBC / Southern Missouri Bancorp, Inc. | 608,264 | 431,687 | -29.03 | 3.83 | -28.68 |
Pengajuan 13F dan Dana
Formulir ini diajukan pada 2025-08-14 untuk periode pelaporan 2025-06-30. Klik ikon tautan untuk melihat riwayat transaksi selengkapnya.
Tingkatkan ke versi premium untuk membuka data premium dan ekspor ke Excel. ![]() .
.
| Keamanan | Ketik | Harga Saham Rata-rata | Saham (MM) |
ΔSaham (%) |
ΔSaham (%) |
Nilai ($MM) |
Portpolyo (%) |
ΔPortofolio (%) |
|
|---|---|---|---|---|---|---|---|---|---|
| HTB / HomeTrust Bancshares, Inc. | 1.73 | 0.00 | 64.83 | 9.13 | 6.8747 | 0.7264 | |||
| SSB / SouthState Corporation | 0.70 | 26.27 | 64.64 | 25.20 | 6.8546 | 1.5110 | |||
| EQBK / Equity Bancshares, Inc. | 1.13 | -6.67 | 45.94 | -3.35 | 4.8723 | -0.0480 | |||
| WAL / Western Alliance Bancorporation | 0.55 | 24.10 | 42.82 | 25.96 | 4.5412 | 1.0224 | |||
| INDB / Independent Bank Corp. | 0.65 | 26.43 | 40.83 | 26.91 | 4.3302 | 1.0000 | |||
| ABCB / Ameris Bancorp | 0.60 | -23.30 | 38.97 | -13.80 | 4.1327 | -0.5465 | |||
| WBS / Webster Financial Corporation | 0.68 | 5.58 | 37.12 | 11.83 | 3.9368 | 0.5008 | |||
| OSBC / Old Second Bancorp, Inc. | 1.84 | 1.47 | 32.59 | 8.18 | 3.4565 | 0.3380 | |||
| SBCF / Seacoast Banking Corporation of Florida | 1.15 | 194.55 | 31.89 | 216.19 | 3.3814 | 2.3376 | |||
| SFST / Southern First Bancshares, Inc. | 0.81 | 0.00 | 30.70 | 15.52 | 3.2555 | 0.5051 | |||
| RBB / RBB Bancorp | 1.77 | 0.57 | 30.39 | 4.90 | 3.2232 | 0.2244 | |||
| LNKB / LINKBANCORP, Inc. | 3.73 | 0.00 | 27.26 | 7.82 | 2.8905 | 0.2739 | |||
| HTBK / Heritage Commerce Corp | 2.34 | -0.85 | 23.28 | 3.42 | 2.4691 | 0.1390 | |||
| ZION / Zions Bancorporation, National Association | 0.44 | 3.30 | 22.99 | 7.60 | 2.4376 | 0.2267 | |||
| MOFG / MidWestOne Financial Group, Inc. | 0.77 | 2.51 | 22.04 | -0.40 | 2.3377 | 0.0469 | |||
| IBCP / Independent Bank Corporation | 0.66 | -2.70 | 21.54 | 2.42 | 2.2845 | 0.1074 | |||
| QCRH / QCR Holdings, Inc. | 0.30 | -1.55 | 20.13 | -6.27 | 2.1352 | -0.0882 | |||
| BCAL / California BanCorp. | 1.27 | 20.20 | 20.04 | 32.19 | 2.1253 | 0.5562 | |||
| BANC / Banc of California, Inc. | 1.37 | 265.79 | 19.18 | 262.24 | 2.0344 | 1.4862 | |||
| SMBC / Southern Missouri Bancorp, Inc. | 0.28 | -19.64 | 15.50 | -15.38 | 1.6437 | -0.2521 | |||
| CBU / Community Financial System, Inc. | 0.27 | 157.02 | 15.37 | 157.09 | 1.6295 | 1.0108 | |||
| ESSA / ESSA Bancorp, Inc. | 0.68 | -22.53 | 13.29 | -20.27 | 1.4092 | -0.3158 | |||
| ONB / Old National Bancorp | 0.62 | 107.06 | 13.17 | 108.53 | 1.3968 | 0.7430 | |||
| TOWN / TowneBank | 0.30 | 10.30 | 1.0919 | 1.0919 | |||||
| BUSE / First Busey Corporation | 0.41 | 1.88 | 9.39 | 7.95 | 0.9955 | 0.0954 | |||
| MPB / Mid Penn Bancorp, Inc. | 0.33 | -5.23 | 9.27 | 3.15 | 0.9830 | 0.0529 | |||
| WFC / Wells Fargo & Company | 0.11 | 4.97 | 8.42 | 17.15 | 0.8927 | 0.1489 | |||
| MS / Morgan Stanley | 0.06 | 8.13 | 0.8618 | 0.8618 | |||||
| MBIN / Merchants Bancorp | 0.24 | -24.55 | 7.89 | -32.57 | 0.8367 | -0.3742 | |||
| JMSB / John Marshall Bancorp, Inc. | 0.41 | 29.12 | 7.66 | 44.84 | 0.8123 | 0.2649 | |||
| CBNA / Chain Bridge Bancorp, Inc. | 0.29 | -13.14 | 7.57 | -5.88 | 0.8029 | -0.0296 | |||
| FFWM / First Foundation Inc. | 1.48 | 964.20 | 7.54 | 945.77 | 0.7997 | 0.7250 | |||
| FVCB / FVCBankcorp, Inc. | 0.63 | -61.35 | 7.47 | -56.86 | 0.7920 | -0.9996 | |||
| FSFG / First Savings Financial Group, Inc. | 0.28 | -28.29 | 7.08 | -30.30 | 0.7511 | -0.3006 | |||
| USB / U.S. Bancorp | 0.15 | 2.87 | 6.81 | 10.26 | 0.7226 | 0.0829 | |||
| HWBK / Hawthorn Bancshares, Inc. | 0.22 | -26.17 | 6.44 | -23.79 | 0.6834 | -0.1918 | |||
| JLL / Jones Lang LaSalle Incorporated | 0.02 | 38.51 | 5.72 | 42.93 | 0.6063 | 0.1922 | |||
| WTFC / Wintrust Financial Corporation | 0.04 | -16.99 | 5.57 | -8.48 | 0.5906 | -0.0393 | |||
| CZWI / Citizens Community Bancorp, Inc. | 0.38 | -29.33 | 5.29 | -32.18 | 0.5615 | -0.2466 | |||
| SBFG / SB Financial Group, Inc. | 0.27 | -28.47 | 5.08 | -34.38 | 0.5384 | -0.2623 | |||
| THG / The Hanover Insurance Group, Inc. | 0.03 | 267.41 | 4.68 | 258.79 | 0.4958 | 0.3609 | |||
| WELL / Welltower Inc. | 0.03 | 32.91 | 4.37 | 33.35 | 0.4639 | 0.1244 | |||
| TMHC / Taylor Morrison Home Corporation | 0.07 | -6.44 | 4.27 | -4.28 | 0.4533 | -0.0089 | |||
| PHM / PulteGroup, Inc. | 0.04 | 4.26 | 0.4517 | 0.4517 | |||||
| BRO / Brown & Brown, Inc. | 0.04 | 3.99 | 0.4228 | 0.4228 | |||||
| PX / P10, Inc. | 0.37 | -17.05 | 3.74 | -27.84 | 0.3963 | -0.1398 | |||
| SYF / Synchrony Financial | 0.05 | 692.51 | 3.62 | 900.83 | 0.3843 | 0.3467 | |||
| CINF / Cincinnati Financial Corporation | 0.02 | -22.66 | 3.37 | -22.05 | 0.3578 | -0.0901 | |||
| RVSB / Riverview Bancorp, Inc. | 0.61 | -68.29 | 3.34 | -69.13 | 0.3538 | -0.7648 | |||
| RGA / Reinsurance Group of America, Incorporated | 0.02 | -6.53 | 3.27 | -5.85 | 0.3468 | -0.0126 | |||
| FDSB / Fifth District Bancorp, Inc. | 0.25 | -32.13 | 3.06 | -31.31 | 0.3244 | -0.1364 | |||
| RITM / Rithm Capital Corp. | 0.25 | 45.11 | 2.78 | 43.08 | 0.2949 | 0.0937 | |||
| HTGC / Hercules Capital, Inc. | 0.15 | 60.33 | 2.75 | 52.55 | 0.2916 | 0.1051 | |||
| NMIH / NMI Holdings, Inc. | 0.06 | 2.68 | 0.2846 | 0.2846 | |||||
| MCY / Mercury General Corporation | 0.04 | 2.56 | 0.2719 | 0.2719 | |||||
| NDAQ / Nasdaq, Inc. | 0.03 | 2.49 | 0.2636 | 0.2636 | |||||
| MRX / Marex Group plc | 0.06 | 2.47 | 0.2624 | 0.2624 | |||||
| LADR / Ladder Capital Corp | 0.23 | -10.10 | 2.45 | -15.32 | 0.2603 | -0.0396 | |||
| MAA / Mid-America Apartment Communities, Inc. | 0.02 | 34.81 | 2.45 | 19.08 | 0.2601 | 0.0469 | |||
| PLMR / Palomar Holdings, Inc. | 0.02 | -32.77 | 2.44 | -24.36 | 0.2586 | -0.0751 | |||
| WSBC / WesBanco, Inc. | 0.08 | -83.13 | 2.37 | -82.77 | 0.2519 | -1.1741 | |||
| AHR / American Healthcare REIT, Inc. | 0.06 | 9.34 | 2.31 | 32.61 | 0.2454 | 0.0648 | |||
| GSHD / Goosehead Insurance, Inc | 0.02 | -37.08 | 2.29 | -43.76 | 0.2429 | -0.1787 | |||
| ADC / Agree Realty Corporation | 0.03 | 161.54 | 2.20 | 147.75 | 0.2333 | 0.1413 | |||
| HLI / Houlihan Lokey, Inc. | 0.01 | 2.17 | 0.2306 | 0.2306 | |||||
| CME / CME Group Inc. | 0.01 | 2.15 | 0.2278 | 0.2278 | |||||
| NPB / Northpointe Bancshares, Inc. | 0.15 | 0.00 | 2.13 | -5.05 | 0.2254 | -0.0063 | |||
| UCB / United Community Banks, Inc. | 0.07 | -43.59 | 2.02 | -40.27 | 0.2139 | -0.1355 | |||
| MRP / Millrose Properties, Inc. | 0.07 | 1.89 | 0.2009 | 0.2009 | |||||
| PECO / Phillips Edison & Company, Inc. | 0.05 | 53.15 | 1.73 | 47.03 | 0.1837 | 0.0618 | |||
| HCI / HCI Group, Inc. | 0.01 | -77.06 | 1.71 | -76.60 | 0.1809 | -0.5739 | |||
| AKR / Acadia Realty Trust | 0.09 | 13.66 | 1.67 | 0.73 | 0.1767 | 0.0055 | |||
| ARI / Apollo Commercial Real Estate Finance, Inc. | 0.17 | 1.60 | 0.1697 | 0.1697 | |||||
| JCAP / Jefferson Capital, Inc. | 0.09 | 1.59 | 0.1690 | 0.1690 | |||||
| SKWD / Skyward Specialty Insurance Group, Inc. | 0.03 | -62.48 | 1.54 | -59.04 | 0.1635 | -0.2259 | |||
| LKFN / Lakeland Financial Corporation | 0.02 | 1.34 | 0.1420 | 0.1420 | |||||
| GL / Globe Life Inc. | 0.01 | -72.75 | 1.34 | -74.29 | 0.1417 | -0.3961 | |||
| HBCP / Home Bancorp, Inc. | 0.02 | -94.41 | 1.26 | -93.54 | 0.1333 | -1.8790 | |||
| ARES / Ares Management Corporation | 0.01 | 1.20 | 0.1269 | 0.1269 | |||||
| EZPW / EZCORP, Inc. | 0.08 | 1.16 | 0.1230 | 0.1230 | |||||
| NLY / Annaly Capital Management, Inc. | 0.05 | 0.99 | 0.1054 | 0.1054 | |||||
| ALLY / Ally Financial Inc. | 0.02 | 0.93 | 0.0987 | 0.0987 | |||||
| VNO / Vornado Realty Trust | 0.02 | 216.56 | 0.90 | 227.74 | 0.0953 | 0.0669 | |||
| JHG / Janus Henderson Group plc | 0.02 | -23.03 | 0.85 | -17.23 | 0.0901 | -0.0162 | |||
| AMP / Ameriprise Financial, Inc. | 0.00 | 0.80 | 0.0854 | 0.0854 | |||||
| APAM / Artisan Partners Asset Management Inc. | 0.02 | 0.78 | 0.0825 | 0.0825 | |||||
| CSWC / Capital Southwest Corporation | 0.04 | -12.51 | 0.77 | -13.65 | 0.0820 | -0.0106 | |||
| EXR / Extra Space Storage Inc. | 0.01 | 0.77 | 0.0817 | 0.0817 | |||||
| SMA / SmartStop Self Storage REIT, Inc. | 0.02 | 0.76 | 0.0804 | 0.0804 | |||||
| BHF / Brighthouse Financial, Inc. | 0.01 | 0.68 | 0.0725 | 0.0725 | |||||
| CUZ / Cousins Properties Incorporated | 0.02 | 33.13 | 0.66 | 35.39 | 0.0699 | 0.0196 | |||
| SBRA / Sabra Health Care REIT, Inc. | 0.04 | 0.65 | 0.0690 | 0.0690 | |||||
| V / Visa Inc. | 0.00 | -38.82 | 0.64 | -38.01 | 0.0680 | -0.0391 | |||
| HIW / Highwoods Properties, Inc. | 0.02 | 182.32 | 0.62 | 196.15 | 0.0654 | 0.0438 | |||
| CPT / Camden Property Trust | 0.01 | 86.87 | 0.61 | 72.39 | 0.0650 | 0.0282 | |||
| TRV / The Travelers Companies, Inc. | 0.00 | -56.92 | 0.59 | -56.41 | 0.0624 | -0.0773 | |||
| RWT / Redwood Trust, Inc. | 0.09 | 0.55 | 0.0582 | 0.0582 | |||||
| CCAP / Crescent Capital BDC, Inc. | 0.04 | 0.53 | 0.0563 | 0.0563 | |||||
| ACIW / ACI Worldwide, Inc. | 0.01 | 0.43 | 0.0453 | 0.0453 | |||||
| VOYA / Voya Financial, Inc. | 0.01 | 0.40 | 0.0425 | 0.0425 | |||||
| QTWO / Q2 Holdings, Inc. | 0.00 | 4.98 | 0.40 | 22.98 | 0.0420 | 0.0086 | |||
| DLR / Digital Realty Trust, Inc. | 0.00 | 0.39 | 0.0415 | 0.0415 | |||||
| BEN / Franklin Resources, Inc. | 0.02 | 0.39 | 0.0414 | 0.0414 | |||||
| AMT / American Tower Corporation | 0.00 | 0.69 | 0.39 | 2.37 | 0.0412 | 0.0019 | |||
| UNM / Unum Group | 0.00 | 0.39 | 0.0411 | 0.0411 | |||||
| OWL / Blue Owl Capital Inc. | 0.02 | -81.08 | 0.39 | -81.89 | 0.0410 | -0.1796 | |||
| FI / Fiserv, Inc. | 0.00 | 23.12 | 0.36 | -3.99 | 0.0384 | -0.0006 | |||
| HFBL / Home Federal Bancorp, Inc. of Louisiana | 0.02 | 0.00 | 0.34 | 4.32 | 0.0359 | 0.0023 | |||
| UHT / Universal Health Realty Income Trust | 0.01 | 0.33 | 0.0351 | 0.0351 | |||||
| CCNE / CNB Financial Corporation | 0.01 | 0.00 | 0.32 | 2.59 | 0.0337 | 0.0017 | |||
| FIS / Fidelity National Information Services, Inc. | 0.00 | 4.74 | 0.29 | 14.45 | 0.0311 | 0.0045 | |||
| BLK / BlackRock, Inc. | 0.00 | 0.29 | 0.0310 | 0.0310 | |||||
| SFBC / Sound Financial Bancorp, Inc. | 0.01 | -94.27 | 0.29 | -94.74 | 0.0302 | -0.5308 | |||
| ALL / The Allstate Corporation | 0.00 | -92.77 | 0.28 | -92.99 | 0.0302 | -0.3892 | |||
| DAVE / Dave Inc. | 0.00 | 0.28 | 0.0298 | 0.0298 | |||||
| TOST / Toast, Inc. | 0.01 | 0.28 | 0.0292 | 0.0292 | |||||
| SLG / SL Green Realty Corp. | 0.00 | 0.27 | 0.0284 | 0.0284 | |||||
| MSCI / MSCI Inc. | 0.00 | -71.01 | 0.26 | -70.53 | 0.0279 | -0.0642 | |||
| UNH / UnitedHealth Group Incorporated | 0.00 | 0.26 | 0.0276 | 0.0276 | |||||
| STEP / StepStone Group Inc. | 0.00 | 0.26 | 0.0274 | 0.0274 | |||||
| EPRT / Essential Properties Realty Trust, Inc. | 0.01 | 0.24 | 0.0254 | 0.0254 | |||||
| KKR / KKR & Co. Inc. | 0.00 | -76.28 | 0.23 | -72.73 | 0.0248 | -0.0640 | |||
| NTST / NETSTREIT Corp. | 0.01 | 0.23 | 0.0247 | 0.0247 | |||||
| GABC / German American Bancorp, Inc. | 0.01 | 0.23 | 0.0242 | 0.0242 | |||||
| WPC / W. P. Carey Inc. | 0.00 | 0.22 | 0.0230 | 0.0230 | |||||
| BNL / Broadstone Net Lease, Inc. | 0.01 | 8.19 | 0.20 | 2.00 | 0.0217 | 0.0009 | |||
| CG / The Carlyle Group Inc. | 0.00 | 0.20 | 0.0215 | 0.0215 | |||||
| AMBC / Ambac Financial Group, Inc. | 0.02 | 0.18 | 0.0186 | 0.0186 | |||||
| FIBK / First Interstate BancSystem, Inc. | 0.00 | -100.00 | 0.00 | 0.0000 | |||||
| TFSL / TFS Financial Corporation | 0.00 | -100.00 | 0.00 | 0.0000 | |||||
| TRTX / TPG RE Finance Trust, Inc. | 0.00 | -100.00 | 0.00 | 0.0000 | |||||
| GLPI / Gaming and Leisure Properties, Inc. | 0.00 | -100.00 | 0.00 | 0.0000 | |||||
| PSA / Public Storage | 0.00 | -100.00 | 0.00 | 0.0000 | |||||
| DOC / Healthpeak Properties, Inc. | 0.00 | -100.00 | 0.00 | 0.0000 | |||||
| WTW / Willis Towers Watson Public Limited Company | 0.00 | -100.00 | 0.00 | 0.0000 | |||||
| REG / Regency Centers Corporation | 0.00 | -100.00 | 0.00 | 0.0000 | |||||
| FCFS / FirstCash Holdings, Inc. | 0.00 | -100.00 | 0.00 | 0.0000 | |||||
| SCHW / The Charles Schwab Corporation | 0.00 | -100.00 | 0.00 | 0.0000 | |||||
| TOL / Toll Brothers, Inc. | 0.00 | -100.00 | 0.00 | 0.0000 | |||||
| FDS / FactSet Research Systems Inc. | 0.00 | -100.00 | 0.00 | 0.0000 | |||||
| SBT / Sterling Bancorp, Inc. (Southfield, MI) | 0.00 | -100.00 | 0.00 | 0.0000 | |||||
| CMA / Comerica Incorporated | 0.00 | -100.00 | 0.00 | 0.0000 | |||||
| CNC / Centene Corporation | 0.00 | -100.00 | 0.00 | -100.00 | -0.0393 | ||||
| C / Citigroup Inc. | 0.00 | -100.00 | 0.00 | 0.0000 | |||||
| CNO / CNO Financial Group, Inc. | 0.00 | -100.00 | 0.00 | 0.0000 | |||||
| TSLX / Sixth Street Specialty Lending, Inc. | 0.00 | -100.00 | 0.00 | 0.0000 | |||||
| COOP / Mr. Cooper Group Inc. | 0.00 | -100.00 | 0.00 | 0.0000 | |||||
| DHI / D.R. Horton, Inc. | 0.00 | -100.00 | 0.00 | 0.0000 | |||||
| ARCC / Ares Capital Corporation | 0.00 | -100.00 | 0.00 | 0.0000 | |||||
| JEF / Jefferies Financial Group Inc. | 0.00 | -100.00 | 0.00 | 0.0000 | |||||
| EQH / Equitable Holdings, Inc. | 0.00 | -100.00 | 0.00 | 0.0000 | |||||
| DX / Dynex Capital, Inc. | 0.00 | -100.00 | 0.00 | 0.0000 | |||||
| FAF / First American Financial Corporation | 0.00 | -100.00 | 0.00 | 0.0000 | |||||
| FR / First Industrial Realty Trust, Inc. | 0.00 | -100.00 | 0.00 | 0.0000 | |||||
| VIRT / Virtu Financial, Inc. | 0.00 | -100.00 | 0.00 | 0.0000 |