Mga Batayang Estadistika
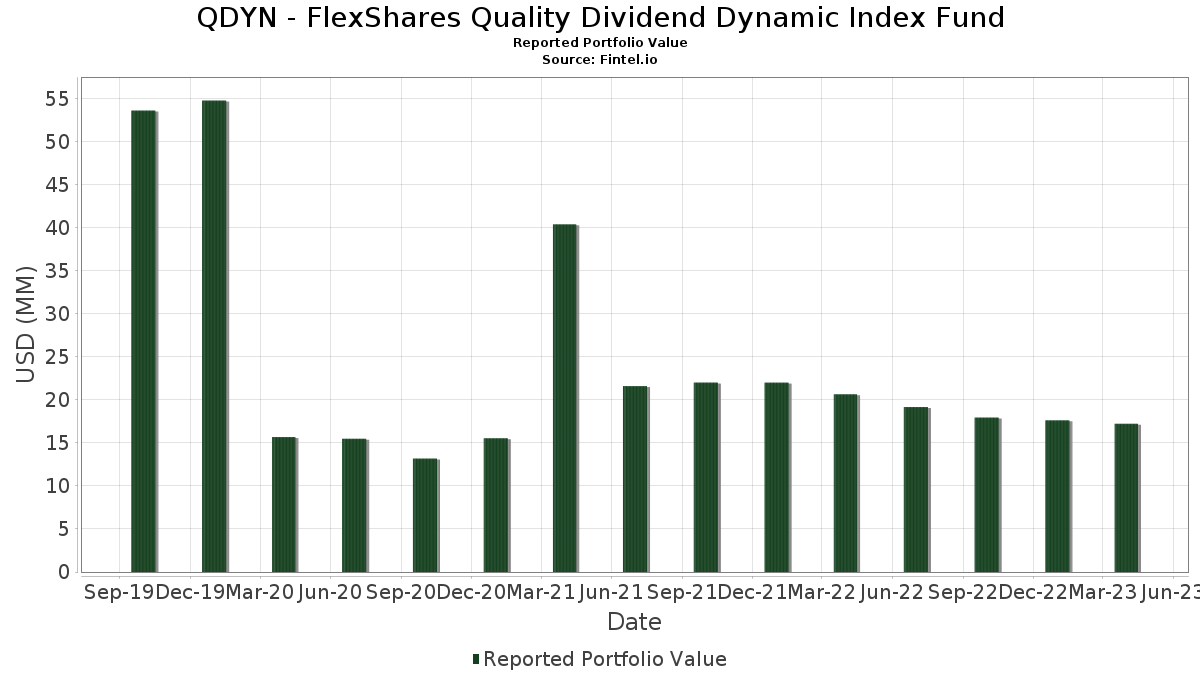
| Nilai Portofolio | $ 17,208,348 |
| Posisi Saat Ini | 131 |
Kepemilikan Terbaru, Kinerja, AUM (dari 13F, 13D)
QDYN - FlexShares Quality Dividend Dynamic Index Fund telah mengungkapkan total kepemilikan 131 dalam pengajuan SEC terbaru mereka. Nilai portofolio terbaru dihitung sebesar $ 17,208,348 USD. Aset yang Dikelola (AUM) sebenarnya adalah nilai ini ditambah kas (yang tidak diungkapkan). Aset-aset utama QDYN - FlexShares Quality Dividend Dynamic Index Fund adalah Apple Inc. (US:AAPL) , Microsoft Corporation (US:MSFT) , Johnson & Johnson (US:JNJ) , Broadcom Inc. (US:AVGO) , and Cisco Systems, Inc. (US:CSCO) . Posisi baru QDYN - FlexShares Quality Dividend Dynamic Index Fund meliputi: First American Financial Corporation (US:FAF) , MGIC Investment Corporation (US:MTG) , The Mosaic Company (US:MOS) , Warner Music Group Corp. (US:WMG) , and PBF Energy Inc. (US:PBF) .
Peningkatan Tertinggi Kuartal Ini
Kami menggunakan perubahan dalam alokasi portofolio karena ini adalah metrik yang paling bermakna. Perubahan dapat disebabkan oleh perdagangan atau perubahan harga saham.
| Keamanan | Saham (MM) |
Nilai (Juta Dolar AS) |
Portfolio % | ΔPorsyento ng Portfolio |
|---|---|---|---|---|
| 0.00 | 0.97 | 5.5597 | 1.5632 | |
| 0.01 | 1.68 | 9.5829 | 1.4873 | |
| 0.00 | 0.23 | 1.2881 | 1.2599 | |
| 0.00 | 0.22 | 1.2311 | 1.0774 | |
| 0.01 | 0.40 | 2.3052 | 0.6121 | |
| 0.00 | 0.09 | 0.4936 | 0.4936 | |
| 0.01 | 0.08 | 0.4831 | 0.4831 | |
| 0.00 | 0.19 | 1.1031 | 0.4677 | |
| 0.00 | 0.08 | 0.4582 | 0.4582 | |
| 0.00 | 0.08 | 0.4553 | 0.4553 |
Penurunan Tertinggi Kuartal Ini
Kami menggunakan perubahan dalam alokasi portofolio karena ini adalah metrik yang paling bermakna. Perubahan dapat disebabkan oleh perdagangan atau perubahan harga saham.
| Keamanan | Saham (MM) |
Nilai (Juta Dolar AS) |
Portfolio % | ΔPorsyento ng Portfolio |
|---|---|---|---|---|
| 0.00 | 0.00 | -1.8647 | ||
| 0.00 | 0.00 | -1.3929 | ||
| 0.00 | 0.00 | -0.8043 | ||
| 0.15 | 0.8783 | -0.6233 | ||
| 0.00 | 0.00 | -0.5772 | ||
| 0.00 | 0.00 | -0.5772 | ||
| 0.00 | 0.00 | -0.4810 | ||
| 0.00 | 0.00 | -0.4803 | ||
| 0.00 | 0.00 | -0.4644 | ||
| 0.02 | 0.1394 | -0.4386 |
Pengajuan 13F dan Dana
Formulir ini diajukan pada 2023-06-26 untuk periode pelaporan 2023-04-30. Klik ikon tautan untuk melihat riwayat transaksi selengkapnya.
Tingkatkan ke versi premium untuk membuka data premium dan ekspor ke Excel. ![]() .
.
| Keamanan | Ketik | Harga Saham Rata-rata | Saham (MM) |
ΔSaham (%) |
ΔSaham (%) |
Nilai ($MM) |
Portpolyo (%) |
ΔPortofolio (%) |
|
|---|---|---|---|---|---|---|---|---|---|
| AAPL / Apple Inc. | 0.01 | -0.48 | 1.68 | 17.03 | 9.5829 | 1.4873 | |||
| MSFT / Microsoft Corporation | 0.00 | 10.92 | 0.97 | 37.62 | 5.5597 | 1.5632 | |||
| JNJ / Johnson & Johnson | 0.00 | -0.34 | 0.57 | -0.17 | 3.2650 | 0.0315 | |||
| AVGO / Broadcom Inc. | 0.00 | 0.00 | 0.56 | 7.13 | 3.1775 | 0.2441 | |||
| CSCO / Cisco Systems, Inc. | 0.01 | -0.92 | 0.43 | -3.81 | 2.4515 | -0.0681 | |||
| ABT / Abbott Laboratories | 0.00 | 0.00 | 0.41 | 0.00 | 2.3623 | 0.0251 | |||
| PFE / Pfizer Inc. | 0.01 | -0.57 | 0.41 | -12.34 | 2.3136 | -0.2987 | |||
| CMCSA / Comcast Corporation | 0.01 | 28.03 | 0.40 | 34.78 | 2.3052 | 0.6121 | |||
| ABBV / AbbVie Inc. | 0.00 | 0.00 | 0.34 | 2.10 | 1.9472 | 0.0650 | |||
| MA / Mastercard Incorporated | 0.00 | -1.37 | 0.33 | 1.23 | 1.8754 | 0.0422 | |||
| HD / The Home Depot, Inc. | 0.00 | 17.57 | 0.31 | 9.06 | 1.7921 | 0.1666 | |||
| UPS / United Parcel Service, Inc. | 0.00 | -0.74 | 0.29 | -3.67 | 1.6514 | -0.0430 | |||
| LOW / Lowe's Companies, Inc. | 0.00 | -0.88 | 0.28 | -1.06 | 1.6096 | 0.0009 | |||
| AMGN / Amgen Inc. | 0.00 | 0.00 | 0.27 | -4.88 | 1.5610 | -0.0638 | |||
| ACN / Accenture plc | 0.00 | -8.05 | 0.27 | -7.56 | 1.5369 | -0.1082 | |||
| UNP / Union Pacific Corporation | 0.00 | -0.89 | 0.26 | -5.11 | 1.4889 | -0.0608 | |||
| C.WSA / Citigroup, Inc. | 0.00 | 4,700.00 | 0.23 | 4,400.00 | 1.2881 | 1.2599 | |||
| KO / The Coca-Cola Company | 0.00 | 656.76 | 0.22 | 696.30 | 1.2311 | 1.0774 | |||
| AMAT / Applied Materials, Inc. | 0.00 | -0.65 | 0.21 | 0.48 | 1.1930 | 0.0221 | |||
| C / Citigroup Inc. | 0.00 | -0.58 | 0.19 | -10.19 | 1.1098 | -0.1145 | |||
| NVDA / NVIDIA Corporation | 0.00 | 20.83 | 0.19 | 72.32 | 1.1031 | 0.4677 | |||
| MO / Altria Group, Inc. | 0.00 | -0.30 | 0.19 | 5.00 | 1.0843 | 0.0650 | |||
| ITW / Illinois Tool Works Inc. | 0.00 | 0.00 | 0.17 | 2.48 | 0.9452 | 0.0335 | |||
| Treasury Repurchase Agreement / RA (N/A) | 0.15 | -42.26 | 0.8783 | -0.6233 | |||||
| XOM / Exxon Mobil Corporation | 0.00 | 0.00 | 0.15 | 2.04 | 0.8598 | 0.0265 | |||
| MPC / Marathon Petroleum Corporation | 0.00 | -1.00 | 0.14 | -6.49 | 0.8278 | -0.0430 | |||
| MMM / 3M Company | 0.00 | -1.96 | 0.13 | -9.29 | 0.7280 | -0.0674 | |||
| PG / The Procter & Gamble Company | 0.00 | 0.00 | 0.13 | 9.65 | 0.7181 | 0.0717 | |||
| OXY / Occidental Petroleum Corporation | 0.00 | 0.00 | 0.12 | -4.62 | 0.7085 | -0.0291 | |||
| HON / Honeywell International Inc. | 0.00 | -1.92 | 0.12 | -6.15 | 0.6985 | -0.0361 | |||
| ROP / Roper Technologies, Inc. | 0.00 | 5.00 | 0.11 | 11.76 | 0.6546 | 0.0762 | |||
| UNH / UnitedHealth Group Incorporated | 0.00 | -9.52 | 0.11 | -10.40 | 0.6408 | -0.0695 | |||
| V / Visa Inc. | 0.00 | -2.56 | 0.11 | -0.93 | 0.6061 | -0.0022 | |||
| MAR / Marriott International, Inc. | 0.00 | 18.18 | 0.11 | 15.38 | 0.6035 | 0.0842 | |||
| CTAS / Cintas Corporation | 0.00 | 0.00 | 0.10 | 1.98 | 0.5935 | 0.0222 | |||
| AFL / Aflac Incorporated | 0.00 | 0.00 | 0.10 | -4.67 | 0.5841 | -0.0235 | |||
| FAST / Fastenal Company | 0.00 | 6.76 | 0.10 | 14.61 | 0.5830 | 0.0761 | |||
| GWW / W.W. Grainger, Inc. | 0.00 | -14.29 | 0.10 | 1.01 | 0.5721 | 0.0129 | |||
| DOW / Dow Inc. | 0.00 | -10.84 | 0.10 | -18.64 | 0.5518 | -0.1158 | |||
| SNA / Snap-on Incorporated | 0.00 | -3.12 | 0.10 | 1.05 | 0.5512 | 0.0118 | |||
| OC / Owens Corning | 0.00 | -8.54 | 0.10 | 1.05 | 0.5491 | 0.0120 | |||
| RDN / Radian Group Inc. | 0.00 | 324.52 | 0.10 | 493.75 | 0.5473 | 0.4206 | |||
| BYD / Boyd Gaming Corporation | 0.00 | -6.56 | 0.09 | 3.30 | 0.5423 | 0.0271 | |||
| JPM / JPMorgan Chase & Co. | 0.00 | 1.79 | 0.09 | 0.00 | 0.5401 | 0.0090 | |||
| LYB / LyondellBasell Industries N.V. | 0.00 | -12.63 | 0.09 | -14.55 | 0.5382 | -0.0842 | |||
| MET / MetLife, Inc. | 0.00 | 0.00 | 0.09 | -16.07 | 0.5380 | -0.0953 | |||
| MCHP / Microchip Technology Incorporated | 0.00 | -7.76 | 0.09 | -13.89 | 0.5353 | -0.0748 | |||
| RRR / Red Rock Resorts, Inc. | 0.00 | -2.44 | 0.09 | 5.68 | 0.5352 | 0.0350 | |||
| RRC / Range Resources Corporation | 0.00 | 178.30 | 0.09 | 200.00 | 0.5348 | 0.3551 | |||
| NUE / Nucor Corporation | 0.00 | -13.33 | 0.09 | -23.97 | 0.5281 | -0.1591 | |||
| PAYX / Paychex, Inc. | 0.00 | 0.00 | 0.09 | -5.15 | 0.5271 | -0.0225 | |||
| ODFL / Old Dominion Freight Line, Inc. | 0.00 | -11.11 | 0.09 | -14.02 | 0.5270 | -0.0827 | |||
| AOS / A. O. Smith Corporation | 0.00 | 0.00 | 0.09 | 1.11 | 0.5242 | 0.0104 | |||
| AMP / Ameriprise Financial, Inc. | 0.00 | -3.85 | 0.09 | -16.51 | 0.5228 | -0.0940 | |||
| IGT / International Game Technology PLC | 0.00 | -6.92 | 0.09 | -1.10 | 0.5188 | 0.0008 | |||
| UNM / Unum Group | 0.00 | -1.11 | 0.09 | 0.00 | 0.5148 | 0.0022 | |||
| SCCO / Southern Copper Corporation | 0.00 | -26.75 | 0.09 | -9.18 | 0.5108 | 0.0322 | |||
| WY / Weyerhaeuser Company | 0.00 | 0.40 | 0.09 | -12.75 | 0.5105 | -0.0681 | |||
| VOYA / Voya Financial, Inc. | 0.00 | 1.04 | 0.09 | 11.25 | 0.5085 | 0.0546 | |||
| LAMR / Lamar Advertising Company | 0.00 | -5.41 | 0.09 | -6.38 | 0.5070 | -0.0272 | |||
| COF / Capital One Financial Corporation | 0.00 | -1.30 | 0.09 | -19.27 | 0.5068 | -0.1141 | |||
| PRU / Prudential Financial, Inc. | 0.00 | 5.00 | 0.09 | -13.00 | 0.5009 | -0.0680 | |||
| BK / The Bank of New York Mellon Corporation | 0.00 | -9.04 | 0.09 | -23.68 | 0.4992 | -0.1451 | |||
| HST / Host Hotels & Resorts, Inc. | 0.01 | 714.55 | 0.09 | 616.67 | 0.4965 | 0.4263 | |||
| FAF / First American Financial Corporation | 0.00 | 0.09 | 0.4936 | 0.4936 | |||||
| APA / APA Corporation | 0.00 | 18.40 | 0.09 | -1.16 | 0.4875 | -0.0022 | |||
| MRO / Marathon Oil Corporation | 0.00 | 15.81 | 0.08 | 1.20 | 0.4852 | 0.0142 | |||
| MTG / MGIC Investment Corporation | 0.01 | 0.08 | 0.4831 | 0.4831 | |||||
| TPR / Tapestry, Inc. | 0.00 | -17.70 | 0.08 | -26.32 | 0.4811 | -0.1643 | |||
| MGY / Magnolia Oil & Gas Corporation | 0.00 | 20.29 | 0.08 | 7.69 | 0.4806 | 0.0390 | |||
| FANG / Diamondback Energy, Inc. | 0.00 | -2.00 | 0.08 | -4.60 | 0.4776 | -0.0175 | |||
| WSM / Williams-Sonoma, Inc. | 0.00 | 1.79 | 0.08 | -8.89 | 0.4729 | -0.0392 | |||
| TER / Teradyne, Inc. | 0.00 | -8.54 | 0.08 | -18.00 | 0.4697 | -0.0954 | |||
| BRX / Brixmor Property Group Inc. | 0.00 | 4.23 | 0.08 | -5.81 | 0.4678 | -0.0217 | |||
| LPX / Louisiana-Pacific Corporation | 0.00 | -3.39 | 0.08 | -15.62 | 0.4668 | -0.0777 | |||
| FRT / Federal Realty Investment Trust | 0.00 | 0.00 | 0.08 | -12.09 | 0.4609 | -0.0530 | |||
| MOS / The Mosaic Company | 0.00 | 0.08 | 0.4582 | 0.4582 | |||||
| PFG / Principal Financial Group, Inc. | 0.00 | 1.14 | 0.08 | -18.56 | 0.4556 | -0.0963 | |||
| RHI / Robert Half Inc. | 0.00 | -5.21 | 0.08 | -17.71 | 0.4553 | -0.0909 | |||
| WMG / Warner Music Group Corp. | 0.00 | 0.08 | 0.4553 | 0.4553 | |||||
| SM / SM Energy Company | 0.00 | 48.43 | 0.08 | 27.42 | 0.4542 | 0.1001 | |||
| JHG / Janus Henderson Group plc | 0.00 | -11.46 | 0.08 | -11.24 | 0.4535 | -0.0523 | |||
| BBY / Best Buy Co., Inc. | 0.00 | -12.00 | 0.08 | -26.42 | 0.4495 | -0.1517 | |||
| STX / Seagate Technology Holdings plc | 0.00 | -18.38 | 0.08 | -29.09 | 0.4471 | -0.1775 | |||
| APLE / Apple Hospitality REIT, Inc. | 0.01 | -2.91 | 0.08 | -18.95 | 0.4429 | -0.0941 | |||
| OMF / OneMain Holdings, Inc. | 0.00 | 86.67 | 0.08 | 67.39 | 0.4418 | 0.1787 | |||
| NXST / Nexstar Media Group, Inc. | 0.00 | -11.90 | 0.08 | -25.24 | 0.4399 | -0.1429 | |||
| EQR / Equity Residential | 0.00 | -0.98 | 0.08 | -1.30 | 0.4378 | -0.0021 | |||
| CC / The Chemours Company | 0.00 | -0.92 | 0.07 | -20.21 | 0.4284 | -0.1067 | |||
| TGNA / TEGNA Inc. | 0.00 | 2.54 | 0.07 | -11.90 | 0.4266 | -0.0528 | |||
| JEF / Jefferies Financial Group Inc. | 0.00 | 51.97 | 0.07 | 25.42 | 0.4237 | 0.0857 | |||
| BBWI / Bath & Body Works, Inc. | 0.00 | 76.77 | 0.07 | 35.19 | 0.4210 | 0.1124 | |||
| SIRI / Sirius XM Holdings Inc. | 0.02 | 39.69 | 0.07 | -8.86 | 0.4162 | -0.0326 | |||
| EQH / Equitable Holdings, Inc. | 0.00 | 18.46 | 0.07 | -4.00 | 0.4115 | -0.0123 | |||
| ZIM / ZIM Integrated Shipping Services Ltd. | 0.00 | 23.83 | 0.07 | 12.90 | 0.4013 | 0.0456 | |||
| CVX / Chevron Corporation | 0.00 | -2.86 | 0.07 | -6.85 | 0.3928 | -0.0199 | |||
| CVI / CVR Energy, Inc. | 0.00 | 24.71 | 0.07 | -1.45 | 0.3918 | 0.0003 | |||
| PXD / Pioneer Natural Resources Company | 0.00 | 44.44 | 0.07 | 36.73 | 0.3877 | 0.1067 | |||
| BXP / Boston Properties, Inc. | 0.00 | 0.95 | 0.07 | -27.96 | 0.3877 | -0.1427 | |||
| MAS / Masco Corporation | 0.00 | -0.94 | 0.07 | 0.00 | 0.3851 | 0.0030 | |||
| WU / The Western Union Company | 0.01 | -2.49 | 0.07 | -25.00 | 0.3813 | -0.1199 | |||
| WH / Wyndham Hotels & Resorts, Inc. | 0.00 | 1.25 | 0.07 | -10.81 | 0.3787 | -0.0414 | |||
| PPL / PPL Corporation | 0.00 | -1.03 | 0.07 | -2.94 | 0.3779 | -0.0112 | |||
| CFR / Cullen/Frost Bankers, Inc. | 0.00 | -1.96 | 0.07 | -16.46 | 0.3778 | -0.0724 | |||
| EBAY / eBay Inc. | 0.00 | 0.00 | 0.06 | -6.06 | 0.3564 | -0.0193 | |||
| M / Macy's, Inc. | 0.00 | -0.95 | 0.06 | -31.46 | 0.3517 | -0.1559 | |||
| POWI / Power Integrations, Inc. | 0.00 | 1.47 | 0.06 | -14.29 | 0.3442 | -0.0525 | |||
| LNC / Lincoln National Corporation | 0.00 | 8.33 | 0.06 | -33.33 | 0.3211 | -0.1567 | |||
| OLN / Olin Corporation | 0.00 | 0.00 | 0.05 | -14.04 | 0.2810 | -0.0429 | |||
| LLY / Eli Lilly and Company | 0.00 | 0.00 | 0.05 | 14.63 | 0.2713 | 0.0381 | |||
| PBF / PBF Energy Inc. | 0.00 | 0.05 | 0.2580 | 0.2580 | |||||
| CTSH / Cognizant Technology Solutions Corporation | 0.00 | 1.72 | 0.04 | -8.70 | 0.2415 | -0.0209 | |||
| MRK / Merck & Co., Inc. | 0.00 | 0.00 | 0.03 | 6.25 | 0.1979 | 0.0159 | |||
| DVN / Devon Energy Corporation | 0.00 | -61.16 | 0.03 | -67.03 | 0.1721 | -0.3464 | |||
| KFY / Korn Ferry | 0.00 | -2.04 | 0.03 | -12.90 | 0.1580 | -0.0213 | |||
| PEP / PepsiCo, Inc. | 0.00 | 0.00 | 0.03 | 12.50 | 0.1570 | 0.0179 | |||
| BAC / Bank of America Corporation | 0.00 | -2.56 | 0.03 | -21.21 | 0.1525 | -0.0350 | |||
| AIG / American International Group, Inc. | 0.00 | 0.00 | 0.03 | -16.67 | 0.1454 | -0.0259 | |||
| S&P 500 Micro E-Mini Index / DE (N/A) | 0.02 | -92.05 | 0.1394 | -0.4386 | |||||
| IPG / The Interpublic Group of Companies, Inc. | 0.00 | -76.09 | 0.02 | -77.00 | 0.1347 | -0.4335 | |||
| RHP / Ryman Hospitality Properties, Inc. | 0.00 | 5.26 | 0.02 | 0.00 | 0.1229 | 0.0033 | |||
| DLB / Dolby Laboratories, Inc. | 0.00 | -76.74 | 0.02 | -75.61 | 0.1147 | -0.3489 | |||
| ALLY / Ally Financial Inc. | 0.00 | -3.28 | 0.02 | -21.74 | 0.1067 | -0.0276 | |||
| AGNC / AGNC Investment Corp. | 0.00 | -76.97 | 0.02 | -80.49 | 0.0931 | -0.3746 | |||
| COST / Costco Wholesale Corporation | 0.00 | -33.33 | 0.01 | -33.33 | 0.0690 | -0.0349 | |||
| G / Genpact Limited | 0.00 | 8.12 | 0.01 | 0.00 | 0.0644 | 0.0019 | |||
| WMT / Walmart Inc. | 0.00 | -62.73 | 0.01 | -62.50 | 0.0517 | -0.0581 | |||
| CHK / Chesapeake Energy Corporation | 0.00 | 0.01 | 0.0510 | 0.0510 | |||||
| USB / U.S. Bancorp | 0.00 | 7.69 | 0.01 | -28.57 | 0.0302 | -0.0101 | |||
| MCD / McDonald's Corporation | 0.00 | 8.33 | 0.00 | 0.00 | 0.0220 | 0.0038 | |||
| BSY / Bentley Systems, Incorporated | 0.00 | 0.00 | 0.0146 | 0.0146 | |||||
| X / United States Steel Corporation | 0.00 | -100.00 | 0.00 | -100.00 | -0.5772 | ||||
| HIW / Highwoods Properties, Inc. | 0.00 | -100.00 | 0.00 | -100.00 | -0.3684 | ||||
| NSP / Insperity, Inc. | 0.00 | -100.00 | 0.00 | -100.00 | -0.4644 | ||||
| PEAK / Healthpeak Properties, Inc. | 0.00 | -100.00 | 0.00 | -100.00 | -0.5772 | ||||
| FCX / Freeport-McMoRan Inc. | 0.00 | -100.00 | 0.00 | -100.00 | -0.8043 | ||||
| T.PRC / AT&T Inc. - Preferred Stock | 0.00 | -100.00 | 0.00 | -100.00 | -0.4803 | ||||
| PM / Philip Morris International Inc. | 0.00 | -100.00 | 0.00 | -100.00 | -1.8647 | ||||
| PLD / Prologis, Inc. | 0.00 | -100.00 | 0.00 | -100.00 | -1.3929 | ||||
| AES / The AES Corporation | 0.00 | -100.00 | 0.00 | -100.00 | -0.4810 |