Mga Batayang Estadistika
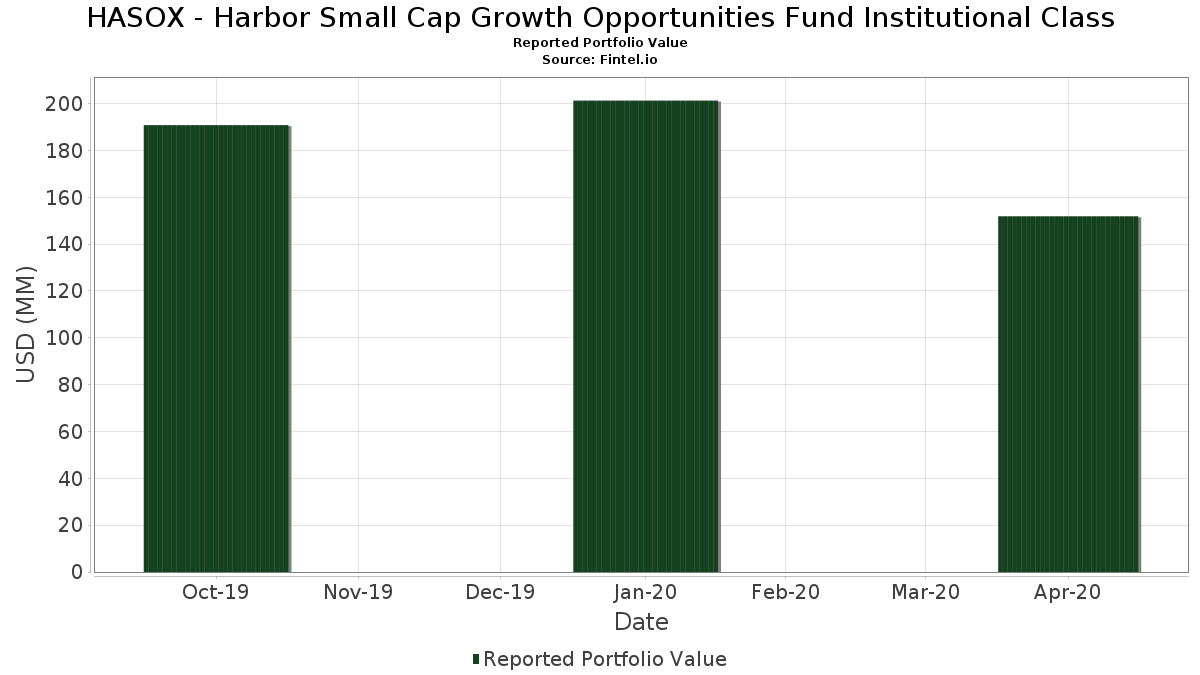
| Nilai Portofolio | $ 151,879,791 |
| Posisi Saat Ini | 92 |
Kepemilikan Terbaru, Kinerja, AUM (dari 13F, 13D)
HASOX - Harbor Small Cap Growth Opportunities Fund Institutional Class telah mengungkapkan total kepemilikan 92 dalam pengajuan SEC terbaru mereka. Nilai portofolio terbaru dihitung sebesar $ 151,879,791 USD. Aset yang Dikelola (AUM) sebenarnya adalah nilai ini ditambah kas (yang tidak diungkapkan). Aset-aset utama HASOX - Harbor Small Cap Growth Opportunities Fund Institutional Class adalah iShares Trust - iShares Russell 2000 Growth ETF (US:IWO) , iShares Trust - iShares Russell 2000 ETF (US:IWM) , Cerus Corporation (US:CERS) , Quotient Technology Inc (US:QUOT) , and Ligand Pharmaceuticals Incorporated (US:LGND) . Posisi baru HASOX - Harbor Small Cap Growth Opportunities Fund Institutional Class meliputi: iShares Trust - iShares Russell 2000 Growth ETF (US:IWO) , iShares Trust - iShares Russell 2000 ETF (US:IWM) , Intra-Cellular Therapies, Inc. (US:ITCI) , Enviri Corp (US:HSC) , and .
Peningkatan Tertinggi Kuartal Ini
Kami menggunakan perubahan dalam alokasi portofolio karena ini adalah metrik yang paling bermakna. Perubahan dapat disebabkan oleh perdagangan atau perubahan harga saham.
| Keamanan | Saham (MM) |
Nilai (Juta Dolar AS) |
Portfolio % | ΔPorsyento ng Portfolio |
|---|---|---|---|---|
| 0.05 | 8.64 | 5.3808 | 5.3808 | |
| 0.06 | 8.25 | 5.1381 | 5.1381 | |
| 1.31 | 8.03 | 4.9971 | 2.0296 | |
| 0.12 | 2.55 | 1.5906 | 0.7251 | |
| 0.05 | 0.86 | 0.5367 | 0.5367 | |
| 0.20 | 2.33 | 1.4524 | 0.4824 | |
| 0.05 | 4.60 | 2.8634 | 0.4302 | |
| 0.06 | 0.65 | 0.4017 | 0.4017 | |
| 0.13 | 2.94 | 1.8289 | 0.3919 | |
| 0.05 | 1.64 | 1.0204 | 0.3460 |
Penurunan Tertinggi Kuartal Ini
Kami menggunakan perubahan dalam alokasi portofolio karena ini adalah metrik yang paling bermakna. Perubahan dapat disebabkan oleh perdagangan atau perubahan harga saham.
| Keamanan | Saham (MM) |
Nilai (Juta Dolar AS) |
Portfolio % | ΔPorsyento ng Portfolio |
|---|---|---|---|---|
| 0.00 | 0.00 | -1.0352 | ||
| 0.37 | 0.92 | 0.5739 | -0.8814 | |
| 0.46 | 0.75 | 0.4674 | -0.8784 | |
| 0.24 | 2.15 | 1.3397 | -0.7912 | |
| 0.69 | 4.93 | 3.0705 | -0.7717 | |
| 0.27 | 0.95 | 0.5899 | -0.7267 | |
| 0.81 | 2.78 | 1.7298 | -0.7150 | |
| 0.00 | 0.00 | -0.6928 | ||
| 0.02 | 1.16 | 0.7241 | -0.6462 | |
| 0.03 | 0.62 | 0.3855 | -0.5735 |
Pengajuan 13F dan Dana
Formulir ini diajukan pada 2020-06-22 untuk periode pelaporan 2020-04-30. Klik ikon tautan untuk melihat riwayat transaksi selengkapnya.
Tingkatkan ke versi premium untuk membuka data premium dan ekspor ke Excel. ![]() .
.
| Keamanan | Ketik | Harga Saham Rata-rata | Saham (MM) |
ΔSaham (%) |
ΔSaham (%) |
Nilai ($MM) |
Portpolyo (%) |
ΔPortofolio (%) |
|
|---|---|---|---|---|---|---|---|---|---|
| IWO / iShares Trust - iShares Russell 2000 Growth ETF | 0.05 | 8.64 | 5.3808 | 5.3808 | |||||
| IWM / iShares Trust - iShares Russell 2000 ETF | 0.06 | 8.25 | 5.1381 | 5.1381 | |||||
| CERS / Cerus Corporation | 1.31 | -12.76 | 8.03 | 33.79 | 4.9971 | 2.0296 | |||
| QUOT / Quotient Technology Inc | 0.69 | -10.95 | 4.93 | -36.51 | 3.0705 | -0.7717 | |||
| LGND / Ligand Pharmaceuticals Incorporated | 0.05 | -16.70 | 4.60 | -6.49 | 2.8634 | 0.4302 | |||
| INFN / Infinera Corporation | 0.57 | -10.95 | 3.54 | -25.52 | 2.2031 | -0.1467 | |||
| OSPN / OneSpan Inc. | 0.19 | -10.95 | 3.24 | -9.99 | 2.0200 | 0.2370 | |||
| IVC / Invacare Corp. | 0.39 | -10.95 | 2.96 | -12.93 | 1.8459 | 0.1617 | |||
| HALO / Halozyme Therapeutics, Inc. | 0.13 | -15.28 | 2.94 | 1.10 | 1.8289 | 0.3919 | |||
| EVH / Evolent Health, Inc. | 0.41 | -10.95 | 2.92 | -36.31 | 1.8196 | -0.4501 | |||
| SNCR / Synchronoss Technologies, Inc. | 0.81 | -10.95 | 2.78 | -43.79 | 1.7298 | -0.7150 | |||
| IRDM / Iridium Communications Inc. | 0.11 | -10.95 | 2.59 | -21.55 | 1.6096 | -0.0208 | |||
| KPTI / Karyopharm Therapeutics Inc. | 0.12 | 6.95 | 2.55 | 46.03 | 1.5906 | 0.7251 | |||
| HCSG / Healthcare Services Group, Inc. | 0.10 | -10.95 | 2.44 | -11.34 | 1.5196 | 0.1579 | |||
| FOLD / Amicus Therapeutics, Inc. | 0.20 | -10.95 | 2.33 | 18.98 | 1.4524 | 0.4824 | |||
| MAXR / Maxar Technologies Inc | 0.18 | -10.95 | 2.25 | -29.66 | 1.4001 | -0.1809 | |||
| ATGE / Adtalem Global Education Inc. | 0.07 | -1.24 | 2.24 | -9.08 | 1.3959 | 0.1760 | |||
| TVTY / Tivity Health Inc | 0.24 | 20.54 | 2.15 | -50.06 | 1.3397 | -0.7912 | |||
| PCRX / Pacira BioSciences, Inc. | 0.05 | -23.21 | 2.01 | -26.64 | 1.2537 | -0.1041 | |||
| MXL / MaxLinear, Inc. | 0.12 | -10.95 | 1.99 | -24.67 | 1.2382 | -0.0675 | |||
| RXN / Rexnord Corp | 0.07 | -10.95 | 1.95 | -25.62 | 1.2166 | -0.0830 | |||
| NDLS / Noodles & Company | 0.31 | -16.49 | 1.95 | -26.92 | 1.2139 | -0.1056 | |||
| 636220204 / National General Holdings Corp | 0.10 | -10.95 | 1.91 | -22.16 | 1.1900 | -0.0246 | |||
| CRY / Artivion Inc | 0.09 | -3.45 | 1.91 | -27.52 | 1.1877 | -0.1141 | |||
| MTOR / Meritor Inc | 0.09 | -10.95 | 1.82 | -16.67 | 1.1328 | 0.0526 | |||
| ICPT / Intercept Pharmaceuticals Inc | 0.02 | 3.15 | 1.80 | -8.57 | 1.1227 | 0.1471 | |||
| CHDN / Churchill Downs Incorporated | 0.02 | -10.95 | 1.77 | -38.19 | 1.0998 | -0.3139 | |||
| SGRY / Surgery Partners, Inc. | 0.14 | -10.95 | 1.68 | -37.72 | 1.0459 | -0.2882 | |||
| YETI / YETI Holdings, Inc. | 0.06 | 10.41 | 1.65 | -16.17 | 1.0268 | 0.0537 | |||
| PETQ / PetIQ, Inc. | 0.06 | -10.95 | 1.65 | -14.37 | 1.0243 | 0.0737 | |||
| GO / Grocery Outlet Holding Corp. | 0.05 | 18.30 | 1.64 | 20.18 | 1.0204 | 0.3460 | |||
| FRPT / Freshpet, Inc. | 0.02 | -21.47 | 1.63 | -5.85 | 1.0129 | 0.1584 | |||
| ICUI / ICU Medical, Inc. | 0.01 | -10.95 | 1.59 | 7.02 | 0.9876 | 0.2545 | |||
| STMP / Stamps.com Inc. | 0.01 | -66.71 | 1.57 | -29.26 | 0.9756 | -0.1202 | |||
| HRTX / Heron Therapeutics, Inc. | 0.11 | -3.75 | 1.53 | -34.21 | 0.9523 | -0.1977 | |||
| US45772F1075 / Inphi Corporation | 0.02 | -10.95 | 1.49 | 13.15 | 0.9273 | 0.2763 | |||
| ENS / EnerSys | 0.03 | -10.94 | 1.49 | -27.75 | 0.9263 | -0.0922 | |||
| TMX / Terminix Global Holdings Inc | 0.04 | -10.95 | 1.48 | -15.89 | 0.9229 | 0.0511 | |||
| AGIO / Agios Pharmaceuticals, Inc. | 0.04 | -10.94 | 1.45 | -24.83 | 0.9031 | -0.0513 | |||
| VCRA / Vocera Communication Inc | 0.08 | -10.95 | 1.44 | -23.34 | 0.8937 | -0.0328 | |||
| EYE / National Vision Holdings, Inc. | 0.05 | -24.90 | 1.41 | -41.65 | 0.8748 | -0.3168 | |||
| GBT / Global Blood Therapeutics Inc. | 0.02 | -8.08 | 1.39 | 7.75 | 0.8657 | 0.2275 | |||
| ACHC / Acadia Healthcare Company, Inc. | 0.06 | -10.95 | 1.35 | -33.46 | 0.8432 | -0.1636 | |||
| ESNT / Essent Group Ltd. | 0.05 | -2.63 | 1.32 | -46.41 | 0.8192 | -0.3947 | |||
| US55027E1029 / Luminex Corporation | 0.03 | -71.02 | 1.25 | -53.93 | 0.7770 | -0.5634 | |||
| MEI / Methode Electronics, Inc. | 0.04 | -10.95 | 1.23 | -18.40 | 0.7680 | 0.0205 | |||
| CLVS / Clovis Oncology Inc | 0.16 | -10.95 | 1.18 | -18.26 | 0.7360 | 0.0206 | |||
| 872307903 / TCF Financial Corporation | 0.04 | -10.95 | 1.18 | -37.46 | 0.7329 | -0.1983 | |||
| PTCT / PTC Therapeutics, Inc. | 0.02 | -57.53 | 1.16 | -58.01 | 0.7241 | -0.6462 | |||
| NXGN / NextGen Healthcare Inc | 0.11 | -10.95 | 1.16 | -32.26 | 0.7222 | -0.1243 | |||
| CASA / Casa Systems, Inc. | 0.22 | -10.95 | 1.13 | 13.93 | 0.7033 | 0.2128 | |||
| EPAC / Enerpac Tool Group Corp. | 0.07 | -10.95 | 1.12 | -34.27 | 0.6978 | -0.1456 | |||
| KNSL / Kinsale Capital Group, Inc. | 0.01 | -41.34 | 1.11 | -44.24 | 0.6941 | -0.2945 | |||
| VRAY / ViewRay Inc. | 0.53 | -5.35 | 1.10 | -36.91 | 0.6846 | -0.1774 | |||
| ECHO / Echo Global Logistics Inc | 0.06 | -10.94 | 1.06 | -19.42 | 0.6613 | 0.0090 | |||
| CASH / Pathward Financial, Inc. | 0.06 | -10.95 | 1.06 | -55.91 | 0.6569 | -0.5274 | |||
| WNS / WNS (Holdings) Limited | 0.02 | -10.94 | 1.05 | -39.06 | 0.6560 | -0.1990 | |||
| GDOT / Green Dot Corporation | 0.03 | -10.94 | 1.04 | -9.76 | 0.6455 | 0.0775 | |||
| AAWW / Atlas Air Worldwide Holdings Inc. | 0.03 | -10.94 | 1.03 | 30.89 | 0.6439 | 0.2531 | |||
| 0PP / Portola Pharmaceuticals Inc | 0.14 | -10.95 | 0.99 | -50.69 | 0.6190 | -0.3787 | |||
| NNBR / NN, Inc. | 0.27 | -10.95 | 0.95 | -64.41 | 0.5899 | -0.7267 | |||
| PRMW / Primo Water Corporation | 0.09 | -40.94 | 0.94 | -59.80 | 0.5837 | -0.5697 | |||
| EVOP / EVO Payments Inc - Class A | 0.05 | -10.95 | 0.94 | -36.00 | 0.5824 | -0.1408 | |||
| PL0 / Playa Hotels & Resorts N.V. | 0.37 | -10.95 | 0.92 | -68.68 | 0.5739 | -0.8814 | |||
| MTZ / MasTec, Inc. | 0.02 | -10.94 | 0.88 | -44.64 | 0.5469 | -0.2380 | |||
| SAIA / Saia, Inc. | 0.01 | -10.95 | 0.87 | -5.42 | 0.5432 | 0.0869 | |||
| ITCI / Intra-Cellular Therapies, Inc. | 0.05 | 0.86 | 0.5367 | 0.5367 | |||||
| SDC / Smiledirectclub Inc - Class A | 0.11 | -25.57 | 0.86 | -57.10 | 0.5344 | -0.4550 | |||
| VRRM / Verra Mobility Corporation | 0.09 | -10.95 | 0.85 | -49.94 | 0.5291 | -0.3102 | |||
| MDRX / Veradigm Inc. | 0.13 | -13.84 | 0.84 | -34.74 | 0.5219 | -0.1134 | |||
| FBK / FB Financial Corporation | 0.04 | -10.95 | 0.83 | -44.24 | 0.5160 | -0.2187 | |||
| 14161H108 / Cardtronics PLC | 0.04 | -10.94 | 0.83 | -54.69 | 0.5145 | -0.3875 | |||
| CUTR / Cutera, Inc. | 0.06 | 46.51 | 0.80 | -30.14 | 0.4998 | -0.0681 | |||
| ACEL / Accel Entertainment, Inc. | 0.08 | -10.95 | 0.77 | -29.25 | 0.4821 | -0.0594 | |||
| GOGO / Gogo Inc. | 0.46 | -10.95 | 0.75 | -72.43 | 0.4674 | -0.8784 | |||
| LITE / Lumentum Holdings Inc. | 0.01 | -50.68 | 0.75 | -47.33 | 0.4665 | -0.2373 | |||
| TSC / Tristate Capital Holdings Inc | 0.05 | -9.84 | 0.73 | -44.29 | 0.4531 | -0.1925 | |||
| SBLK / Star Bulk Carriers Corp. | 0.12 | -2.49 | 0.68 | -31.74 | 0.4259 | -0.0699 | |||
| BOOT / Boot Barn Holdings, Inc. | 0.04 | -10.94 | 0.68 | -60.86 | 0.4232 | -0.4353 | |||
| HSC / Enviri Corp | 0.06 | 0.65 | 0.4017 | 0.4017 | |||||
| US28470R1023 / Eldorado Resorts, Inc. | 0.03 | -10.95 | 0.62 | -68.06 | 0.3855 | -0.5735 | |||
| TPIC / TPI Composites, Inc. | 0.03 | -19.67 | 0.61 | -32.07 | 0.3798 | -0.0649 | |||
| US5537771033 / MTS Systems Corporation | 0.03 | -10.95 | 0.57 | -62.67 | 0.3555 | -0.4003 | |||
| REVG / REV Group, Inc. | 0.11 | -10.95 | 0.57 | -52.62 | 0.3545 | -0.2400 | |||
| MTDR / Matador Resources Company | 0.08 | -10.95 | 0.56 | -57.25 | 0.3469 | -0.2981 | |||
| EVRI / Everi Holdings Inc. | 0.10 | -10.95 | 0.50 | -64.72 | 0.3089 | -0.3870 | |||
| GES / Guess?, Inc. | 0.04 | -10.95 | 0.38 | -60.91 | 0.2367 | -0.2442 | |||
| PDCE / PDC Energy Inc | 0.03 | -10.95 | 0.37 | -46.48 | 0.2328 | -0.1124 | |||
| CIR / Circor International Inc | 0.02 | -10.95 | 0.35 | -68.05 | 0.2209 | -0.3274 | |||
| PSIX / Power Solutions International, Inc. | 0.09 | -9.13 | 0.33 | -61.61 | 0.2083 | -0.2222 | |||
| DSKE / Daseke, Inc. | 0.19 | -10.95 | 0.33 | -50.00 | 0.2045 | -0.1203 | |||
| CPE / Callon Petroleum Company | 0.21 | -10.95 | 0.20 | -72.16 | 0.1255 | -0.2319 | |||
| WAAS / AquaVenture Holdings Limited | 0.00 | -100.00 | 0.00 | -100.00 | -1.0352 | ||||
| TDOC / Teladoc Health, Inc. | 0.00 | -100.00 | 0.00 | -100.00 | -0.6928 |