Mga Batayang Estadistika
| Nilai Portofolio | $ 2,509,894,800 |
| Posisi Saat Ini | 118 |
Kepemilikan Terbaru, Kinerja, AUM (dari 13F, 13D)
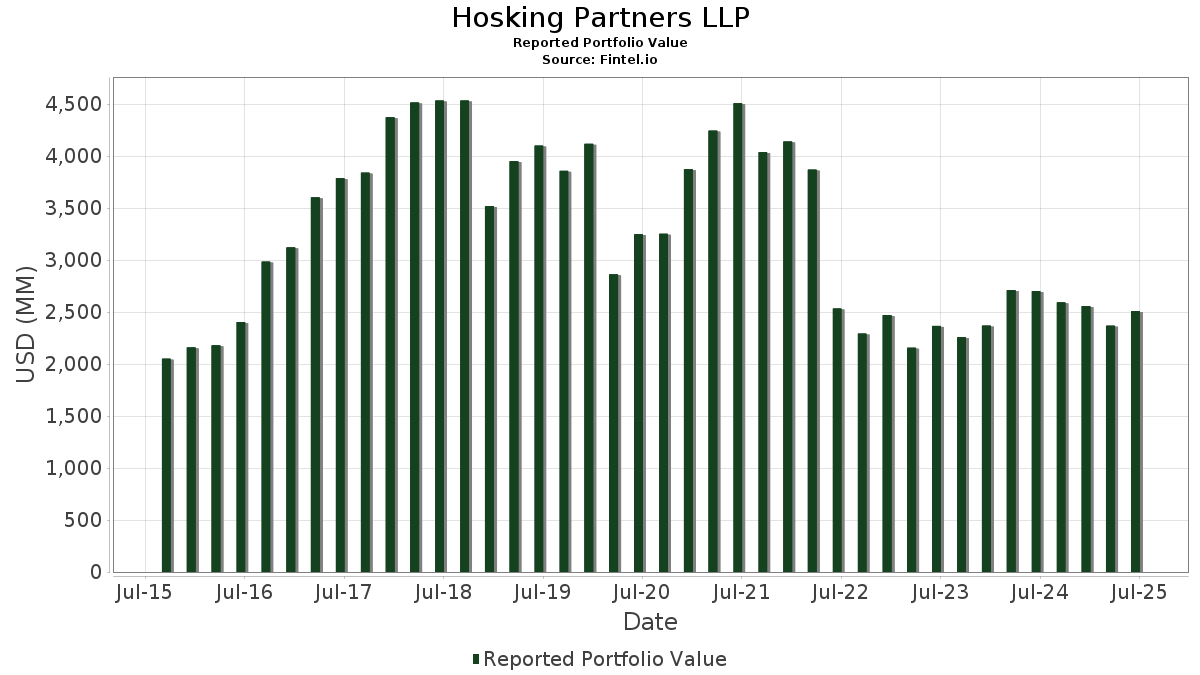
Hosking Partners LLP telah mengungkapkan total kepemilikan 118 dalam pengajuan SEC terbaru mereka. Nilai portofolio terbaru dihitung sebesar $ 2,509,894,800 USD. Aset yang Dikelola (AUM) sebenarnya adalah nilai ini ditambah kas (yang tidak diungkapkan). Aset-aset utama Hosking Partners LLP adalah Citigroup Inc. (US:C) , American International Group, Inc. (US:AIG) , Amazon.com, Inc. (US:AMZN) , Alphabet Inc. (US:GOOG) , and Micron Technology, Inc. (US:MU) . Posisi baru Hosking Partners LLP meliputi: Vista Energy, S.A.B. de C.V. - Depositary Receipt (Common Stock) (US:VIST) , Shinhan Financial Group Co., Ltd. - Depositary Receipt (Common Stock) (US:SHG) , . Industri unggulan Hosking Partners LLP adalah "Printing, Publishing, And Allied Industries" (sic 27) , "Motion Pictures and Film" (sic 78) , and "Non-depository Credit Institutions" (sic 61) .
Peningkatan Tertinggi Kuartal Ini
Kami menggunakan perubahan dalam alokasi portofolio karena ini adalah metrik yang paling bermakna. Perubahan dapat disebabkan oleh perdagangan atau perubahan harga saham.
| Keamanan | Saham (MM) |
Nilai (Juta Dolar AS) |
Portfolio % | ΔPorsyento ng Portfolio |
|---|---|---|---|---|
| 0.70 | 86.09 | 3.4299 | 0.8156 | |
| 1.17 | 64.80 | 2.5817 | 0.6086 | |
| 1.22 | 103.95 | 4.1418 | 0.4844 | |
| 0.12 | 32.21 | 1.2833 | 0.4512 | |
| 0.01 | 77.05 | 3.0698 | 0.4504 | |
| 0.52 | 25.76 | 1.0264 | 0.3740 | |
| 0.58 | 26.79 | 1.0675 | 0.3639 | |
| 0.78 | 51.74 | 2.0616 | 0.3021 | |
| 0.41 | 22.73 | 0.9056 | 0.2799 | |
| 0.25 | 78.63 | 3.1328 | 0.2781 |
Penurunan Tertinggi Kuartal Ini
Kami menggunakan perubahan dalam alokasi portofolio karena ini adalah metrik yang paling bermakna. Perubahan dapat disebabkan oleh perdagangan atau perubahan harga saham.
| Keamanan | Saham (MM) |
Nilai (Juta Dolar AS) |
Portfolio % | ΔPorsyento ng Portfolio |
|---|---|---|---|---|
| 0.02 | 3.99 | 0.1589 | -1.5995 | |
| 1.22 | 57.56 | 2.2932 | -0.6000 | |
| 0.15 | 70.96 | 2.8272 | -0.4394 | |
| 1.14 | 97.33 | 3.8778 | -0.3635 | |
| 0.07 | 71.84 | 2.8624 | -0.3449 | |
| 0.49 | 26.89 | 1.0712 | -0.3396 | |
| 0.28 | 25.55 | 1.0181 | -0.3337 | |
| 0.02 | 1.60 | 0.0638 | -0.2941 | |
| 0.34 | 2.47 | 0.0985 | -0.2831 | |
| 0.29 | 25.80 | 1.0281 | -0.2683 |
Pengajuan 13D/G
Ini adalah daftar pengajuan 13D dan 13G yang dibuat dalam setahun terakhir (jika ada). Klik ikon tautan untuk melihat riwayat transaksi lengkap. Baris berwarna hijau menunjukkan posisi baru. Baris berwarna merah menunjukkan posisi yang sudah ditutup.
| Tanggal File | Formulir | Keamanan | Sebelumnya Saham |
Saat ini Saham |
ΔPersentase Saham | % Kepemilikan |
% ΔKepemilikan | |
|---|---|---|---|---|---|---|---|---|
| 2025-04-15 | GSM / Ferroglobe PLC | 10,633,729 | 5.70 |
Pengajuan 13F dan Dana
Formulir ini diajukan pada 2025-08-07 untuk periode pelaporan 2025-06-30. Klik ikon tautan untuk melihat riwayat transaksi selengkapnya.
Tingkatkan ke versi premium untuk membuka data premium dan ekspor ke Excel. ![]() .
.
| Keamanan | Ketik | Harga Saham Rata-rata | Saham (MM) |
ΔSaham (%) |
ΔSaham (%) |
Nilai ($MM) |
Portpolyo (%) |
ΔPortofolio (%) |
|
|---|---|---|---|---|---|---|---|---|---|
| C / Citigroup Inc. | 1.22 | 0.08 | 103.95 | 20.00 | 4.1418 | 0.4844 | |||
| AIG / American International Group, Inc. | 1.14 | -1.59 | 97.33 | -3.12 | 3.8778 | -0.3635 | |||
| AMZN / Amazon.com, Inc. | 0.42 | -1.77 | 93.11 | 13.26 | 3.7099 | 0.2392 | |||
| GOOG / Alphabet Inc. | 0.52 | -1.12 | 92.69 | 12.27 | 3.6929 | 0.2074 | |||
| MU / Micron Technology, Inc. | 0.70 | -1.99 | 86.09 | 39.02 | 3.4299 | 0.8156 | |||
| AXP / American Express Company | 0.25 | -1.92 | 78.63 | 16.29 | 3.1328 | 0.2781 | |||
| CBRE / CBRE Group, Inc. | 0.55 | -1.76 | 77.64 | 5.26 | 3.0932 | -0.0206 | |||
| BKNG / Booking Holdings Inc. | 0.01 | -1.18 | 77.05 | 24.18 | 3.0698 | 0.4504 | |||
| COST / Costco Wholesale Corporation | 0.07 | -9.65 | 71.84 | -5.43 | 2.8624 | -0.3449 | |||
| BRK.B / Berkshire Hathaway Inc. | 0.15 | 0.55 | 70.96 | -8.29 | 2.8272 | -0.4394 | |||
| IBKR / Interactive Brokers Group, Inc. | 1.17 | 314.33 | 64.80 | 38.65 | 2.5817 | 0.6086 | |||
| FCX / Freeport-McMoRan Inc. | 1.40 | -5.75 | 60.89 | 7.92 | 2.4260 | 0.0439 | |||
| COF / Capital One Financial Corporation | 0.27 | -4.60 | 57.83 | 13.21 | 2.3041 | 0.1475 | |||
| BAC / Bank of America Corporation | 1.22 | -25.93 | 57.56 | -16.01 | 2.2932 | -0.6000 | |||
| WFC / Wells Fargo & Company | 0.67 | -14.03 | 53.33 | -4.06 | 2.1248 | -0.2219 | |||
| SYF / Synchrony Financial | 0.78 | -1.52 | 51.74 | 24.16 | 2.0616 | 0.3021 | |||
| GSM / Ferroglobe PLC | 10.78 | 1.36 | 39.56 | 0.27 | 1.5761 | -0.0895 | |||
| DHT / DHT Holdings, Inc. | 3.62 | -1.03 | 39.15 | 1.89 | 1.5599 | -0.0624 | |||
| JPM / JPMorgan Chase & Co. | 0.12 | -16.14 | 34.61 | -0.89 | 1.3788 | -0.0952 | |||
| CX / CEMEX, S.A.B. de C.V. - Depositary Receipt (Common Stock) | 4.97 | -2.18 | 34.44 | 20.83 | 1.3724 | 0.1689 | |||
| AVGO / Broadcom Inc. | 0.12 | -0.74 | 32.21 | 63.42 | 1.2833 | 0.4512 | |||
| ELV / Elevance Health, Inc. | 0.08 | -0.61 | 29.98 | -11.12 | 1.1944 | -0.2296 | |||
| RYAA.Y / Ryanair Holdings plc - Depositary Receipt (Common Stock) | 0.51 | -29.34 | 29.15 | -3.83 | 1.1614 | -0.1183 | |||
| HCC / Warrior Met Coal, Inc. | 0.64 | 22.14 | 29.12 | 17.31 | 1.1603 | 0.1122 | |||
| MPC / Marathon Petroleum Corporation | 0.17 | -17.01 | 28.20 | -5.37 | 1.1236 | -0.1346 | |||
| NE / Noble Corporation plc | 1.03 | 5.15 | 27.38 | 17.80 | 1.0908 | 0.1096 | |||
| MS / Morgan Stanley | 0.19 | -0.67 | 27.04 | 19.92 | 1.0772 | 0.1254 | |||
| JEF / Jefferies Financial Group Inc. | 0.49 | -21.19 | 26.89 | -19.54 | 1.0712 | -0.3396 | |||
| TDW / Tidewater Inc. | 0.58 | 47.32 | 26.79 | 60.77 | 1.0675 | 0.3639 | |||
| CPNG / Coupang, Inc. | 0.87 | -4.80 | 26.15 | 30.06 | 1.0420 | 0.1930 | |||
| LYB / LyondellBasell Industries N.V. | 0.45 | 11.31 | 25.86 | -8.52 | 1.0303 | -0.1631 | |||
| COP / ConocoPhillips | 0.29 | -1.66 | 25.80 | -15.97 | 1.0281 | -0.2683 | |||
| DAL / Delta Air Lines, Inc. | 0.52 | 47.78 | 25.76 | 66.69 | 1.0264 | 0.3740 | |||
| MGM / MGM Resorts International | 0.75 | -1.92 | 25.69 | 13.81 | 1.0234 | 0.0705 | |||
| SCHW / The Charles Schwab Corporation | 0.28 | -31.53 | 25.55 | -20.20 | 1.0181 | -0.3337 | |||
| INSW / International Seaways, Inc. | 0.69 | -8.01 | 25.13 | 1.08 | 1.0011 | -0.0484 | |||
| GLW / Corning Incorporated | 0.45 | -1.58 | 23.72 | 13.06 | 0.9450 | 0.0593 | |||
| OXY / Occidental Petroleum Corporation | 0.55 | 5.88 | 23.30 | -9.89 | 0.9285 | -0.1633 | |||
| TRUP / Trupanion, Inc. | 0.41 | 3.27 | 22.73 | 53.37 | 0.9056 | 0.2799 | |||
| STLD / Steel Dynamics, Inc. | 0.16 | -0.71 | 20.99 | 1.61 | 0.8363 | -0.0358 | |||
| LPX / Louisiana-Pacific Corporation | 0.23 | -14.07 | 19.85 | -19.67 | 0.7908 | -0.2523 | |||
| TIGO / Millicom International Cellular S.A. | 0.52 | -2.39 | 19.43 | 20.83 | 0.7741 | 0.0952 | |||
| BAP / Credicorp Ltd. | 0.08 | -2.38 | 18.32 | 17.22 | 0.7297 | 0.0700 | |||
| KR / The Kroger Co. | 0.25 | -1.91 | 17.81 | 3.93 | 0.7095 | -0.0138 | |||
| PM / Philip Morris International Inc. | 0.10 | -3.26 | 17.79 | 11.01 | 0.7086 | 0.0322 | |||
| GLNG / Golar LNG Limited | 0.42 | -2.36 | 17.18 | 5.87 | 0.6843 | -0.0006 | |||
| SDRL / Seadrill Limited | 0.62 | 9.74 | 16.32 | 15.23 | 0.6503 | 0.0523 | |||
| AA / Alcoa Corporation | 0.55 | -1.92 | 16.13 | -5.10 | 0.6428 | -0.0749 | |||
| UNP / Union Pacific Corporation | 0.07 | -1.91 | 16.11 | -4.47 | 0.6420 | -0.0701 | |||
| STX / Seagate Technology Holdings plc | 0.11 | -1.91 | 16.06 | 66.65 | 0.6398 | 0.2330 | |||
| PNC / The PNC Financial Services Group, Inc. | 0.09 | 1.36 | 15.95 | 7.49 | 0.6357 | 0.0091 | |||
| MCHP / Microchip Technology Incorporated | 0.23 | -0.49 | 15.95 | 44.66 | 0.6357 | 0.1700 | |||
| LRCX / Lam Research Corporation | 0.16 | -0.82 | 15.60 | 32.80 | 0.6217 | 0.1256 | |||
| SLG / SL Green Realty Corp. | 0.25 | -1.40 | 15.30 | 5.79 | 0.6097 | -0.0010 | |||
| PYPL / PayPal Holdings, Inc. | 0.20 | -1.91 | 15.16 | 11.72 | 0.6041 | 0.0311 | |||
| AAL / American Airlines Group Inc. | 1.29 | -1.92 | 14.46 | 4.31 | 0.5762 | -0.0091 | |||
| CFG / Citizens Financial Group, Inc. | 0.29 | -1.92 | 13.13 | 7.13 | 0.5231 | 0.0057 | |||
| BIO / Bio-Rad Laboratories, Inc. | 0.05 | -0.72 | 13.05 | -1.64 | 0.5201 | -0.0402 | |||
| DIS / The Walt Disney Company | 0.11 | -1.91 | 13.03 | 23.24 | 0.5193 | 0.0728 | |||
| LSAK / Lesaka Technologies, Inc. | 2.73 | -1.83 | 12.27 | -7.59 | 0.4890 | -0.0717 | |||
| TPL / Texas Pacific Land Corporation | 0.01 | 1.27 | 11.71 | -19.26 | 0.4667 | -0.1458 | |||
| BLD / TopBuild Corp. | 0.04 | -0.73 | 11.60 | 5.39 | 0.4622 | -0.0025 | |||
| V / Visa Inc. | 0.03 | -1.90 | 11.23 | -0.62 | 0.4473 | -0.0296 | |||
| QCOM / QUALCOMM Incorporated | 0.07 | -1.91 | 11.06 | 1.69 | 0.4405 | -0.0185 | |||
| VICI / VICI Properties Inc. | 0.32 | 107.29 | 10.46 | 107.17 | 0.4166 | 0.2035 | |||
| VAL / Valaris Limited | 0.25 | -0.11 | 10.44 | 7.14 | 0.4159 | 0.0046 | |||
| ARLO / Arlo Technologies, Inc. | 0.61 | -0.88 | 10.42 | 70.34 | 0.4152 | 0.1569 | |||
| HEPS / D-Market Elektronik Hizmetler ve Ticaret A.S. - Depositary Receipt (Common Stock) | 3.79 | -2.37 | 10.23 | -7.51 | 0.4075 | -0.0593 | |||
| WTW / Willis Towers Watson Public Limited Company | 0.03 | -0.71 | 9.89 | -9.95 | 0.3942 | -0.0697 | |||
| AMAT / Applied Materials, Inc. | 0.05 | -1.91 | 9.62 | 23.74 | 0.3832 | 0.0551 | |||
| FWONA / Formula One Group | 0.09 | -0.85 | 9.57 | 15.12 | 0.3813 | 0.0303 | |||
| MAS / Masco Corporation | 0.14 | -0.53 | 9.28 | -7.93 | 0.3698 | -0.0558 | |||
| BTU / Peabody Energy Corporation | 0.66 | -21.53 | 8.89 | -22.29 | 0.3542 | -0.1287 | |||
| VIPS / Vipshop Holdings Limited - Depositary Receipt (Common Stock) | 0.58 | -2.11 | 8.74 | -6.05 | 0.3483 | -0.0445 | |||
| HSHP / Himalaya Shipping Ltd. | 1.50 | 236.96 | 8.68 | 254.85 | 0.3457 | 0.2424 | |||
| L / Loews Corporation | 0.09 | -1.91 | 8.55 | -2.17 | 0.3407 | -0.0283 | |||
| KOF / Coca-Cola FEMSA, S.A.B. de C.V. - Depositary Receipt (Common Stock) | 0.08 | -2.37 | 8.19 | 3.45 | 0.3264 | -0.0079 | |||
| AMR / Alpha Metallurgical Resources, Inc. | 0.07 | 20.29 | 8.12 | 8.02 | 0.3235 | 0.0062 | |||
| FCFS / FirstCash Holdings, Inc. | 0.06 | -1.90 | 7.74 | 10.17 | 0.3082 | 0.0118 | |||
| STNG / Scorpio Tankers Inc. | 0.19 | -1.94 | 7.61 | 2.11 | 0.3032 | -0.0115 | |||
| CRH / CRH plc | 0.08 | -0.76 | 7.60 | 3.57 | 0.3028 | -0.0070 | |||
| CPA / Copa Holdings, S.A. | 0.07 | -2.41 | 7.49 | 16.08 | 0.2985 | 0.0260 | |||
| LOMA / Loma Negra Compañía Industrial Argentina Sociedad Anónima - Depositary Receipt (Common Stock) | 0.67 | -2.40 | 7.33 | -2.58 | 0.2921 | -0.0256 | |||
| CRESY / Cresud Sociedad Anónima, Comercial, Inmobiliaria, Financiera y Agropecuaria - Depositary Receipt (Common Stock) | 0.64 | -2.39 | 6.90 | -4.96 | 0.2749 | -0.0316 | |||
| MBI / MBIA Inc. | 1.56 | -1.22 | 6.78 | -13.92 | 0.2701 | -0.0624 | |||
| CTVA / Corteva, Inc. | 0.09 | -1.91 | 6.71 | 16.17 | 0.2674 | 0.0235 | |||
| KWR / Quaker Chemical Corporation | 0.06 | 35.90 | 6.53 | 23.09 | 0.2600 | 0.0361 | |||
| THO / THOR Industries, Inc. | 0.06 | -0.72 | 5.76 | 16.30 | 0.2297 | 0.0204 | |||
| BN / Brookfield Corporation | 0.09 | -8.47 | 5.67 | 8.01 | 0.2257 | 0.0043 | |||
| VIST / Vista Energy, S.A.B. de C.V. - Depositary Receipt (Common Stock) | 0.12 | 5.64 | 0.2245 | 0.2245 | |||||
| CVX / Chevron Corporation | 0.04 | -0.73 | 5.52 | -15.04 | 0.2200 | -0.0544 | |||
| XOM / Exxon Mobil Corporation | 0.05 | -0.71 | 5.38 | -10.00 | 0.2144 | -0.0380 | |||
| RLX / RLX Technology Inc. - Depositary Receipt (Common Stock) | 2.03 | -3.24 | 4.48 | 13.74 | 0.1784 | 0.0122 | |||
| NU / Nu Holdings Ltd. | 0.30 | -5.37 | 4.09 | 26.76 | 0.1629 | 0.0268 | |||
| TSM / Taiwan Semiconductor Manufacturing Company Limited - Depositary Receipt (Common Stock) | 0.02 | -92.98 | 3.99 | -90.43 | 0.1589 | -1.5995 | |||
| CZR / Caesars Entertainment, Inc. | 0.14 | -0.75 | 3.96 | 12.71 | 0.1580 | 0.0095 | |||
| PBT / Permian Basin Royalty Trust | 0.31 | 1.17 | 3.84 | 27.20 | 0.1532 | 0.0256 | |||
| CNC / Centene Corporation | 0.07 | -0.75 | 3.64 | -11.26 | 0.1451 | -0.0282 | |||
| EPAM / EPAM Systems, Inc. | 0.02 | -1.93 | 3.61 | 2.70 | 0.1440 | -0.0046 | |||
| DSX / Diana Shipping Inc. | 1.97 | -1.95 | 2.88 | -8.23 | 0.1146 | -0.0177 | |||
| RIG / Transocean Ltd. | 1.09 | -49.31 | 2.82 | -58.59 | 0.1125 | -0.1753 | |||
| CWK / Cushman & Wakefield plc | 0.25 | -0.71 | 2.73 | 7.53 | 0.1087 | 0.0016 | |||
| GOGL / Golden Ocean Group Limited | 0.34 | -70.20 | 2.47 | -72.66 | 0.0985 | -0.2831 | |||
| INDA / iShares Trust - iShares MSCI India ETF | 0.04 | -2.89 | 2.42 | 5.04 | 0.0964 | -0.0009 | |||
| VECO / Veeco Instruments Inc. | 0.08 | -0.78 | 1.61 | 0.37 | 0.0641 | -0.0035 | |||
| CNR / Core Natural Resources, Inc. | 0.02 | -79.12 | 1.60 | -81.12 | 0.0638 | -0.2941 | |||
| LBRDK / Liberty Broadband Corporation | 0.01 | -1.72 | 0.97 | 13.73 | 0.0386 | 0.0026 | |||
| SIRI / Sirius XM Holdings Inc. | 0.04 | -1.74 | 0.95 | 0.10 | 0.0380 | -0.0022 | |||
| MNTK / Montauk Renewables, Inc. | 0.40 | -48.02 | 0.88 | -44.81 | 0.0350 | -0.0322 | |||
| VTS / Vitesse Energy, Inc. | 0.03 | -1.73 | 0.77 | -11.71 | 0.0306 | -0.0061 | |||
| LLYVK / Liberty Live Group | 0.01 | -1.83 | 0.65 | 16.91 | 0.0259 | 0.0024 | |||
| LILAB / Liberty Latin America Ltd. | 0.09 | -1.58 | 0.59 | -1.34 | 0.0235 | -0.0018 | |||
| SHG / Shinhan Financial Group Co., Ltd. - Depositary Receipt (Common Stock) | 0.01 | 0.48 | 0.0192 | 0.0192 | |||||
| LLYVK / Liberty Live Group | 0.01 | -1.74 | 0.44 | 16.23 | 0.0177 | 0.0016 | |||
| FWONA / Formula One Group | 0.00 | -1.71 | 0.44 | 14.40 | 0.0174 | 0.0013 | |||
| LILA / Liberty Latin America Ltd. | 0.07 | -1.56 | 0.43 | -5.08 | 0.0172 | -0.0020 | |||
| LBRDA / Liberty Broadband Corporation | 0.00 | 0.21 | 0.0084 | 0.0084 | |||||
| DSX.WS / Diana Shipping Inc. - Equity Warrant | 0.43 | 0.00 | 0.03 | -26.09 | 0.0014 | -0.0006 | |||
| WY / Weyerhaeuser Company | 0.00 | -100.00 | 0.00 | 0.0000 |