Mga Batayang Estadistika
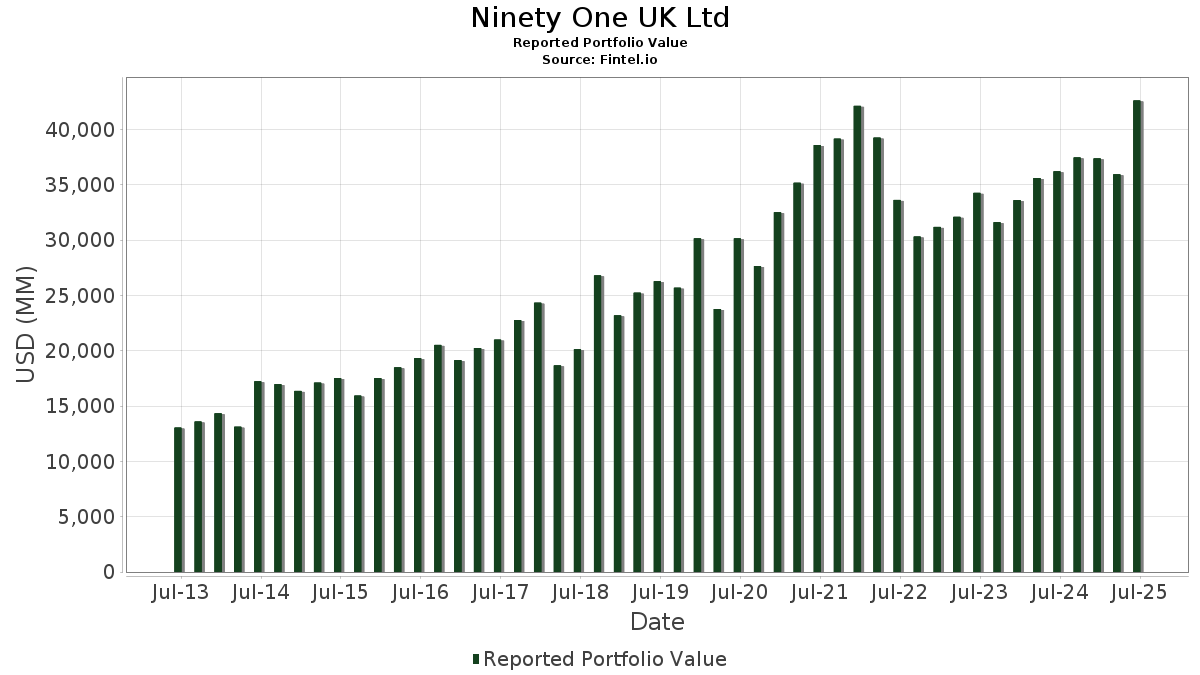
| Nilai Portofolio | $ 42,613,959,043 |
| Posisi Saat Ini | 202 |
Kepemilikan Terbaru, Kinerja, AUM (dari 13F, 13D)
Ninety One UK Ltd telah mengungkapkan total kepemilikan 202 dalam pengajuan SEC terbaru mereka. Nilai portofolio terbaru dihitung sebesar $ 42,613,959,043 USD. Aset yang Dikelola (AUM) sebenarnya adalah nilai ini ditambah kas (yang tidak diungkapkan). Aset-aset utama Ninety One UK Ltd adalah Microsoft Corporation (US:MSFT) , Visa Inc. (US:V) , NVIDIA Corporation (US:NVDA) , Autodesk, Inc. (US:ADSK) , and Alphabet Inc. (US:GOOG) . Posisi baru Ninety One UK Ltd meliputi: Barrick Mining Corporation (US:B) , Twilio Inc. (US:TWLO) , Hilton Worldwide Holdings Inc. (US:HLT) , StoneCo Ltd. (US:STNE) , and Brookfield Renewable Corporation (US:BEPC) . Industri unggulan Ninety One UK Ltd adalah "Apparel And Other Finished Products Made From Fabrics And Similar Materials" (sic 23) , "Restaurants, Dining, Eating And Drinking Places" (sic 58) , and "Lumber And Wood Products, Except Furniture" (sic 24) .
Peningkatan Tertinggi Kuartal Ini
Kami menggunakan perubahan dalam alokasi portofolio karena ini adalah metrik yang paling bermakna. Perubahan dapat disebabkan oleh perdagangan atau perubahan harga saham.
| Keamanan | Saham (MM) |
Nilai (Juta Dolar AS) |
Portfolio % | ΔPorsyento ng Portfolio |
|---|---|---|---|---|
| 7.50 | 3,729.77 | 8.7525 | 1.4553 | |
| 11.03 | 1,742.99 | 4.0902 | 1.4528 | |
| 4.10 | 1,130.77 | 2.6535 | 1.1202 | |
| 0.58 | 408.78 | 0.9593 | 0.9593 | |
| 15.70 | 326.86 | 0.7670 | 0.7670 | |
| 1.71 | 212.06 | 0.4976 | 0.4976 | |
| 0.07 | 276.19 | 0.6481 | 0.4726 | |
| 1.23 | 180.00 | 0.4224 | 0.3529 | |
| 1.46 | 1,148.99 | 2.6963 | 0.2916 | |
| 4.85 | 882.46 | 2.0708 | 0.2687 |
Penurunan Tertinggi Kuartal Ini
Kami menggunakan perubahan dalam alokasi portofolio karena ini adalah metrik yang paling bermakna. Perubahan dapat disebabkan oleh perdagangan atau perubahan harga saham.
| Keamanan | Saham (MM) |
Nilai (Juta Dolar AS) |
Portfolio % | ΔPorsyento ng Portfolio |
|---|---|---|---|---|
| 6.24 | 2,215.53 | 5.1991 | -0.8950 | |
| 2.75 | 793.34 | 1.8617 | -0.8754 | |
| 7.49 | 1,363.48 | 3.1996 | -0.7675 | |
| 7.02 | 1,071.72 | 2.5149 | -0.6793 | |
| 4.74 | 1,039.08 | 2.4384 | -0.5926 | |
| 0.73 | 230.57 | 0.5411 | -0.4572 | |
| 2.99 | 435.43 | 1.0218 | -0.3989 | |
| 0.00 | 0.01 | 0.0000 | -0.3402 | |
| 2.53 | 552.67 | 1.2969 | -0.3126 | |
| 2.59 | 573.65 | 1.3462 | -0.2569 |
Pengajuan 13D/G
Ini adalah daftar pengajuan 13D dan 13G yang dibuat dalam setahun terakhir (jika ada). Klik ikon tautan untuk melihat riwayat transaksi lengkap. Baris berwarna hijau menunjukkan posisi baru. Baris berwarna merah menunjukkan posisi yang sudah ditutup.
| Tanggal File | Formulir | Keamanan | Sebelumnya Saham |
Saat ini Saham |
ΔPersentase Saham | % Kepemilikan |
% ΔKepemilikan | |
|---|---|---|---|---|---|---|---|---|
| 2025-08-06 | TKO / TKO Group Holdings, Inc. | 4,411,978 | 5,217,918 | 18.27 | 6.38 | 20.60 |
Pengajuan 13F dan Dana
Formulir ini diajukan pada 2025-07-18 untuk periode pelaporan 2025-06-30. Klik ikon tautan untuk melihat riwayat transaksi selengkapnya.
Tingkatkan ke versi premium untuk membuka data premium dan ekspor ke Excel. ![]() .
.
| Keamanan | Ketik | Harga Saham Rata-rata | Saham (MM) |
ΔSaham (%) |
ΔSaham (%) |
Nilai ($MM) |
Portpolyo (%) |
ΔPortofolio (%) |
|
|---|---|---|---|---|---|---|---|---|---|
| MSFT / Microsoft Corporation | 7.50 | 7.32 | 3,729.77 | 42.20 | 8.7525 | 1.4553 | |||
| V / Visa Inc. | 6.24 | -0.16 | 2,215.53 | 1.15 | 5.1991 | -0.8950 | |||
| NVDA / NVIDIA Corporation | 11.03 | 26.13 | 1,742.99 | 83.86 | 4.0902 | 1.4528 | |||
| ADSK / Autodesk, Inc. | 5.34 | 3.72 | 1,652.52 | 22.65 | 3.8779 | 0.1292 | |||
| GOOG / Alphabet Inc. | 9.04 | 5.52 | 1,593.50 | 20.26 | 3.7394 | 0.0528 | |||
| PM / Philip Morris International Inc. | 7.49 | -16.66 | 1,363.48 | -4.38 | 3.1996 | -0.7675 | |||
| BKNG / Booking Holdings Inc. | 0.22 | 1.12 | 1,262.15 | 27.07 | 2.9618 | 0.1985 | |||
| INTU / Intuit Inc. | 1.46 | 3.63 | 1,148.99 | 32.94 | 2.6963 | 0.2916 | |||
| AVGO / Broadcom Inc. | 4.10 | 24.62 | 1,130.77 | 105.17 | 2.6535 | 1.1202 | |||
| JNJ / Johnson & Johnson | 7.02 | 1.35 | 1,071.72 | -6.65 | 2.5149 | -0.6793 | |||
| AMZN / Amazon.com, Inc. | 4.74 | -17.28 | 1,039.08 | -4.62 | 2.4384 | -0.5926 | |||
| TKO / TKO Group Holdings, Inc. | 4.85 | 14.42 | 882.46 | 36.24 | 2.0708 | 0.2687 | |||
| NTES / NetEase, Inc. - Depositary Receipt (Common Stock) | 6.27 | 2.20 | 843.52 | 33.64 | 1.9794 | 0.2234 | |||
| VRSN / VeriSign, Inc. | 2.75 | -29.11 | 793.34 | -19.36 | 1.8617 | -0.8754 | |||
| ADP / Automatic Data Processing, Inc. | 2.40 | 5.77 | 741.00 | 6.76 | 1.7389 | -0.1921 | |||
| EA / Electronic Arts Inc. | 4.36 | 4.65 | 695.65 | 15.64 | 1.6324 | -0.0412 | |||
| MA / Mastercard Incorporated | 1.18 | 8.55 | 661.66 | 11.29 | 1.5527 | -0.1015 | |||
| JPM / JPMorgan Chase & Co. | 2.28 | 12.82 | 660.49 | 33.34 | 1.5499 | 0.1718 | |||
| CHKP / Check Point Software Technologies Ltd. | 2.59 | 2.56 | 573.65 | -0.44 | 1.3462 | -0.2569 | |||
| MNST / Monster Beverage Corporation | 8.94 | 4.91 | 560.28 | 12.30 | 1.3148 | -0.0733 | |||
| BSX / Boston Scientific Corporation | 5.15 | 33.47 | 552.76 | 42.11 | 1.2971 | 0.2149 | |||
| MMC / Marsh & McLennan Companies, Inc. | 2.53 | 6.63 | 552.67 | -4.47 | 1.2969 | -0.3126 | |||
| EW / Edwards Lifesciences Corporation | 6.94 | -0.93 | 542.74 | 6.91 | 1.2736 | -0.1388 | |||
| FDS / FactSet Research Systems Inc. | 1.19 | 0.06 | 533.44 | -1.56 | 1.2518 | -0.2559 | |||
| AAPL / Apple Inc. | 2.50 | 8.26 | 513.05 | -0.01 | 1.2040 | -0.2236 | |||
| SPGI / S&P Global Inc. | 0.93 | 0.82 | 489.62 | 4.63 | 1.1490 | -0.1530 | |||
| TSM / Taiwan Semiconductor Manufacturing Company Limited - Depositary Receipt (Common Stock) | 2.01 | 1.25 | 454.29 | 38.14 | 1.0660 | 0.1511 | |||
| LNG / Cheniere Energy, Inc. | 1.81 | 20.04 | 440.49 | 26.32 | 1.0337 | 0.0635 | |||
| TTWO / Take-Two Interactive Software, Inc. | 1.80 | 22.84 | 437.51 | 43.94 | 1.0267 | 0.1810 | |||
| ICLR / ICON Public Limited Company | 2.99 | 2.59 | 435.43 | -14.73 | 1.0218 | -0.3989 | |||
| MCO / Moody's Corporation | 0.84 | 1.11 | 420.07 | 8.90 | 0.9857 | -0.0874 | |||
| GS / The Goldman Sachs Group, Inc. | 0.58 | 408.78 | 0.9593 | 0.9593 | |||||
| SNX / TD SYNNEX Corporation | 2.95 | 14.99 | 400.28 | 50.10 | 0.9393 | 0.1974 | |||
| ALGN / Align Technology, Inc. | 1.92 | -1.10 | 362.81 | 17.87 | 0.8514 | -0.0050 | |||
| J / Jacobs Solutions Inc. | 2.55 | 17.10 | 335.09 | 27.33 | 0.7863 | 0.0542 | |||
| LLY / Eli Lilly and Company | 0.43 | 38.70 | 331.66 | 30.92 | 0.7783 | 0.0735 | |||
| Z / Zillow Group, Inc. | 4.73 | 17.43 | 331.47 | 19.98 | 0.7779 | 0.0092 | |||
| AER / AerCap Holdings N.V. | 2.79 | 44.77 | 327.01 | 65.79 | 0.7674 | 0.2186 | |||
| B / Barrick Mining Corporation | 15.70 | 326.86 | 0.7670 | 0.7670 | |||||
| TMO / Thermo Fisher Scientific Inc. | 0.81 | 41.60 | 326.72 | 15.38 | 0.7667 | -0.0211 | |||
| PLNT / Planet Fitness, Inc. | 2.88 | 35.73 | 314.49 | 53.21 | 0.7380 | 0.1669 | |||
| CRH / CRH plc | 3.14 | 13.11 | 288.57 | 18.03 | 0.6772 | -0.0030 | |||
| ICE / Intercontinental Exchange, Inc. | 1.51 | 23.08 | 277.69 | 30.90 | 0.6516 | 0.0615 | |||
| AZO / AutoZone, Inc. | 0.07 | 349.52 | 276.19 | 337.67 | 0.6481 | 0.4726 | |||
| OKTA / Okta, Inc. | 2.74 | 52.06 | 274.37 | 44.47 | 0.6439 | 0.1155 | |||
| SE / Sea Limited - Depositary Receipt (Common Stock) | 1.70 | 0.94 | 271.84 | 23.72 | 0.6379 | 0.0266 | |||
| XOM / Exxon Mobil Corporation | 2.51 | 18.31 | 271.05 | 7.24 | 0.6361 | -0.0671 | |||
| IBN / ICICI Bank Limited - Depositary Receipt (Common Stock) | 7.83 | 17.56 | 263.33 | 25.47 | 0.6180 | 0.0340 | |||
| MSI / Motorola Solutions, Inc. | 0.59 | 1.13 | 249.02 | -2.88 | 0.5844 | -0.1290 | |||
| TT / Trane Technologies plc | 0.56 | -29.48 | 245.49 | -8.44 | 0.5761 | -0.1699 | |||
| PINS / Pinterest, Inc. | 6.69 | 10.98 | 239.87 | 28.38 | 0.5629 | 0.0431 | |||
| FCX / Freeport-McMoRan Inc. | 5.45 | 21.63 | 236.11 | 39.27 | 0.5541 | 0.0824 | |||
| GM / General Motors Company | 4.79 | 13.34 | 235.89 | 18.60 | 0.5535 | 0.0002 | |||
| TSLA / Tesla, Inc. | 0.73 | -47.57 | 230.57 | -35.74 | 0.5411 | -0.4572 | |||
| CNI / Canadian National Railway Company | 2.05 | 7.86 | 213.26 | 15.27 | 0.5004 | -0.0143 | |||
| TWLO / Twilio Inc. | 1.71 | 212.06 | 0.4976 | 0.4976 | |||||
| TRU / TransUnion | 2.32 | -11.92 | 203.90 | -6.61 | 0.4785 | -0.1289 | |||
| RBLX / Roblox Corporation | 1.78 | -24.28 | 187.73 | 36.65 | 0.4405 | 0.0583 | |||
| TW / Tradeweb Markets Inc. | 1.23 | 630.66 | 180.00 | 620.54 | 0.4224 | 0.3529 | |||
| NEM / Newmont Corporation | 2.96 | 13.96 | 172.53 | 37.52 | 0.4049 | 0.0558 | |||
| NEE / NextEra Energy, Inc. | 2.40 | -1.03 | 166.59 | -3.08 | 0.3909 | -0.0873 | |||
| DAL / Delta Air Lines, Inc. | 3.12 | -5.58 | 153.66 | 6.50 | 0.3606 | -0.0408 | |||
| ACM / AECOM | 1.32 | -3.67 | 148.92 | 17.24 | 0.3495 | -0.0039 | |||
| ELV / Elevance Health, Inc. | 0.38 | 0.09 | 148.45 | -10.50 | 0.3484 | -0.1131 | |||
| ZTS / Zoetis Inc. | 0.94 | -14.79 | 145.88 | -19.29 | 0.3423 | -0.1606 | |||
| TEL / TE Connectivity plc | 0.71 | -7.14 | 119.71 | 10.84 | 0.2809 | -0.0196 | |||
| CCEP / Coca-Cola Europacific Partners PLC | 1.27 | -0.30 | 118.09 | 6.22 | 0.2771 | -0.0322 | |||
| CPNG / Coupang, Inc. | 3.85 | 20.83 | 115.50 | 65.07 | 0.2710 | 0.0764 | |||
| BAP / Credicorp Ltd. | 0.51 | -5.20 | 114.69 | 13.82 | 0.2691 | -0.0112 | |||
| META / Meta Platforms, Inc. | 0.14 | -20.20 | 104.43 | 2.19 | 0.2451 | -0.0393 | |||
| TTEK / Tetra Tech, Inc. | 2.79 | -6.63 | 100.40 | 14.79 | 0.2356 | -0.0077 | |||
| GLPI / Gaming and Leisure Properties, Inc. | 2.10 | 34.46 | 98.08 | 23.32 | 0.2302 | 0.0089 | |||
| NTRA / Natera, Inc. | 0.56 | 149.11 | 95.11 | 197.61 | 0.2232 | 0.1343 | |||
| AU / AngloGold Ashanti plc | 2.07 | -11.56 | 94.21 | 8.57 | 0.2211 | -0.0203 | |||
| CME / CME Group Inc. | 0.33 | 34.54 | 90.84 | 39.77 | 0.2132 | 0.0324 | |||
| TXN / Texas Instruments Incorporated | 0.42 | -20.00 | 86.67 | -7.57 | 0.2034 | -0.0575 | |||
| KR / The Kroger Co. | 1.20 | -9.07 | 85.98 | -3.64 | 0.2018 | -0.0465 | |||
| SCHW / The Charles Schwab Corporation | 0.92 | -12.13 | 83.72 | 2.42 | 0.1965 | -0.0310 | |||
| KGCRF / Kinross Gold Corporation - Equity Right | 5.33 | 26.15 | 83.16 | 56.24 | 0.1952 | 0.0471 | |||
| WM / Waste Management, Inc. | 0.36 | -39.48 | 81.41 | -40.18 | 0.1910 | -0.1876 | |||
| CP / Canadian Pacific Kansas City Limited | 0.99 | 91.36 | 78.32 | 116.21 | 0.1838 | 0.0830 | |||
| MMYT / MakeMyTrip Limited | 0.78 | 1.32 | 76.76 | 1.35 | 0.1801 | -0.0306 | |||
| TX / Ternium S.A. - Depositary Receipt (Common Stock) | 2.41 | 5.18 | 72.45 | 1.60 | 0.1700 | -0.0284 | |||
| ACN / Accenture plc | 0.24 | -5.51 | 71.79 | -9.49 | 0.1685 | -0.0522 | |||
| VIST / Vista Energy, S.A.B. de C.V. - Depositary Receipt (Common Stock) | 1.34 | 74.00 | 63.96 | 78.67 | 0.1501 | 0.0505 | |||
| BR / Broadridge Financial Solutions, Inc. | 0.26 | -5.46 | 62.71 | -5.24 | 0.1472 | -0.0370 | |||
| FMX / Fomento Económico Mexicano, S.A.B. de C.V. - Depositary Receipt (Common Stock) | 0.60 | -3.84 | 61.44 | 1.48 | 0.1442 | -0.0243 | |||
| TECK / Teck Resources Limited | 1.48 | 436.56 | 59.77 | 494.70 | 0.1403 | 0.1123 | |||
| PAASF / Pan American Silver Corp. - Equity Right | 2.09 | 3.27 | 59.35 | 13.55 | 0.1393 | -0.0061 | |||
| AGI / Alamos Gold Inc. | 2.17 | 20.16 | 57.63 | 19.39 | 0.1352 | 0.0009 | |||
| CDNS / Cadence Design Systems, Inc. | 0.19 | -4.56 | 57.50 | 15.63 | 0.1349 | -0.0034 | |||
| VALE / Vale S.A. - Depositary Receipt (Common Stock) | 5.89 | -6.65 | 57.15 | -9.17 | 0.1341 | -0.0409 | |||
| HDB / HDFC Bank Limited - Depositary Receipt (Common Stock) | 0.70 | 20.39 | 53.86 | 38.93 | 0.1264 | 0.0185 | |||
| DE / Deere & Company | 0.10 | 51.79 | 0.1215 | 0.1215 | |||||
| CVX / Chevron Corporation | 0.35 | 47.20 | 50.45 | 26.00 | 0.1184 | 0.0070 | |||
| ASML / ASML Holding N.V. - Depositary Receipt (Common Stock) | 0.06 | -7.99 | 48.40 | 11.27 | 0.1136 | -0.0074 | |||
| KT / KT Corporation - Depositary Receipt (Common Stock) | 2.29 | -53.15 | 47.61 | -45.03 | 0.1117 | -0.1293 | |||
| CCI / Crown Castle Inc. | 0.43 | -3.94 | 44.43 | -5.32 | 0.1043 | -0.0263 | |||
| IAG / IAMGOLD Corporation | 5.35 | 127.69 | 39.30 | 167.77 | 0.0922 | 0.0514 | |||
| QRVO / Qorvo, Inc. | 0.46 | -9.96 | 39.25 | 5.58 | 0.0921 | -0.0113 | |||
| CTVA / Corteva, Inc. | 0.52 | -0.11 | 38.40 | 18.30 | 0.0901 | -0.0002 | |||
| XP / XP Inc. | 1.88 | -8.96 | 37.89 | 33.75 | 0.0889 | 0.0101 | |||
| PG / The Procter & Gamble Company | 0.23 | -5.15 | 37.38 | -11.33 | 0.0877 | -0.0296 | |||
| AMT / American Tower Corporation | 0.17 | 49.63 | 37.29 | 51.99 | 0.0875 | 0.0192 | |||
| HL / Hecla Mining Company | 6.12 | -10.57 | 36.64 | -3.65 | 0.0860 | -0.0198 | |||
| KSPI / Joint Stock Company Kaspi.kz - Depositary Receipt (Common Stock) | 0.43 | -8.81 | 36.47 | -16.63 | 0.0856 | -0.0361 | |||
| MCK / McKesson Corporation | 0.05 | -42.07 | 35.04 | -36.92 | 0.0822 | -0.0723 | |||
| GOOG / Alphabet Inc. | 0.19 | 303.98 | 34.08 | 492.39 | 0.0800 | 0.0632 | |||
| NKE / NIKE, Inc. | 0.46 | -4.65 | 32.97 | 6.70 | 0.0774 | -0.0086 | |||
| UNH / UnitedHealth Group Incorporated | 0.11 | -33.58 | 32.78 | -60.44 | 0.0769 | -0.1536 | |||
| INDA / iShares Trust - iShares MSCI India ETF | 0.56 | -3.39 | 31.45 | 4.49 | 0.0738 | -0.0099 | |||
| DLB / Dolby Laboratories, Inc. | 0.42 | -9.35 | 31.35 | -16.18 | 0.0736 | -0.0305 | |||
| IDXX / IDEXX Laboratories, Inc. | 0.06 | -10.34 | 31.07 | 14.51 | 0.0729 | -0.0026 | |||
| VEEV / Veeva Systems Inc. | 0.10 | -10.35 | 28.42 | 11.46 | 0.0667 | -0.0042 | |||
| HLT / Hilton Worldwide Holdings Inc. | 0.11 | 28.19 | 0.0662 | 0.0662 | |||||
| AMAT / Applied Materials, Inc. | 0.15 | 27.48 | 0.0645 | 0.0645 | |||||
| ROK / Rockwell Automation, Inc. | 0.08 | 0.00 | 27.38 | 28.56 | 0.0643 | 0.0050 | |||
| ADBE / Adobe Inc. | 0.07 | -10.35 | 26.94 | -9.56 | 0.0632 | -0.0197 | |||
| MOS / The Mosaic Company | 0.73 | 19.21 | 26.49 | 61.02 | 0.0622 | 0.0164 | |||
| CSGP / CoStar Group, Inc. | 0.32 | -10.35 | 25.73 | -9.02 | 0.0604 | -0.0183 | |||
| DLR / Digital Realty Trust, Inc. | 0.14 | 0.00 | 25.28 | 21.66 | 0.0593 | 0.0015 | |||
| SYK / Stryker Corporation | 0.06 | -10.35 | 24.11 | -4.72 | 0.0566 | -0.0138 | |||
| KSA / iShares Trust - iShares MSCI Saudi Arabia ETF | 0.61 | 100.59 | 23.65 | 86.87 | 0.0555 | 0.0203 | |||
| PAYC / Paycom Software, Inc. | 0.10 | -15.77 | 22.69 | -10.79 | 0.0532 | -0.0175 | |||
| AXP / American Express Company | 0.07 | -30.52 | 22.61 | -17.63 | 0.0531 | -0.0233 | |||
| WST / West Pharmaceutical Services, Inc. | 0.10 | -10.56 | 22.02 | -12.59 | 0.0517 | -0.0184 | |||
| ALC / Alcon Inc. | 0.25 | -10.41 | 21.92 | -16.69 | 0.0514 | -0.0218 | |||
| STNE / StoneCo Ltd. | 1.33 | 21.33 | 0.0501 | 0.0501 | |||||
| AON / Aon plc | 0.06 | -2.48 | 20.67 | -12.82 | 0.0485 | -0.0175 | |||
| FI / Fiserv, Inc. | 0.12 | 20.65 | 0.0485 | 0.0485 | |||||
| WMB / The Williams Companies, Inc. | 0.33 | -15.35 | 20.48 | -11.03 | 0.0481 | -0.0160 | |||
| YUMC / Yum China Holdings, Inc. | 0.45 | 20.19 | 0.0474 | 0.0474 | |||||
| TFPM / Triple Flag Precious Metals Corp. | 0.82 | -30.50 | 19.51 | -14.01 | 0.0458 | -0.0173 | |||
| ORLY / O'Reilly Automotive, Inc. | 0.21 | 1,244.71 | 18.93 | -15.40 | 0.0444 | -0.0178 | |||
| XRAY / DENTSPLY SIRONA Inc. | 1.16 | 18.42 | 0.0432 | 0.0432 | |||||
| SHYG / iShares Trust - iShares 0-5 Year High Yield Corporate Bond ETF | 0.42 | 0.00 | 18.28 | 1.46 | 0.0429 | -0.0072 | |||
| SRLN / SSGA Active Trust - SPDR Blackstone Senior Loan ETF | 0.43 | 0.00 | 17.95 | 1.12 | 0.0421 | -0.0073 | |||
| BKLN / Invesco Exchange-Traded Fund Trust II - Invesco Senior Loan ETF | 0.85 | 0.00 | 17.71 | 1.06 | 0.0416 | -0.0072 | |||
| NOV / NOV Inc. | 1.40 | 51.17 | 17.46 | 23.46 | 0.0410 | 0.0016 | |||
| EQT / EQT Corporation | 0.27 | 72.18 | 15.64 | 87.94 | 0.0367 | 0.0136 | |||
| SABR / Sabre Corporation | 4.95 | 15.64 | 0.0367 | 0.0367 | |||||
| FTI / TechnipFMC plc | 0.45 | -36.62 | 15.49 | -31.13 | 0.0363 | -0.0262 | |||
| BABA / Alibaba Group Holding Limited - Depositary Receipt (Common Stock) | 0.14 | 15.32 | 0.0359 | 0.0359 | |||||
| BEPC / Brookfield Renewable Corporation | 0.46 | 15.12 | 0.0355 | 0.0355 | |||||
| SLB / Schlumberger Limited | 0.44 | 24.60 | 15.03 | 0.76 | 0.0353 | -0.0062 | |||
| BWA / BorgWarner Inc. | 0.45 | -71.54 | 14.92 | -66.74 | 0.0350 | -0.0898 | |||
| YUM / Yum! Brands, Inc. | 0.10 | 14.83 | 0.0348 | 0.0348 | |||||
| BIPC / Brookfield Infrastructure Corporation | 0.34 | 14.19 | 0.0333 | 0.0333 | |||||
| NU / Nu Holdings Ltd. | 1.02 | 33.05 | 14.04 | 78.25 | 0.0330 | 0.0110 | |||
| QCOM / QUALCOMM Incorporated | 0.09 | 13.88 | 0.0326 | 0.0326 | |||||
| CF / CF Industries Holdings, Inc. | 0.15 | 1.28 | 13.44 | 19.23 | 0.0315 | 0.0002 | |||
| TRGP / Targa Resources Corp. | 0.08 | 4.33 | 13.11 | -9.41 | 0.0308 | -0.0095 | |||
| PEP / PepsiCo, Inc. | 0.10 | 0.50 | 12.93 | -11.50 | 0.0303 | -0.0103 | |||
| BKR / Baker Hughes Company | 0.34 | -31.20 | 12.86 | -39.98 | 0.0302 | -0.0294 | |||
| VNOM / Viper Energy, Inc. | 0.32 | 101.23 | 12.36 | 69.95 | 0.0290 | 0.0088 | |||
| VTR / Ventas, Inc. | 0.19 | 0.00 | 12.28 | -8.16 | 0.0288 | -0.0084 | |||
| STLD / Steel Dynamics, Inc. | 0.09 | 0.77 | 11.49 | 3.13 | 0.0270 | -0.0040 | |||
| PLD / Prologis, Inc. | 0.11 | 482.62 | 11.45 | 447.92 | 0.0269 | 0.0210 | |||
| KMX / CarMax, Inc. | 0.15 | -14.38 | 10.37 | -26.15 | 0.0243 | -0.0147 | |||
| VLTO / Veralto Corporation | 0.10 | -2.97 | 10.33 | 0.52 | 0.0242 | -0.0043 | |||
| CSCO / Cisco Systems, Inc. | 0.15 | -24.31 | 10.28 | -14.90 | 0.0241 | -0.0095 | |||
| HII / Huntington Ingalls Industries, Inc. | 0.04 | -42.06 | 10.23 | -31.43 | 0.0240 | -0.0175 | |||
| ONON / On Holding AG | 0.19 | 9.80 | 0.0230 | 0.0230 | |||||
| SRE / Sempra | 0.12 | 9.46 | 0.0222 | 0.0222 | |||||
| DHR / Danaher Corporation | 0.04 | -45.41 | 8.81 | -47.39 | 0.0207 | -0.0259 | |||
| INTC / Intel Corporation | 0.39 | -15.42 | 8.68 | -16.58 | 0.0204 | -0.0086 | |||
| LKQ / LKQ Corporation | 0.22 | -69.66 | 8.11 | -73.60 | 0.0190 | -0.0664 | |||
| SIRI / Sirius XM Holdings Inc. | 0.34 | 78.33 | 7.86 | 81.71 | 0.0184 | 0.0064 | |||
| HD / The Home Depot, Inc. | 0.02 | 9.26 | 7.63 | 9.32 | 0.0179 | -0.0015 | |||
| IR / Ingersoll Rand Inc. | 0.09 | 7.60 | 0.0178 | 0.0178 | |||||
| TAP / Molson Coors Beverage Company | 0.15 | 7.44 | 0.0175 | 0.0175 | |||||
| MRK / Merck & Co., Inc. | 0.09 | 61.53 | 7.25 | 42.47 | 0.0170 | 0.0029 | |||
| ABEV / Ambev S.A. - Depositary Receipt (Common Stock) | 2.80 | -9.45 | 6.75 | -6.34 | 0.0158 | -0.0042 | |||
| ZG / Zillow Group, Inc. | 0.10 | -1.56 | 6.75 | 0.85 | 0.0158 | -0.0028 | |||
| FTXP / Foothills Exploration, Inc. | 0.01 | -32.02 | 6.41 | -10.42 | 0.0150 | -0.0049 | |||
| USHY / iShares Trust - iShares Broad USD High Yield Corporate Bond ETF | 0.15 | 0.00 | 5.66 | 1.89 | 0.0133 | -0.0022 | |||
| MELI / MercadoLibre, Inc. | 0.00 | 117.03 | 4.73 | 190.72 | 0.0111 | 0.0066 | |||
| OLPX / Olaplex Holdings, Inc. | 3.33 | 18.49 | 4.67 | 30.63 | 0.0110 | 0.0010 | |||
| AEM / Agnico Eagle Mines Limited | 0.04 | -91.20 | 4.60 | -90.35 | 0.0108 | -0.1217 | |||
| DHI / D.R. Horton, Inc. | 0.04 | 4.52 | 0.0106 | 0.0106 | |||||
| KOF / Coca-Cola FEMSA, S.A.B. de C.V. - Depositary Receipt (Common Stock) | 0.04 | 0.00 | 4.22 | 5.96 | 0.0099 | -0.0012 | |||
| CCU / Compañía Cervecerías Unidas S.A. - Depositary Receipt (Common Stock) | 0.31 | 0.00 | 4.04 | -15.00 | 0.0095 | -0.0037 | |||
| COP / ConocoPhillips | 0.03 | 3.05 | 0.0072 | 0.0072 | |||||
| LVS / Las Vegas Sands Corp. | 0.05 | 0.00 | 2.31 | 12.60 | 0.0054 | -0.0003 | |||
| 12F / Fortis Inc. | 0.05 | 2.21 | 0.0052 | 0.0052 | |||||
| BIDU / Baidu, Inc. - Depositary Receipt (Common Stock) | 0.02 | -62.18 | 1.72 | -64.77 | 0.0040 | -0.0095 | |||
| DBRG / DigitalBridge Group, Inc. | 0.16 | 1.70 | 0.0040 | 0.0040 | |||||
| BDX / Becton, Dickinson and Company | 0.01 | 1.63 | 0.0038 | 0.0038 | |||||
| CPB / The Campbell's Company | 0.05 | 1.42 | 0.0033 | 0.0033 | |||||
| ASX / ASE Technology Holding Co., Ltd. - Depositary Receipt (Common Stock) | 0.13 | -1.53 | 1.31 | 16.21 | 0.0031 | -0.0001 | |||
| CNMD / CONMED Corporation | 0.02 | 1.00 | 0.0024 | 0.0024 | |||||
| MAR / Marriott International, Inc. | 0.00 | 0.58 | 0.0014 | 0.0014 | |||||
| IGSB / iShares Trust - iShares 1-5 Year Investment Grade Corporate Bond ETF | 0.01 | 0.00 | 0.34 | 0.59 | 0.0008 | -0.0001 | |||
| VCIT / Vanguard Scottsdale Funds - Vanguard Intermediate-Term Corporate Bond ETF | 0.00 | 0.00 | 0.22 | 1.41 | 0.0005 | -0.0001 | |||
| PLG / Platinum Group Metals Ltd. | 0.10 | 0.00 | 0.15 | 23.97 | 0.0004 | 0.0000 | |||
| JAAA / Janus Detroit Street Trust - Janus Henderson AAA CLO ETF | 0.00 | 0.00 | 0.14 | 0.00 | 0.0003 | -0.0001 | |||
| SAP / SAP SE - Depositary Receipt (Common Stock) | 0.00 | -62.46 | 0.04 | -57.32 | 0.0001 | -0.0001 | |||
| IHG / InterContinental Hotels Group PLC - Depositary Receipt (Common Stock) | 0.00 | -20.95 | 0.01 | -18.75 | 0.0000 | -0.0000 | |||
| NVS / Novartis AG - Depositary Receipt (Common Stock) | 0.00 | -64.63 | 0.01 | -62.50 | 0.0000 | -0.0000 | |||
| BUD / Anheuser-Busch InBev SA/NV - Depositary Receipt (Common Stock) | 0.00 | -99.99 | 0.01 | -100.00 | 0.0000 | -0.3402 | |||
| MO / Altria Group, Inc. | 0.00 | 0.00 | 0.0000 | 0.0000 | |||||
| DEO / Diageo plc - Depositary Receipt (Common Stock) | 0.00 | -64.94 | 0.00 | -75.00 | 0.0000 | -0.0000 | |||
| LW / Lamb Weston Holdings, Inc. | 0.00 | -100.00 | 0.00 | 0.0000 | |||||
| GILD / Gilead Sciences, Inc. | 0.00 | -100.00 | 0.00 | 0.0000 | |||||
| GLRE / Greenlight Capital Re, Ltd. | 0.00 | -100.00 | 0.00 | 0.0000 | |||||
| LNW / Light & Wonder, Inc. | 0.00 | -100.00 | 0.00 | 0.0000 | |||||
| SIG / Signet Jewelers Limited | 0.00 | -100.00 | 0.00 | 0.0000 | |||||
| EMBC / Embecta Corp. | 0.00 | -100.00 | 0.00 | 0.0000 | |||||
| MTAL / MAC Copper Limited | 0.00 | -100.00 | 0.00 | 0.0000 | |||||
| RYAAY / Ryanair Holdings plc - Depositary Receipt (Common Stock) | 0.00 | -100.00 | 0.00 | 0.0000 | |||||
| FBIN / Fortune Brands Innovations, Inc. | 0.00 | -100.00 | 0.00 | 0.0000 | |||||
| PGR / The Progressive Corporation | 0.00 | -100.00 | 0.00 | 0.0000 | |||||
| HELE / Helen of Troy Limited | 0.00 | -100.00 | 0.00 | 0.0000 | |||||
| ANSS / ANSYS, Inc. | 0.00 | -100.00 | 0.00 | 0.0000 | |||||
| EPAM / EPAM Systems, Inc. | 0.00 | -100.00 | 0.00 | 0.0000 | |||||
| CNH / CNH Industrial N.V. | 0.00 | -100.00 | 0.00 | 0.0000 | |||||
| RGLD / Royal Gold, Inc. | 0.00 | -100.00 | 0.00 | 0.0000 | |||||
| EGO / Eldorado Gold Corporation | 0.00 | -100.00 | 0.00 | 0.0000 | |||||
| MPC / Marathon Petroleum Corporation | 0.00 | -100.00 | 0.00 | 0.0000 | |||||
| GOLD / Barrick Mining Corporation | 0.00 | -100.00 | 0.00 | 0.0000 | |||||
| PPTA / Perpetua Resources Corp. | 0.00 | -100.00 | 0.00 | 0.0000 | |||||
| FUTU / Futu Holdings Limited - Depositary Receipt (Common Stock) | 0.00 | -100.00 | 0.00 | 0.0000 | |||||
| WBD / Warner Bros. Discovery, Inc. | 0.00 | -100.00 | 0.00 | 0.0000 | |||||
| AA / Alcoa Corporation | 0.00 | -100.00 | 0.00 | 0.0000 |