Mga Batayang Estadistika
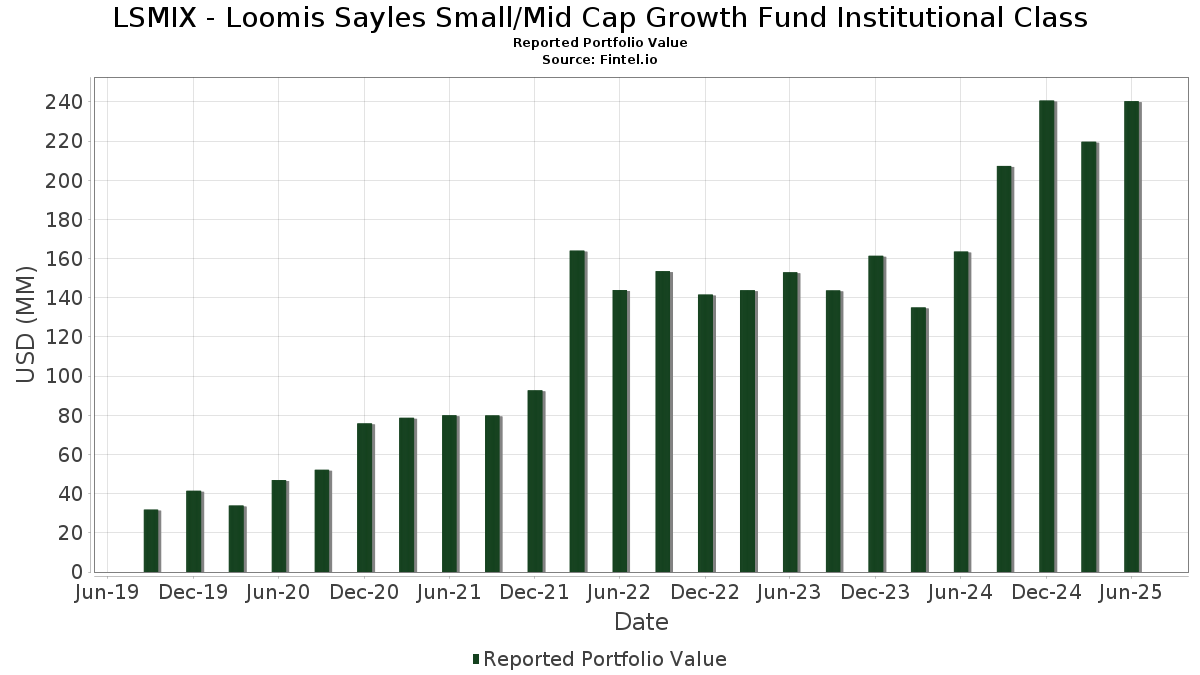
| Nilai Portofolio | $ 240,393,066 |
| Posisi Saat Ini | 86 |
Kepemilikan Terbaru, Kinerja, AUM (dari 13F, 13D)
LSMIX - Loomis Sayles Small/Mid Cap Growth Fund Institutional Class telah mengungkapkan total kepemilikan 86 dalam pengajuan SEC terbaru mereka. Nilai portofolio terbaru dihitung sebesar $ 240,393,066 USD. Aset yang Dikelola (AUM) sebenarnya adalah nilai ini ditambah kas (yang tidak diungkapkan). Aset-aset utama LSMIX - Loomis Sayles Small/Mid Cap Growth Fund Institutional Class adalah Casey's General Stores, Inc. (US:CASY) , BWX Technologies, Inc. (US:BWXT) , Insmed Incorporated (US:INSM) , RBC Bearings Incorporated (US:RBC) , and HealthEquity, Inc. (US:HQY) . Posisi baru LSMIX - Loomis Sayles Small/Mid Cap Growth Fund Institutional Class meliputi: Universal Technical Institute, Inc. (US:UTI) , Hinge Health, Inc. (US:HNGE) , Chime Financial, Inc. (US:CHYM) , Leonardo DRS, Inc. (US:DRS) , and Mirion Technologies, Inc. (US:MIR) .
Peningkatan Tertinggi Kuartal Ini
Kami menggunakan perubahan dalam alokasi portofolio karena ini adalah metrik yang paling bermakna. Perubahan dapat disebabkan oleh perdagangan atau perubahan harga saham.
| Keamanan | Saham (MM) |
Nilai (Juta Dolar AS) |
Portfolio % | ΔPorsyento ng Portfolio |
|---|---|---|---|---|
| 6.55 | 2.7256 | 2.7256 | ||
| 0.07 | 2.43 | 1.0102 | 1.0102 | |
| 0.01 | 2.36 | 0.9834 | 0.9834 | |
| 0.05 | 2.34 | 0.9735 | 0.9735 | |
| 0.06 | 2.17 | 0.9039 | 0.9039 | |
| 0.04 | 2.02 | 0.8409 | 0.8409 | |
| 0.09 | 1.88 | 0.7828 | 0.7828 | |
| 0.01 | 1.86 | 0.7743 | 0.7743 | |
| 0.07 | 1.79 | 0.7450 | 0.7450 | |
| 0.01 | 1.77 | 0.7380 | 0.7380 |
Penurunan Tertinggi Kuartal Ini
Kami menggunakan perubahan dalam alokasi portofolio karena ini adalah metrik yang paling bermakna. Perubahan dapat disebabkan oleh perdagangan atau perubahan harga saham.
| Keamanan | Saham (MM) |
Nilai (Juta Dolar AS) |
Portfolio % | ΔPorsyento ng Portfolio |
|---|---|---|---|---|
| 0.01 | 0.96 | 0.4000 | -1.0531 | |
| 0.11 | 2.36 | 0.9802 | -0.7099 | |
| 0.03 | 3.16 | 1.3137 | -0.6624 | |
| 0.02 | 1.71 | 0.7120 | -0.5505 | |
| 0.02 | 3.06 | 1.2733 | -0.5435 | |
| 0.04 | 3.30 | 1.3741 | -0.4354 | |
| 0.06 | 3.08 | 1.2833 | -0.3808 | |
| 0.04 | 3.84 | 1.5987 | -0.3297 | |
| 0.15 | 3.49 | 1.4524 | -0.3199 | |
| 0.03 | 3.19 | 1.3288 | -0.3110 |
Pengajuan 13F dan Dana
Formulir ini diajukan pada 2025-08-29 untuk periode pelaporan 2025-06-30. Klik ikon tautan untuk melihat riwayat transaksi selengkapnya.
Tingkatkan ke versi premium untuk membuka data premium dan ekspor ke Excel. ![]() .
.
| Keamanan | Ketik | Harga Saham Rata-rata | Saham (MM) |
ΔSaham (%) |
ΔSaham (%) |
Nilai ($MM) |
Portpolyo (%) |
ΔPortofolio (%) |
|
|---|---|---|---|---|---|---|---|---|---|
| FIXED INC CLEARING CORP.REPO / RA (000000000) | 6.55 | 2.7256 | 2.7256 | ||||||
| CASY / Casey's General Stores, Inc. | 0.01 | -2.67 | 4.67 | 14.42 | 1.9429 | 0.0841 | |||
| BWXT / BWX Technologies, Inc. | 0.03 | 1.09 | 4.66 | 47.65 | 1.9384 | 0.5010 | |||
| INSM / Insmed Incorporated | 0.04 | 1.30 | 4.28 | 33.63 | 1.7827 | 0.3224 | |||
| RBC / RBC Bearings Incorporated | 0.01 | 1.08 | 4.23 | 20.90 | 1.7624 | 0.1664 | |||
| HQY / HealthEquity, Inc. | 0.04 | 1.09 | 4.17 | 19.87 | 1.7353 | 0.1502 | |||
| CYBR / CyberArk Software Ltd. | 0.01 | -3.72 | 4.17 | 15.89 | 1.7338 | 0.0962 | |||
| LTH / Life Time Group Holdings, Inc. | 0.14 | 1.87 | 4.13 | 2.31 | 1.7175 | -0.1202 | |||
| TRMB / Trimble Inc. | 0.05 | 1.12 | 4.05 | 17.04 | 1.6870 | 0.1090 | |||
| TXRH / Texas Roadhouse, Inc. | 0.02 | 1.09 | 4.00 | 13.72 | 1.6634 | 0.0619 | |||
| ATI / ATI Inc. | 0.05 | -20.59 | 3.97 | 31.82 | 1.6537 | 0.2799 | |||
| BJ / BJ's Wholesale Club Holdings, Inc. | 0.04 | -3.97 | 3.84 | -9.24 | 1.5987 | -0.3297 | |||
| OLLI / Ollie's Bargain Outlet Holdings, Inc. | 0.03 | 1.09 | 3.80 | 14.51 | 1.5829 | 0.0694 | |||
| CIEN / Ciena Corporation | 0.05 | 1.09 | 3.78 | 36.06 | 1.5723 | 0.3072 | |||
| GWRE / Guidewire Software, Inc. | 0.02 | 1.09 | 3.76 | 27.06 | 1.5635 | 0.2162 | |||
| NTRA / Natera, Inc. | 0.02 | -20.00 | 3.73 | -4.43 | 1.5542 | -0.2260 | |||
| AX / Axos Financial, Inc. | 0.05 | 1.09 | 3.61 | 19.16 | 1.5043 | 0.1221 | |||
| ITT / ITT Inc. | 0.02 | 1.09 | 3.58 | 22.74 | 1.4900 | 0.1612 | |||
| PLNT / Planet Fitness, Inc. | 0.03 | 26.05 | 3.56 | 42.30 | 1.4814 | 0.3416 | |||
| PRVA / Privia Health Group, Inc. | 0.15 | 1.09 | 3.53 | 3.59 | 1.4672 | -0.0836 | |||
| LAUR / Laureate Education, Inc. | 0.15 | -21.53 | 3.49 | -10.29 | 1.4524 | -0.3199 | |||
| PEN / Penumbra, Inc. | 0.01 | 1.09 | 3.39 | -2.98 | 1.4115 | -0.1811 | |||
| ASND / Ascendis Pharma A/S - Depositary Receipt (Common Stock) | 0.02 | 1.09 | 3.33 | 11.95 | 1.3843 | 0.0307 | |||
| ITGR / Integer Holdings Corporation | 0.03 | 1.09 | 3.32 | 5.34 | 1.3810 | -0.0541 | |||
| KNF / Knife River Corporation | 0.04 | -8.14 | 3.30 | -16.87 | 1.3741 | -0.4354 | |||
| BFAM / Bright Horizons Family Solutions Inc. | 0.03 | -8.81 | 3.19 | -11.28 | 1.3288 | -0.3110 | |||
| CVLT / Commvault Systems, Inc. | 0.02 | 72.39 | 3.19 | 90.45 | 1.3281 | 0.5649 | |||
| MMSI / Merit Medical Systems, Inc. | 0.03 | -17.70 | 3.16 | -27.23 | 1.3137 | -0.6624 | |||
| AEIS / Advanced Energy Industries, Inc. | 0.02 | -17.58 | 3.14 | 14.59 | 1.3076 | 0.0584 | |||
| TYL / Tyler Technologies, Inc. | 0.01 | 1.10 | 3.10 | 3.09 | 1.2923 | -0.0799 | |||
| GENI / Genius Sports Limited | 0.30 | 27.32 | 3.10 | 32.28 | 1.2915 | 0.2227 | |||
| STEP / StepStone Group Inc. | 0.06 | -20.56 | 3.08 | -15.58 | 1.2833 | -0.3808 | |||
| ESAB / ESAB Corporation | 0.03 | 9.53 | 3.07 | 13.31 | 1.2794 | 0.0437 | |||
| HLNE / Hamilton Lane Incorporated | 0.02 | -19.74 | 3.06 | -23.28 | 1.2733 | -0.5435 | |||
| GNRC / Generac Holdings Inc. | 0.02 | 1.09 | 3.02 | 14.34 | 1.2579 | 0.0533 | |||
| KRMN / Karman Holdings Inc. | 0.06 | 1.11 | 3.00 | 52.36 | 1.2490 | 0.3518 | |||
| EXLS / ExlService Holdings, Inc. | 0.07 | 1.04 | 2.99 | -6.30 | 1.2457 | -0.2093 | |||
| ALGM / Allegro MicroSystems, Inc. | 0.09 | -23.85 | 2.96 | 3.61 | 1.2318 | -0.0697 | |||
| SLAB / Silicon Laboratories Inc. | 0.02 | 1.18 | 2.94 | 32.43 | 1.2239 | 0.2123 | |||
| PRCT / PROCEPT BioRobotics Corporation | 0.05 | 1.09 | 2.94 | -0.03 | 1.2222 | -0.1164 | |||
| SARO / StandardAero, Inc. | 0.09 | 18.31 | 2.94 | 40.61 | 1.2221 | 0.2703 | |||
| ROIV / Roivant Sciences Ltd. | 0.26 | 1.09 | 2.91 | 12.89 | 1.2103 | 0.0369 | |||
| NMR / Nova Ltd. | 0.01 | -23.17 | 2.83 | 14.74 | 1.1792 | 0.0539 | |||
| ALKT / Alkami Technology, Inc. | 0.09 | 1.09 | 2.83 | 16.06 | 1.1759 | 0.0669 | |||
| GKOS / Glaukos Corporation | 0.03 | 1.09 | 2.82 | 6.10 | 1.1723 | -0.0373 | |||
| FLS / Flowserve Corporation | 0.05 | 1.09 | 2.81 | 8.33 | 1.1695 | -0.0120 | |||
| PFGC / Performance Food Group Company | 0.03 | 25.42 | 2.81 | 39.51 | 1.1687 | 0.2517 | |||
| LOAR / Loar Holdings Inc. | 0.03 | 14.17 | 2.81 | 39.26 | 1.1680 | 0.2498 | |||
| DOCS / Doximity, Inc. | 0.05 | 16.22 | 2.79 | 22.85 | 1.1594 | 0.1263 | |||
| MGY / Magnolia Oil & Gas Corporation | 0.12 | 1.09 | 2.72 | -10.04 | 1.1301 | -0.2450 | |||
| CWST / Casella Waste Systems, Inc. | 0.02 | 1.09 | 2.61 | 4.61 | 1.0856 | -0.0505 | |||
| 8AK / Alkermes plc | 0.09 | 9.81 | 2.59 | -4.85 | 1.0770 | -0.1621 | |||
| UTI / Universal Technical Institute, Inc. | 0.07 | 2.43 | 1.0102 | 1.0102 | |||||
| GTLS / Chart Industries, Inc. | 0.01 | 2.36 | 0.9834 | 0.9834 | |||||
| MKSI / MKS Inc. | 0.02 | 27.67 | 2.36 | 58.32 | 0.9822 | 0.3029 | |||
| CWAN / Clearwater Analytics Holdings, Inc. | 0.11 | -22.41 | 2.36 | -36.51 | 0.9802 | -0.7099 | |||
| HXL / Hexcel Corporation | 0.04 | 1.09 | 2.34 | 4.28 | 0.9747 | -0.0485 | |||
| HNGE / Hinge Health, Inc. | 0.05 | 2.34 | 0.9735 | 0.9735 | |||||
| NBIX / Neurocrine Biosciences, Inc. | 0.02 | 13.37 | 2.30 | 23.71 | 0.9579 | 0.0594 | |||
| JEF / Jefferies Financial Group Inc. | 0.04 | -13.63 | 2.25 | -11.82 | 0.9382 | -0.2265 | |||
| RGA / Reinsurance Group of America, Incorporated | 0.01 | 1.08 | 2.18 | 1.82 | 0.9085 | -0.0681 | |||
| PCTY / Paylocity Holding Corporation | 0.01 | 36.28 | 2.18 | 31.86 | 0.9063 | 0.1536 | |||
| CHYM / Chime Financial, Inc. | 0.06 | 2.17 | 0.9039 | 0.9039 | |||||
| SITE / SiteOne Landscape Supply, Inc. | 0.02 | 1.09 | 2.14 | 0.66 | 0.8899 | -0.0777 | |||
| EEFT / Euronet Worldwide, Inc. | 0.02 | 35.85 | 2.12 | 28.92 | 0.8833 | 0.1331 | |||
| POWI / Power Integrations, Inc. | 0.04 | 1.09 | 2.08 | 11.90 | 0.8653 | 0.0188 | |||
| FSS / Federal Signal Corporation | 0.02 | 1.19 | 2.03 | 46.39 | 0.8447 | 0.2131 | |||
| DRS / Leonardo DRS, Inc. | 0.04 | 2.02 | 0.8409 | 0.8409 | |||||
| MIR / Mirion Technologies, Inc. | 0.09 | 1.88 | 0.7828 | 0.7828 | |||||
| VSEC / VSE Corporation | 0.01 | 1.86 | 0.7743 | 0.7743 | |||||
| CIGI / Colliers International Group Inc. | 0.01 | -12.06 | 1.80 | -5.37 | 0.7479 | -0.1172 | |||
| STVN / Stevanato Group S.p.A. | 0.07 | 1.79 | 0.7450 | 0.7450 | |||||
| IDCC / InterDigital, Inc. | 0.01 | 1.77 | 0.7380 | 0.7380 | |||||
| WK / Workiva Inc. | 0.02 | -31.54 | 1.71 | -38.29 | 0.7120 | -0.5505 | |||
| RGEN / Repligen Corporation | 0.01 | 1.70 | 0.7085 | 0.7085 | |||||
| NCNO / nCino, Inc. | 0.06 | 1.09 | 1.65 | 2.88 | 0.6851 | -0.0435 | |||
| LFST / LifeStance Health Group, Inc. | 0.31 | 25.39 | 1.59 | -2.70 | 0.6608 | -0.0824 | |||
| FLOC / Flowco Holdings Inc. | 0.08 | 20.15 | 1.49 | -16.61 | 0.6189 | -0.1932 | |||
| VCYT / Veracyte, Inc. | 0.05 | 0.98 | 1.44 | -7.93 | 0.5996 | -0.1134 | |||
| SPSC / SPS Commerce, Inc. | 0.01 | 1.09 | 1.43 | 3.64 | 0.5933 | -0.0333 | |||
| CLBT / Cellebrite DI Ltd. | 0.08 | -13.83 | 1.30 | -29.02 | 0.5415 | -0.2939 | |||
| RMBS / Rambus Inc. | 0.02 | 1.30 | 0.5398 | 0.5398 | |||||
| ENVA / Enova International, Inc. | 0.01 | 1.02 | 0.4239 | 0.4239 | |||||
| W1X / Wix.com Ltd. | 0.01 | -68.93 | 0.96 | -69.87 | 0.4000 | -1.0531 | |||
| TVTX / Travere Therapeutics, Inc. | 0.06 | -22.80 | 0.94 | -36.26 | 0.3895 | -0.2793 | |||
| SNEX / StoneX Group Inc. | 0.01 | 0.83 | 0.3464 | 0.3464 |