Mga Batayang Estadistika
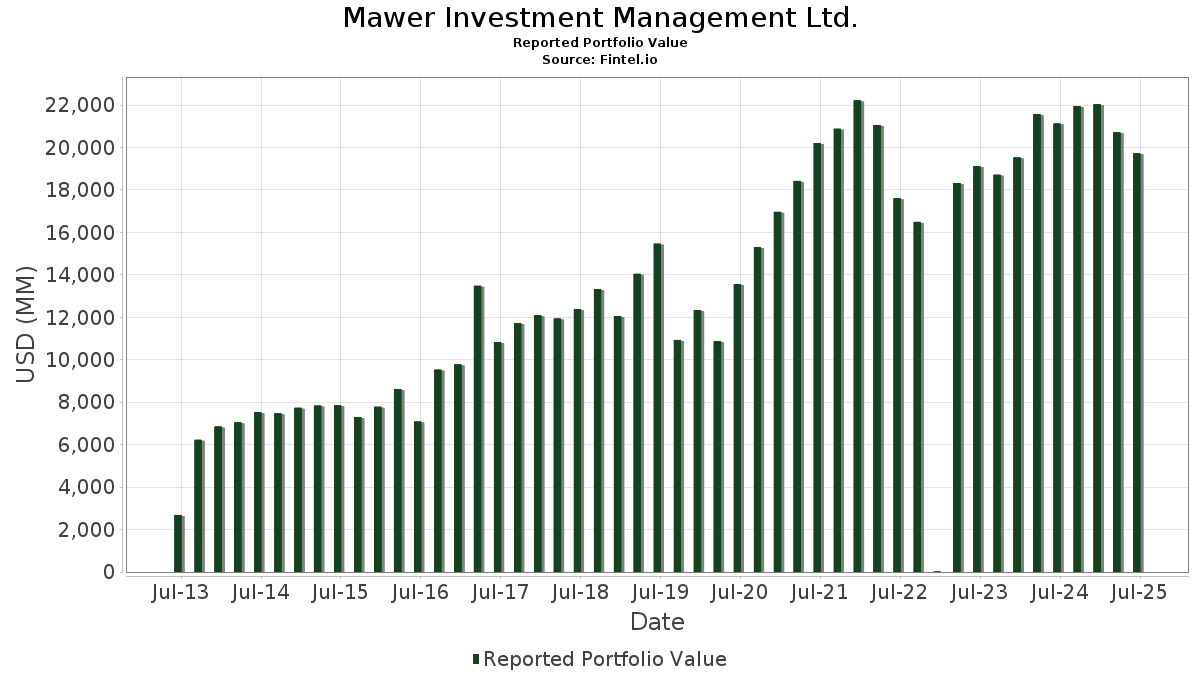
| Nilai Portofolio | $ 19,720,245,014 |
| Posisi Saat Ini | 110 |
Kepemilikan Terbaru, Kinerja, AUM (dari 13F, 13D)
Mawer Investment Management Ltd. telah mengungkapkan total kepemilikan 110 dalam pengajuan SEC terbaru mereka. Nilai portofolio terbaru dihitung sebesar $ 19,720,245,014 USD. Aset yang Dikelola (AUM) sebenarnya adalah nilai ini ditambah kas (yang tidak diungkapkan). Aset-aset utama Mawer Investment Management Ltd. adalah Microsoft Corporation (US:MSFT) , Marsh & McLennan Companies, Inc. (US:MMC) , Aon plc (US:AON) , Alphabet Inc. (US:GOOG) , and Booking Holdings Inc. (US:BKNG) . Posisi baru Mawer Investment Management Ltd. meliputi: Northrop Grumman Corporation (US:NOC) , AerCap Holdings N.V. (US:AER) , Elevance Health, Inc. (US:ELV) , Sprott Inc. (US:SII) , and Zoetis Inc. (US:ZTS) . Industri unggulan Mawer Investment Management Ltd. adalah "Printing, Publishing, And Allied Industries" (sic 27) , "Miscellaneous Retail " (sic 59) , and "Apparel And Accessory Stores" (sic 56) .
Peningkatan Tertinggi Kuartal Ini
Kami menggunakan perubahan dalam alokasi portofolio karena ini adalah metrik yang paling bermakna. Perubahan dapat disebabkan oleh perdagangan atau perubahan harga saham.
| Keamanan | Saham (MM) |
Nilai (Juta Dolar AS) |
Portfolio % | ΔPorsyento ng Portfolio |
|---|---|---|---|---|
| 0.74 | 543.16 | 2.7522 | 2.7522 | |
| 0.98 | 491.98 | 2.4948 | 2.4948 | |
| 2.87 | 1,428.97 | 7.2462 | 1.6938 | |
| 1.24 | 360.06 | 1.8244 | 1.3127 | |
| 1.55 | 181.38 | 0.9197 | 0.9197 | |
| 7.43 | 733.53 | 3.7168 | 0.9088 | |
| 0.16 | 919.34 | 4.6619 | 0.8969 | |
| 3.97 | 870.93 | 4.4130 | 0.8023 | |
| 0.00 | 591.06 | 2.9949 | 0.3577 | |
| 2.68 | 101.45 | 0.5144 | 0.3086 |
Penurunan Tertinggi Kuartal Ini
Kami menggunakan perubahan dalam alokasi portofolio karena ini adalah metrik yang paling bermakna. Perubahan dapat disebabkan oleh perdagangan atau perubahan harga saham.
| Keamanan | Saham (MM) |
Nilai (Juta Dolar AS) |
Portfolio % | ΔPorsyento ng Portfolio |
|---|---|---|---|---|
| 1.06 | 330.49 | 1.6746 | -3.5705 | |
| 3.94 | 161.83 | 0.8200 | -1.2360 | |
| 5.37 | 1,175.16 | 5.9546 | -1.0828 | |
| 0.10 | 31.64 | 0.1603 | -0.9772 | |
| 2.97 | 1,060.12 | 5.3717 | -0.9369 | |
| 4.84 | 290.99 | 1.4745 | -0.7241 | |
| 0.82 | 270.93 | 1.3728 | -0.3671 | |
| 0.89 | 162.51 | 0.8234 | -0.3135 | |
| 0.27 | 38.69 | 0.1960 | -0.2907 | |
| 2.11 | 750.54 | 3.8030 | -0.2823 |
Pengajuan 13D/G
Ini adalah daftar pengajuan 13D dan 13G yang dibuat dalam setahun terakhir (jika ada). Klik ikon tautan untuk melihat riwayat transaksi lengkap. Baris berwarna hijau menunjukkan posisi baru. Baris berwarna merah menunjukkan posisi yang sudah ditutup.
| Tanggal File | Formulir | Keamanan | Sebelumnya Saham |
Saat ini Saham |
ΔPersentase Saham | % Kepemilikan |
% ΔKepemilikan | |
|---|---|---|---|---|---|---|---|---|
| 2025-08-07 | XP / XP Inc. | 24,589,426 | 0 | -100.00 | 0.00 | -100.00 | ||
| 2025-08-07 | RHI / Robert Half Inc. | 8,079,597 | 3,942,158 | -51.21 | 3.86 | -50.70 | ||
| 2025-06-06 | SANG / Sangoma Technologies Corporation | 3,125,660 | 3,490,247 | 11.66 | 10.42 | 12.04 | ||
| 2025-05-09 | NOA / North American Construction Group Ltd. | 3,106,914 | 2,678,487 | -13.79 | 8.72 | -21.86 | ||
| 2025-05-09 | DFIN / Donnelley Financial Solutions, Inc. | 2,021,103 | 1,332,775 | -34.06 | 4.67 | -32.90 | ||
| 2025-05-09 | ESQ / Esquire Financial Holdings, Inc. | 420,212 | 779,889 | 85.59 | 9.25 | 83.17 | ||
| 2025-05-09 | TNET / TriNet Group, Inc. | 3,653,597 | 3,004,110 | -17.78 | 6.21 | -15.63 | ||
| 2025-02-12 | BBSI / Barrett Business Services, Inc. | 1,834,452 | 2,110,550 | 15.05 | 8.14 | 15.95 | ||
| 2024-11-12 | TIXT / TELUS International (Cda) Inc. | 6,449,296 | 0 | -100.00 | 0.00 | -100.00 | ||
| 2024-11-08 | BNT / Brookfield Wealth Solutions Ltd. | 1,317,978 | 3.04 | |||||
| 2024-11-08 | GIC / Global Industrial Company | 1,939,649 | 1,826,970 | -5.81 | 4.78 | -6.27 | ||
| 2024-11-08 | WINA / Winmark Corporation | 276,571 | 90,273 | -67.36 | 2.56 | -67.72 | ||
| 2024-11-08 | NSP / Insperity, Inc. | 4,451,904 | 5,190,036 | 16.58 | 13.83 | 15.83 | ||
| 2024-11-08 | WMG / Warner Music Group Corp. | 8,217,467 | 5.80 |
Pengajuan 13F dan Dana
Formulir ini diajukan pada 2025-08-07 untuk periode pelaporan 2025-06-30. Klik ikon tautan untuk melihat riwayat transaksi selengkapnya.
Tingkatkan ke versi premium untuk membuka data premium dan ekspor ke Excel. ![]() .
.
| Keamanan | Ketik | Harga Saham Rata-rata | Saham (MM) |
ΔSaham (%) |
ΔSaham (%) |
Nilai ($MM) |
Portpolyo (%) |
ΔPortofolio (%) |
|
|---|---|---|---|---|---|---|---|---|---|
| MSFT / Microsoft Corporation | 2.87 | -6.21 | 1,428.97 | 24.27 | 7.2462 | 1.6938 | |||
| MMC / Marsh & McLennan Companies, Inc. | 5.37 | -10.00 | 1,175.16 | -19.36 | 5.9546 | -1.0828 | |||
| AON / Aon plc | 2.97 | -9.23 | 1,060.12 | -18.85 | 5.3717 | -0.9369 | |||
| GOOG / Alphabet Inc. | 5.21 | -14.31 | 923.67 | -2.70 | 4.6803 | 0.0962 | |||
| BKNG / Booking Holdings Inc. | 0.16 | -6.17 | 919.34 | 17.91 | 4.6619 | 0.8969 | |||
| AMZN / Amazon.com, Inc. | 3.97 | 1.01 | 870.93 | 16.47 | 4.4130 | 0.8023 | |||
| V / Visa Inc. | 2.11 | -12.43 | 750.54 | -11.29 | 3.8030 | -0.2823 | |||
| APH / Amphenol Corporation | 7.43 | -16.22 | 733.53 | 26.14 | 3.7168 | 0.9088 | |||
| FCN / FTI Consulting, Inc. | 3.82 | -3.92 | 616.31 | -5.44 | 3.1229 | -0.0242 | |||
| BRK.A / Berkshire Hathaway Inc. | 0.00 | 18.57 | 591.06 | 8.23 | 2.9949 | 0.3577 | |||
| META / Meta Platforms, Inc. | 0.74 | 543.16 | 2.7522 | 2.7522 | |||||
| NOC / Northrop Grumman Corporation | 0.98 | 491.98 | 2.4948 | 2.4948 | |||||
| CDW / CDW Corporation | 2.64 | -6.60 | 471.90 | 4.09 | 2.3911 | 0.2019 | |||
| JPM / JPMorgan Chase & Co. | 1.24 | 187.50 | 360.06 | 239.78 | 1.8244 | 1.3127 | |||
| UNH / UnitedHealth Group Incorporated | 1.06 | -48.92 | 330.49 | -69.57 | 1.6746 | -3.5705 | |||
| SHEL / Shell plc - Depositary Receipt (Common Stock) | 4.59 | -6.88 | 323.22 | -10.53 | 1.6378 | -0.1066 | |||
| LULU / lululemon athletica inc. | 1.36 | 2.77 | 322.98 | -13.74 | 1.6365 | -0.1715 | |||
| NSP / Insperity, Inc. | 4.84 | -5.14 | 290.99 | -36.09 | 1.4745 | -0.7241 | |||
| DE / Deere & Company | 0.56 | -6.49 | 284.46 | 1.31 | 1.4414 | 0.0855 | |||
| CPAY / Corpay, Inc. | 0.82 | -20.98 | 270.93 | -24.81 | 1.3728 | -0.3671 | |||
| MEDP / Medpace Holdings, Inc. | 0.82 | 17.41 | 256.56 | 20.94 | 1.3010 | 0.2767 | |||
| ATR / AptarGroup, Inc. | 1.40 | 16.39 | 219.12 | 22.70 | 1.1111 | 0.2488 | |||
| AJG / Arthur J. Gallagher & Co. | 0.68 | -7.82 | 218.16 | -14.53 | 1.1055 | -0.1270 | |||
| TNET / TriNet Group, Inc. | 2.81 | -6.58 | 205.27 | -13.77 | 1.0401 | -0.1093 | |||
| FERG / Ferguson Enterprises Inc. | 0.93 | -6.86 | 202.14 | 26.58 | 1.0243 | 0.2531 | |||
| COR / Cencora, Inc. | 0.67 | -2.07 | 201.38 | 5.59 | 1.0204 | 0.0995 | |||
| WMG / Warner Music Group Corp. | 7.37 | -6.48 | 200.84 | -18.74 | 1.0177 | -0.1758 | |||
| CME / CME Group Inc. | 0.73 | -16.76 | 199.87 | -13.52 | 1.0128 | -0.1033 | |||
| TME / Tencent Music Entertainment Group - Depositary Receipt (Common Stock) | 10.15 | -7.63 | 197.74 | 24.93 | 1.0020 | 0.2377 | |||
| ACN / Accenture plc | 0.65 | -14.10 | 194.81 | -17.72 | 0.9871 | -0.1562 | |||
| VZ / Verizon Communications Inc. | 4.28 | -9.03 | 185.10 | -13.22 | 0.9379 | -0.0920 | |||
| AER / AerCap Holdings N.V. | 1.55 | 181.38 | 0.9197 | 0.9197 | |||||
| YUMC / Yum China Holdings, Inc. | 3.77 | -6.78 | 168.55 | -19.94 | 0.8541 | -0.1626 | |||
| WAT / Waters Corporation | 0.48 | -7.20 | 166.34 | -12.11 | 0.8428 | -0.0711 | |||
| ICE / Intercontinental Exchange, Inc. | 0.89 | -35.11 | 162.51 | -30.98 | 0.8234 | -0.3135 | |||
| RHI / Robert Half Inc. | 3.94 | -49.49 | 161.83 | -61.99 | 0.8200 | -1.2360 | |||
| ABT / Abbott Laboratories | 1.19 | -9.58 | 161.26 | -7.29 | 0.8171 | -0.0228 | |||
| MA / Mastercard Incorporated | 0.28 | -8.49 | 158.51 | -6.18 | 0.8032 | -0.0127 | |||
| PG / The Procter & Gamble Company | 0.99 | -9.29 | 158.18 | -15.19 | 0.8021 | -0.0985 | |||
| MLM / Martin Marietta Materials, Inc. | 0.29 | -1.30 | 157.40 | 13.32 | 0.7975 | 0.1268 | |||
| POOL / Pool Corporation | 0.50 | -5.98 | 145.26 | -13.91 | 0.7360 | -0.0788 | |||
| BWXT / BWX Technologies, Inc. | 0.90 | 15.60 | 129.72 | 68.81 | 0.6573 | 0.2862 | |||
| CACI / CACI International Inc | 0.27 | -7.34 | 127.02 | 20.38 | 0.6436 | 0.1341 | |||
| OSIS / OSI Systems, Inc. | 0.51 | 11.20 | 115.28 | 28.66 | 0.5841 | 0.1515 | |||
| AEP / American Electric Power Company, Inc. | 1.09 | -6.54 | 112.98 | -11.26 | 0.5725 | -0.0423 | |||
| VRSK / Verisk Analytics, Inc. | 0.36 | -13.61 | 110.67 | -9.59 | 0.5608 | -0.0303 | |||
| HDB / HDFC Bank Limited - Depositary Receipt (Common Stock) | 1.41 | 2.82 | 107.95 | 18.66 | 0.5474 | 0.1081 | |||
| VVV / Valvoline Inc. | 2.68 | 118.79 | 101.45 | 138.02 | 0.5144 | 0.3086 | |||
| SHW / The Sherwin-Williams Company | 0.27 | -9.77 | 93.83 | -11.28 | 0.4754 | -0.0352 | |||
| NKE / NIKE, Inc. | 1.21 | -12.32 | 85.92 | -1.88 | 0.4353 | 0.0125 | |||
| BBSI / Barrett Business Services, Inc. | 1.95 | -0.67 | 81.30 | 0.64 | 0.4119 | 0.0219 | |||
| DHR / Danaher Corporation | 0.40 | -7.76 | 79.19 | -11.12 | 0.4013 | -0.0290 | |||
| TXN / Texas Instruments Incorporated | 0.37 | 17.64 | 76.86 | 35.92 | 0.3894 | 0.1164 | |||
| SO / The Southern Company | 0.84 | -5.56 | 76.81 | -5.68 | 0.3892 | -0.0040 | |||
| BDX / Becton, Dickinson and Company | 0.44 | -0.33 | 76.16 | -25.05 | 0.3859 | -0.1048 | |||
| ESQ / Esquire Financial Holdings, Inc. | 0.78 | -0.51 | 73.44 | 24.93 | 0.3721 | 0.0883 | |||
| TW / Tradeweb Markets Inc. | 0.48 | -10.16 | 70.00 | -11.41 | 0.3547 | -0.0269 | |||
| SPGI / S&P Global Inc. | 0.13 | -11.65 | 69.68 | -8.31 | 0.3531 | -0.0139 | |||
| KSPI / Joint Stock Company Kaspi.kz - Depositary Receipt (Common Stock) | 0.81 | -6.37 | 68.38 | -14.40 | 0.3465 | -0.0392 | |||
| DFIN / Donnelley Financial Solutions, Inc. | 1.07 | -19.39 | 66.24 | 13.70 | 0.3356 | 0.0543 | |||
| BIO / Bio-Rad Laboratories, Inc. | 0.27 | -9.42 | 64.46 | -10.25 | 0.3266 | -0.0202 | |||
| JNJ / Johnson & Johnson | 0.41 | -17.81 | 62.60 | -24.30 | 0.3172 | -0.0821 | |||
| NTES / NetEase, Inc. - Depositary Receipt (Common Stock) | 0.46 | -30.70 | 62.38 | -9.38 | 0.3161 | -0.0163 | |||
| PAYX / Paychex, Inc. | 0.41 | -31.07 | 59.30 | -35.01 | 0.3007 | -0.1399 | |||
| AAON / AAON, Inc. | 0.79 | 39.67 | 58.30 | 31.83 | 0.2954 | 0.0819 | |||
| ELV / Elevance Health, Inc. | 0.14 | 53.89 | 0.2733 | 0.2733 | |||||
| ITT / ITT Inc. | 0.33 | -5.48 | 51.14 | 14.76 | 0.2591 | 0.0440 | |||
| SII / Sprott Inc. | 0.73 | 50.43 | 0.2557 | 0.2557 | |||||
| TSM / Taiwan Semiconductor Manufacturing Company Limited - Depositary Receipt (Common Stock) | 0.21 | 18.62 | 47.13 | 61.84 | 0.2388 | 0.0982 | |||
| ZTS / Zoetis Inc. | 0.29 | 45.78 | 0.2322 | 0.2322 | |||||
| CGNX / Cognex Corporation | 1.44 | 45.72 | 0.2319 | 0.2319 | |||||
| ABBV / AbbVie Inc. | 0.24 | -5.70 | 45.29 | -16.45 | 0.2295 | -0.0323 | |||
| ARM / Arm Holdings plc - Depositary Receipt (Common Stock) | 0.28 | 44.60 | 0.2262 | 0.2262 | |||||
| AME / AMETEK, Inc. | 0.24 | -30.04 | 42.97 | -26.46 | 0.2177 | -0.0644 | |||
| HSY / The Hershey Company | 0.26 | -5.30 | 42.42 | -8.11 | 0.2150 | -0.0080 | |||
| ICLR / ICON Public Limited Company | 0.27 | -53.83 | 38.69 | -61.62 | 0.1960 | -0.2907 | |||
| STT / State Street Corporation | 0.36 | -29.98 | 38.46 | -16.84 | 0.1949 | -0.0284 | |||
| MKC / McCormick & Company, Incorporated | 0.48 | -10.27 | 36.51 | -17.35 | 0.1850 | -0.0283 | |||
| RYAN / Ryan Specialty Holdings, Inc. | 0.50 | -2.78 | 33.79 | -10.52 | 0.1712 | -0.0111 | |||
| BWA / BorgWarner Inc. | 0.98 | -4.91 | 32.97 | 11.12 | 0.1670 | 0.0238 | |||
| SNA / Snap-on Incorporated | 0.10 | -85.46 | 31.64 | -86.57 | 0.1603 | -0.9772 | |||
| SN / SharkNinja, Inc. | 0.29 | -10.67 | 28.93 | 6.02 | 0.1466 | 0.0148 | |||
| BRK.B / Berkshire Hathaway Inc. | 0.06 | 8.37 | 27.99 | -1.15 | 0.1418 | 0.0051 | |||
| IBKR / Interactive Brokers Group, Inc. | 0.45 | 245.47 | 25.05 | 15.60 | 0.1269 | 0.0223 | |||
| CASH / Pathward Financial, Inc. | 0.25 | -11.35 | 20.18 | -3.85 | 0.1022 | 0.0009 | |||
| RMD / ResMed Inc. | 0.08 | -3.36 | 20.12 | 11.38 | 0.1019 | 0.0147 | |||
| LPLA / LPL Financial Holdings Inc. | 0.05 | -3.54 | 19.87 | 10.57 | 0.1007 | 0.0139 | |||
| KNSL / Kinsale Capital Group, Inc. | 0.04 | -3.36 | 17.27 | -3.92 | 0.0875 | 0.0007 | |||
| ENSG / The Ensign Group, Inc. | 0.11 | 16.90 | 0.0857 | 0.0857 | |||||
| FCNCA / First Citizens BancShares, Inc. | 0.01 | -3.34 | 16.87 | 1.99 | 0.0855 | 0.0056 | |||
| CSL / Carlisle Companies Incorporated | 0.04 | -20.96 | 14.76 | -13.32 | 0.0748 | -0.0074 | |||
| RBA / RB Global, Inc. | 0.13 | -3.63 | 13.84 | 2.03 | 0.0702 | 0.0047 | |||
| MUSA / Murphy USA Inc. | 0.03 | 18.95 | 12.90 | 2.99 | 0.0653 | 0.0049 | |||
| DHI / D.R. Horton, Inc. | 0.10 | -3.35 | 12.26 | -1.98 | 0.0621 | 0.0017 | |||
| FOUR / Shift4 Payments, Inc. | 0.11 | 63.63 | 10.59 | 98.48 | 0.0536 | 0.0279 | |||
| ABNB / Airbnb, Inc. | 0.08 | 55.39 | 9.93 | 72.16 | 0.0503 | 0.0225 | |||
| WMS / Advanced Drainage Systems, Inc. | 0.08 | -3.72 | 9.46 | 1.79 | 0.0480 | 0.0031 | |||
| CBZ / CBIZ, Inc. | 0.13 | 9.23 | 0.0468 | 0.0468 | |||||
| KLAC / KLA Corporation | 0.01 | -39.34 | 9.18 | -20.07 | 0.0465 | -0.0089 | |||
| VRSN / VeriSign, Inc. | 0.03 | -18.27 | 8.82 | -7.03 | 0.0447 | -0.0011 | |||
| ORLY / O'Reilly Automotive, Inc. | 0.09 | 859.69 | 8.35 | -39.62 | 0.0423 | -0.0244 | |||
| EEFT / Euronet Worldwide, Inc. | 0.08 | -3.55 | 8.15 | -8.49 | 0.0413 | -0.0017 | |||
| MAR / Marriott International, Inc. | 0.02 | 6.75 | 0.0342 | 0.0342 | |||||
| GOOGL / Alphabet Inc. | 0.03 | -19.73 | 6.09 | -8.52 | 0.0309 | -0.0013 | |||
| YMM / Full Truck Alliance Co. Ltd. - Depositary Receipt (Common Stock) | 0.43 | 42.51 | 5.09 | 31.82 | 0.0258 | 0.0071 | |||
| GSIG / Goldman Sachs ETF Trust - Goldman Sachs Access Investment Grade Corporate 1-5 Year Bond ETF | 0.03 | 4.15 | 0.0211 | 0.0211 | |||||
| PDD / PDD Holdings Inc. - Depositary Receipt (Common Stock) | 0.03 | 0.00 | 2.83 | -11.58 | 0.0143 | -0.0011 | |||
| AAPL / Apple Inc. | 0.00 | 0.00 | 0.81 | -7.62 | 0.0041 | -0.0001 | |||
| NVDA / NVIDIA Corporation | 0.00 | 0.00 | 0.32 | 45.83 | 0.0016 | 0.0006 | |||
| LLY / Eli Lilly and Company | 0.00 | 0.00 | 0.23 | -5.67 | 0.0012 | -0.0000 | |||
| XP / XP Inc. | 0.00 | -100.00 | 0.00 | 0.0000 | |||||
| CVS / CVS Health Corporation | 0.00 | -100.00 | 0.00 | 0.0000 | |||||
| WINA / Winmark Corporation | 0.00 | -100.00 | 0.00 | 0.0000 | |||||
| CRL / Charles River Laboratories International, Inc. | 0.00 | -100.00 | 0.00 | 0.0000 | |||||
| MBC / MasterBrand, Inc. | 0.00 | -100.00 | 0.00 | 0.0000 | |||||
| FDX / FedEx Corporation | 0.00 | -100.00 | 0.00 | 0.0000 | |||||
| XPEL / XPEL, Inc. | 0.00 | -100.00 | 0.00 | 0.0000 |