Mga Batayang Estadistika
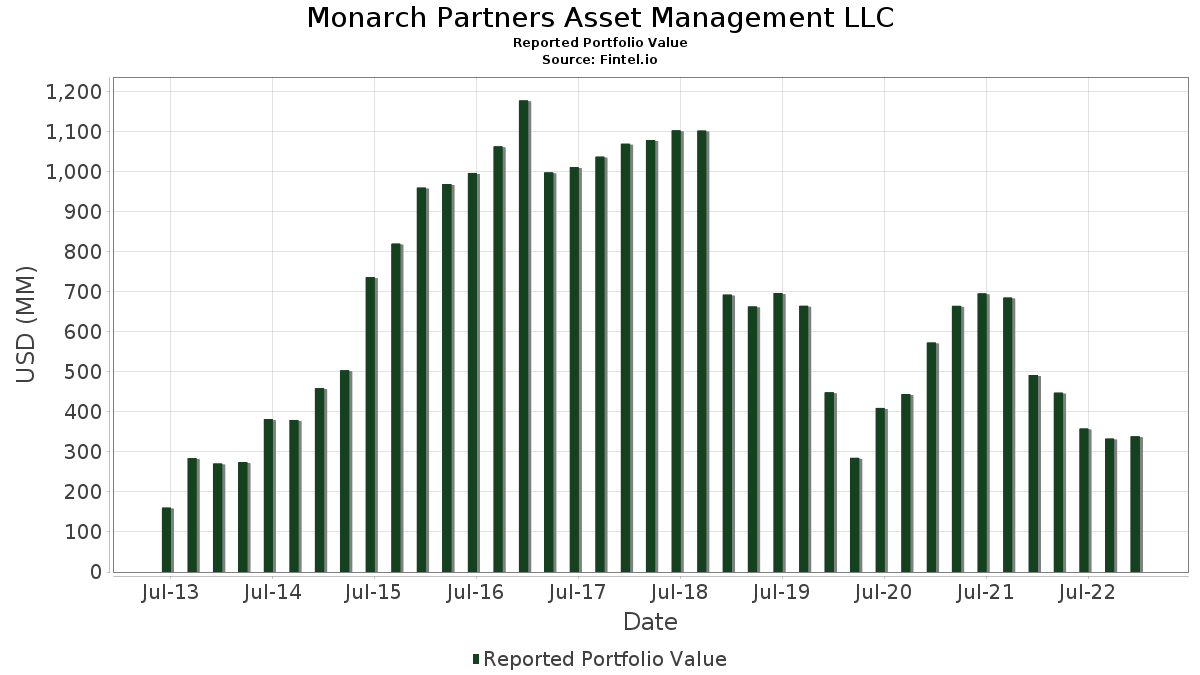
| Nilai Portofolio | $ 338,598,680 |
| Posisi Saat Ini | 133 |
Kepemilikan Terbaru, Kinerja, AUM (dari 13F, 13D)
Monarch Partners Asset Management LLC telah mengungkapkan total kepemilikan 133 dalam pengajuan SEC terbaru mereka. Nilai portofolio terbaru dihitung sebesar $ 338,598,680 USD. Aset yang Dikelola (AUM) sebenarnya adalah nilai ini ditambah kas (yang tidak diungkapkan). Aset-aset utama Monarch Partners Asset Management LLC adalah Leonardo DRS, Inc. (US:) , Modine Manufacturing Company (US:MOD) , Tecnoglass Inc. (US:TGLS) , Heritage Commerce Corp (US:HTBK) , and CareTrust REIT, Inc. (US:CTRE) . Posisi baru Monarch Partners Asset Management LLC meliputi: Leonardo DRS, Inc. (US:) , Lakeland Bancorp, Inc. (US:LBAI) , Celldex Therapeutics, Inc. (US:CLDX) , American Eagle Outfitters, Inc. (US:AEO) , and Mammoth Energy Services, Inc. (US:TUSK) .
Peningkatan Tertinggi Kuartal Ini
Kami menggunakan perubahan dalam alokasi portofolio karena ini adalah metrik yang paling bermakna. Perubahan dapat disebabkan oleh perdagangan atau perubahan harga saham.
| Keamanan | Saham (MM) |
Nilai (Juta Dolar AS) |
Portfolio % | ΔPorsyento ng Portfolio |
|---|---|---|---|---|
| 0.05 | 2.03 | 0.5986 | 0.5986 | |
| 0.20 | 1.70 | 0.5006 | 0.5006 | |
| 0.02 | 1.45 | 0.4295 | 0.4295 | |
| 0.10 | 1.38 | 0.4082 | 0.4082 | |
| 0.12 | 1.30 | 0.3830 | 0.3830 | |
| 0.32 | 1.13 | 0.3351 | 0.3351 | |
| 0.03 | 1.05 | 0.3103 | 0.3103 | |
| 0.23 | 3.73 | 1.1027 | 0.1924 | |
| 0.54 | 6.92 | 0.0020 | 0.0020 | |
| 0.43 | 4.37 | 0.0013 | 0.0013 |
Penurunan Tertinggi Kuartal Ini
Kami menggunakan perubahan dalam alokasi portofolio karena ini adalah metrik yang paling bermakna. Perubahan dapat disebabkan oleh perdagangan atau perubahan harga saham.
| Keamanan | Saham (MM) |
Nilai (Juta Dolar AS) |
Portfolio % | ΔPorsyento ng Portfolio |
|---|---|---|---|---|
| 0.09 | 4.42 | 0.0013 | -1.6932 | |
| 0.06 | 4.33 | 0.0013 | -1.6493 | |
| 0.14 | 4.57 | 0.0014 | -1.6360 | |
| 0.25 | 4.63 | 0.0014 | -1.5738 | |
| 0.06 | 4.16 | 0.0012 | -1.5403 | |
| 0.00 | 0.00 | -1.5301 | ||
| 0.04 | 3.57 | 0.0011 | -1.4609 | |
| 0.18 | 5.69 | 0.0017 | -1.4362 | |
| 0.26 | 4.88 | 0.0014 | -1.3277 | |
| 0.50 | 4.23 | 0.0012 | -1.3168 |
Pengajuan 13F dan Dana
Formulir ini diajukan pada 2023-02-02 untuk periode pelaporan 2022-12-31. Klik ikon tautan untuk melihat riwayat transaksi selengkapnya.
Tingkatkan ke versi premium untuk membuka data premium dan ekspor ke Excel. ![]() .
.
| Keamanan | Ketik | Harga Saham Rata-rata | Saham (MM) |
ΔSaham (%) |
ΔSaham (%) |
Nilai ($MM) |
Portpolyo (%) |
ΔPortofolio (%) |
|
|---|---|---|---|---|---|---|---|---|---|
| / Leonardo DRS, Inc. | 0.54 | 6.92 | 0.0020 | 0.0020 | |||||
| MOD / Modine Manufacturing Company | 0.33 | 10.88 | 6.57 | 70.15 | 0.0019 | -1.1584 | |||
| TGLS / Tecnoglass Inc. | 0.18 | -18.95 | 5.69 | 18.78 | 0.0017 | -1.4362 | |||
| HTBK / Heritage Commerce Corp | 0.41 | 24.22 | 5.29 | 42.38 | 0.0016 | -1.1137 | |||
| CTRE / CareTrust REIT, Inc. | 0.26 | 7.52 | 4.88 | 10.28 | 0.0014 | -1.3277 | |||
| UCTT / Ultra Clean Holdings, Inc. | 0.14 | 121.86 | 4.81 | 185.56 | 0.0014 | -0.5042 | |||
| NTST / NETSTREIT Corp. | 0.25 | -14.26 | 4.63 | -11.77 | 0.0014 | -1.5738 | |||
| CHEF / The Chefs' Warehouse, Inc. | 0.14 | -26.97 | 4.57 | -16.11 | 0.0014 | -1.6360 | |||
| OXM / Oxford Industries, Inc. | 0.05 | 5.45 | 4.49 | 9.43 | 0.0013 | -1.2311 | |||
| / ADTRAN, Inc. | 0.24 | 16.30 | 4.44 | 11.60 | 0.0013 | -1.1929 | |||
| UTL / Unitil Corporation | 0.09 | -29.13 | 4.42 | -21.65 | 0.0013 | -1.6932 | |||
| HDSN / Hudson Technologies, Inc. | 0.43 | 4.37 | 0.0013 | 0.0013 | |||||
| TMST / TimkenSteel Corporation | 0.24 | 4.36 | 0.0013 | 0.0013 | |||||
| HURN / Huron Consulting Group Inc. | 0.06 | -28.04 | 4.33 | -21.15 | 0.0013 | -1.6493 | |||
| KRYS / Krystal Biotech, Inc. | 0.05 | 15.94 | 4.27 | 31.75 | 0.0013 | -0.9725 | |||
| STKL / SunOpta Inc. | 0.50 | 3.95 | 4.23 | -3.60 | 0.0012 | -1.3168 | |||
| CNOB / ConnectOne Bancorp, Inc. | 0.17 | 4.21 | 0.0012 | 0.0012 | |||||
| LGND / Ligand Pharmaceuticals Incorporated | 0.06 | 4.60 | 4.16 | -18.87 | 0.0012 | -1.5403 | |||
| COLL / Collegium Pharmaceutical, Inc. | 0.18 | 0.20 | 4.16 | 45.08 | 0.0012 | -0.8592 | |||
| GPRE / Green Plains Inc. | 0.14 | -7.97 | 4.15 | -3.47 | 0.0012 | -1.2898 | |||
| CSTL / Castle Biosciences, Inc. | 0.17 | -9.77 | 4.01 | -18.56 | 1.1832 | -0.2946 | |||
| ISEE / IVERIC bio Inc | 0.19 | 34.02 | 4.00 | 59.94 | 0.0012 | -0.7496 | |||
| LBAI / Lakeland Bancorp, Inc. | 0.22 | 3.85 | 0.0011 | 0.0011 | |||||
| SLCA / U.S. Silica Holdings, Inc. | 0.30 | 15.67 | 3.80 | 32.01 | 0.0011 | -0.8641 | |||
| OSBC / Old Second Bancorp, Inc. | 0.23 | 0.26 | 3.73 | 23.20 | 1.1027 | 0.1924 | |||
| INVA / Innoviva, Inc. | 0.28 | -7.87 | 3.73 | 5.16 | 0.0011 | -1.0649 | |||
| DCO / Ducommun Incorporated | 0.07 | 0.24 | 3.59 | 26.28 | 0.0011 | -0.8519 | |||
| ADUS / Addus HomeCare Corporation | 0.04 | -29.75 | 3.57 | -26.63 | 0.0011 | -1.4609 | |||
| REX / REX American Resources Corporation | 0.11 | -7.29 | 3.53 | 5.79 | 0.0010 | -1.0012 | |||
| UVSP / Univest Financial Corporation | 0.13 | 0.24 | 3.51 | 11.56 | 0.0010 | -0.9450 | |||
| IRWD / Ironwood Pharmaceuticals, Inc. | 0.28 | -8.89 | 3.43 | 8.93 | 0.0010 | -0.9439 | |||
| GNTY / Guaranty Bancshares, Inc. | 0.10 | 0.19 | 3.39 | 0.33 | 0.0010 | -1.0130 | |||
| SYBT / Stock Yards Bancorp, Inc. | 0.05 | -5.87 | 3.38 | -10.08 | 0.0010 | -1.1290 | |||
| SHBI / Shore Bancshares, Inc. | 0.18 | 0.22 | 3.22 | 0.85 | 0.0010 | -0.9590 | |||
| UFCS / United Fire Group, Inc. | 0.11 | 0.28 | 3.13 | -4.52 | 0.0009 | -0.9824 | |||
| BDC / Belden Inc. | 0.04 | 32.87 | 3.04 | 59.12 | 0.0009 | -0.5723 | |||
| BC / Brunswick Corporation | 0.04 | 3.00 | 0.0009 | 0.0009 | |||||
| OPY / Oppenheimer Holdings Inc. | 0.07 | 0.72 | 2.99 | 37.60 | 0.0009 | -0.6520 | |||
| PLYM / Plymouth Industrial REIT, Inc. | 0.16 | 0.13 | 2.99 | 14.23 | 0.0009 | -0.7848 | |||
| MCFT / MasterCraft Boat Holdings, Inc. | 0.11 | -13.19 | 2.95 | 19.14 | 0.0009 | -0.7433 | |||
| SRI / Stoneridge, Inc. | 0.13 | 0.15 | 2.87 | 27.37 | 0.0008 | -0.6763 | |||
| AMNB / American National Bankshares Inc. | 0.08 | 0.09 | 2.82 | 15.70 | 0.0008 | -0.7322 | |||
| AVD / American Vanguard Corporation | 0.13 | 21.02 | 2.80 | 40.50 | 0.0008 | -0.5985 | |||
| SF / Stifel Financial Corp. | 0.05 | -17.51 | 2.80 | -7.25 | 0.0008 | -0.9065 | |||
| GRBK / Green Brick Partners, Inc. | 0.11 | 2.66 | 0.0008 | 0.0008 | |||||
| IIIV / i3 Verticals, Inc. | 0.11 | -23.19 | 2.61 | -6.66 | 0.0008 | -0.8381 | |||
| IRT / Independence Realty Trust, Inc. | 0.15 | -17.58 | 2.58 | -16.98 | 0.0008 | -0.9336 | |||
| BBWI / Bath & Body Works, Inc. | 0.06 | 2.51 | 0.0007 | 0.0007 | |||||
| BKH / Black Hills Corporation | 0.04 | 17.70 | 2.51 | 22.18 | 0.0007 | -0.6170 | |||
| EVC / Entravision Communications Corporation | 0.52 | 0.22 | 2.51 | 21.18 | 0.0007 | -0.6206 | |||
| SFST / Southern First Bancshares, Inc. | 0.05 | 58.15 | 2.50 | 73.70 | 0.0007 | -0.4322 | |||
| BAND / Bandwidth Inc. | 0.11 | 33.85 | 2.50 | 158.12 | 0.0007 | -0.2898 | |||
| PLYA / Playa Hotels & Resorts N.V. | 0.38 | -37.63 | 2.49 | -30.02 | 0.0007 | -1.0691 | |||
| NBN / Northeast Bank | 0.06 | 12.90 | 2.49 | 29.61 | 0.0007 | -0.5755 | |||
| WTFC / Wintrust Financial Corporation | 0.03 | -29.62 | 2.49 | -27.08 | 0.0007 | -1.0232 | |||
| MTH / Meritage Homes Corporation | 0.03 | 2.47 | 0.0007 | 0.0007 | |||||
| BLFS / BioLife Solutions, Inc. | 0.14 | 0.28 | 2.47 | -19.77 | 0.0007 | -0.9246 | |||
| QCRH / QCR Holdings, Inc. | 0.05 | 59.48 | 2.44 | 55.32 | 0.0007 | -0.4707 | |||
| ACRE / Ares Commercial Real Estate Corporation | 0.24 | 0.22 | 2.43 | -1.34 | 0.0007 | -0.7405 | |||
| AMRC / Ameresco, Inc. | 0.04 | -10.61 | 2.43 | -23.19 | 0.0007 | -0.9502 | |||
| LPX / Louisiana-Pacific Corporation | 0.04 | 2.40 | 0.0007 | 0.0007 | |||||
| IDA / IDACORP, Inc. | 0.02 | -17.58 | 2.40 | -10.24 | 0.0007 | -0.8036 | |||
| VLY / Valley National Bancorp | 0.21 | 2.40 | 0.0007 | 0.0007 | |||||
| UTI / Universal Technical Institute, Inc. | 0.36 | -21.24 | 2.40 | -2.72 | 0.0007 | -0.7402 | |||
| CRNX / Crinetics Pharmaceuticals, Inc. | 0.13 | -1.44 | 2.36 | -8.17 | 0.0007 | -0.7714 | |||
| NREF / NexPoint Real Estate Finance, Inc. | 0.15 | 0.73 | 2.34 | 6.79 | 0.0007 | -0.6588 | |||
| PMVP / PMV Pharmaceuticals, Inc. | 0.26 | 25.23 | 2.29 | -8.43 | 0.0007 | -0.7513 | |||
| BBSI / Barrett Business Services, Inc. | 0.02 | -27.69 | 2.23 | -13.55 | 0.0007 | -0.7754 | |||
| FRST / Primis Financial Corp. | 0.19 | 0.73 | 2.23 | -1.63 | 0.0007 | -0.6801 | |||
| RCKT / Rocket Pharmaceuticals, Inc. | 0.11 | 31.11 | 2.23 | 60.72 | 0.0007 | -0.4155 | |||
| ESTE / Earthstone Energy Inc - Class A | 0.15 | 2.19 | 0.0006 | 0.0006 | |||||
| PRTA / Prothena Corporation plc | 0.04 | 6.85 | 2.15 | 6.13 | 0.0006 | -0.6072 | |||
| GXO / GXO Logistics, Inc. | 0.05 | 2.14 | 0.0006 | 0.0006 | |||||
| EBTC / Enterprise Bancorp, Inc. | 0.06 | 0.00 | 2.12 | 18.02 | 0.0006 | -0.5396 | |||
| TTI / TETRA Technologies, Inc. | 0.61 | -8.17 | 2.12 | -11.53 | 0.0006 | -0.7186 | |||
| PERI / Perion Network Ltd. | 0.08 | 0.74 | 2.10 | 32.05 | 0.0006 | -0.4765 | |||
| CLDT / Chatham Lodging Trust | 0.17 | -36.67 | 2.09 | -21.30 | 0.0006 | -0.7961 | |||
| CATC / Cambridge Bancorp | 0.03 | 0.10 | 2.09 | 4.25 | 0.0006 | -0.6009 | |||
| LIND / Lindblad Expeditions Holdings, Inc. | 0.27 | 41.84 | 2.08 | 61.54 | 0.0006 | -0.3861 | |||
| EVBN / Evans Bancorp, Inc. | 0.05 | -12.19 | 2.04 | -10.43 | 0.0006 | -0.6847 | |||
| FRME / First Merchants Corporation | 0.05 | 2.04 | 0.0006 | 0.0006 | |||||
| CLDX / Celldex Therapeutics, Inc. | 0.05 | 2.03 | 0.5986 | 0.5986 | |||||
| SSB / SouthState Corporation | 0.03 | -13.42 | 2.02 | -16.47 | 0.0006 | -0.7274 | |||
| SPNE / SeaSpine Holdings Corp | 0.24 | 0.73 | 2.02 | 48.05 | 0.0006 | -0.4083 | |||
| ATNI / ATN International, Inc. | 0.04 | 0.23 | 2.00 | 17.72 | 0.0006 | -0.5099 | |||
| OI / O-I Glass, Inc. | 0.12 | 80.29 | 1.99 | 130.74 | 0.0006 | -0.2584 | |||
| BOOT / Boot Barn Holdings, Inc. | 0.03 | 1.99 | 0.0006 | 0.0006 | |||||
| PVH / PVH Corp. | 0.03 | 1.98 | 0.0006 | 0.0006 | |||||
| AEO / American Eagle Outfitters, Inc. | 0.14 | 1.97 | 0.0006 | 0.0006 | |||||
| PCYO / Pure Cycle Corporation | 0.19 | 0.74 | 1.96 | 26.42 | 0.0006 | -0.4657 | |||
| HWC / Hancock Whitney Corporation | 0.04 | -37.88 | 1.86 | -34.40 | 0.0006 | -0.8527 | |||
| CPRI / Capri Holdings Limited | 0.03 | -20.28 | 1.84 | 18.90 | 0.0005 | -0.4651 | |||
| KIDS / OrthoPediatrics Corp. | 0.05 | -49.22 | 1.83 | -56.28 | 0.0005 | -1.2598 | |||
| TNET / TriNet Group, Inc. | 0.03 | -39.79 | 1.83 | -42.67 | 0.0005 | -0.9570 | |||
| BCO / The Brink's Company | 0.03 | -5.75 | 1.82 | 4.47 | 0.0005 | -0.5240 | |||
| BRY / Berry Corporation | 0.22 | 0.01 | 1.79 | 6.62 | 0.0005 | -0.5030 | |||
| ERII / Energy Recovery, Inc. | 0.09 | -0.09 | 1.77 | -5.84 | 0.0005 | -0.5655 | |||
| FIVN / Five9, Inc. | 0.03 | 1.73 | 0.0005 | 0.0005 | |||||
| HBIO / Harvard Bioscience, Inc. | 0.61 | -23.39 | 1.70 | -17.11 | 0.0005 | -0.6157 | |||
| TUSK / Mammoth Energy Services, Inc. | 0.20 | 1.70 | 0.5006 | 0.5006 | |||||
| SCSC / ScanSource, Inc. | 0.06 | 0.72 | 1.67 | 11.42 | 0.0005 | -0.4493 | |||
| WNS / WNS (Holdings) Limited | 0.02 | -15.90 | 1.65 | -17.83 | 0.0005 | -0.6028 | |||
| AGIO / Agios Pharmaceuticals, Inc. | 0.06 | 0.74 | 1.64 | 0.00 | 0.0005 | -0.4907 | |||
| RGNX / REGENXBIO Inc. | 0.07 | -27.59 | 1.63 | -37.87 | 0.0005 | -0.7897 | |||
| HSKA / Heska Corp. (Restricted Voting) | 0.03 | -41.50 | 1.61 | -50.14 | 0.0005 | -0.9690 | |||
| CNTY / Century Casinos, Inc. | 0.23 | -0.08 | 1.60 | 7.05 | 0.0005 | -0.4472 | |||
| SM / SM Energy Company | 0.05 | 125.39 | 1.59 | 108.78 | 0.0005 | -0.2288 | |||
| FL / Foot Locker, Inc. | 0.04 | 1.55 | 0.0005 | 0.0005 | |||||
| AQUA / Evoqua Water Technologies Corp | 0.04 | -17.49 | 1.55 | -1.21 | 0.0005 | -0.4694 | |||
| DXLG / Destination XL Group, Inc. | 0.22 | 1.01 | 1.49 | 4.26 | 0.4410 | -0.0883 | |||
| GPK / Graphic Packaging Holding Company | 0.07 | -17.60 | 1.47 | -7.10 | 0.0004 | -0.4737 | |||
| NVMI / Nova Ltd. | 0.02 | 1.45 | 0.4295 | 0.4295 | |||||
| AJRD / Aerojet Rocketdyne Holdings Inc | 0.03 | 1.45 | 0.0004 | 0.0004 | |||||
| FIBK / First Interstate BancSystem, Inc. | 0.04 | -17.58 | 1.40 | -21.07 | 0.0004 | -0.5329 | |||
| NPO / Enpro Inc. | 0.01 | -15.61 | 1.39 | 7.91 | 0.0004 | -0.3872 | |||
| VERX / Vertex, Inc. | 0.10 | 1.38 | 0.4082 | 0.4082 | |||||
| ATCX / Atlas Technical Consultants Inc - Class A | 0.27 | -0.09 | 1.37 | -22.65 | 0.0004 | -0.5329 | |||
| VRRM / Verra Mobility Corporation | 0.10 | -46.12 | 1.35 | -51.55 | 0.0004 | -0.8354 | |||
| DVAX / Dynavax Technologies Corporation | 0.12 | 1.30 | 0.3830 | 0.3830 | |||||
| UPLD / Upland Software, Inc. | 0.18 | 0.73 | 1.29 | -11.73 | 0.0004 | -0.4377 | |||
| RLAY / Relay Therapeutics, Inc. | 0.09 | 100.04 | 1.27 | 33.51 | 0.0004 | -0.2856 | |||
| RCUS / Arcus Biosciences, Inc. | 0.06 | 0.71 | 1.22 | -20.47 | 0.0004 | -0.4590 | |||
| OABI / OmniAb, Inc. | 0.32 | 1.13 | 0.3351 | 0.3351 | |||||
| OFG / OFG Bancorp | 0.04 | -21.88 | 1.13 | -14.35 | 0.0003 | -0.3974 | |||
| PDCE / PDC Energy Inc | 0.02 | 4.87 | 1.05 | 15.12 | 0.0003 | -0.2740 | |||
| BHB / Bar Harbor Bankshares | 0.03 | 1.05 | 0.3103 | 0.3103 | |||||
| CROX / Crocs, Inc. | 0.01 | -83.03 | 0.84 | -73.20 | 0.0002 | -0.9359 | |||
| ORGO / Organogenesis Holdings Inc. | 0.30 | 0.73 | 0.82 | -16.48 | 0.0002 | -0.2933 | |||
| ADC / Agree Realty Corporation | 0.01 | -72.87 | 0.69 | -71.55 | 0.0002 | -0.7242 | |||
| PSNL / Personalis, Inc. | 0.32 | 0.73 | 0.64 | -32.91 | 0.0002 | -0.2846 | |||
| HCC / Warrior Met Coal, Inc. | 0.00 | 0.58 | 0.0002 | 0.0002 | |||||
| DECK / Deckers Outdoor Corporation | 0.00 | -83.07 | 0.52 | -78.41 | 0.0002 | -0.7236 | |||
| CRL / Charles River Laboratories International, Inc. | 0.00 | 0.40 | 0.0001 | 0.0001 | |||||
| CDMO / Avid Bioservices, Inc. | 0.00 | -100.00 | 0.00 | -100.00 | -1.5301 | ||||
| JNCE / Jounce Therapeutics Inc | 0.00 | -100.00 | 0.00 | -100.00 | -0.1604 | ||||
| AVLR / Avalara Inc | 0.00 | -100.00 | 0.00 | -100.00 | -0.1202 | ||||
| GMRE / Global Medical REIT Inc. | 0.00 | -100.00 | 0.00 | -100.00 | -0.5570 | ||||
| MANH / Manhattan Associates, Inc. | 0.00 | -100.00 | 0.00 | -100.00 | -0.6234 | ||||
| RUN / Sunrun Inc. | 0.00 | -100.00 | 0.00 | -100.00 | -0.4392 | ||||
| UIHC / American Coastal Insurance Corp | 0.00 | -100.00 | 0.00 | -100.00 | -0.5270 | ||||
| RADA / Rada Electronic Industries | 0.00 | -100.00 | 0.00 | -100.00 | -0.7893 | ||||
| CR / Crane Company | 0.00 | -100.00 | 0.00 | -100.00 | -0.4023 | ||||
| AGS / AGS LLC | 0.00 | -100.00 | 0.00 | -100.00 | -0.6207 | ||||
| XHR / Xenia Hotels & Resorts, Inc. | 0.00 | -100.00 | 0.00 | -100.00 | -0.3134 | ||||
| DRVN / Driven Brands Holdings Inc. | 0.00 | -100.00 | 0.00 | -100.00 | -0.7929 | ||||
| WBS / Webster Financial Corporation | 0.00 | -100.00 | 0.00 | -100.00 | -0.9488 | ||||
| SR / Spire Inc. | 0.00 | -100.00 | 0.00 | -100.00 | -1.0777 | ||||
| PNFP / Pinnacle Financial Partners, Inc. | 0.00 | -100.00 | 0.00 | -100.00 | -0.8454 | ||||
| CFR / Cullen/Frost Bankers, Inc. | 0.00 | -100.00 | 0.00 | -100.00 | -0.5080 | ||||
| BG / Bunge Global SA | 0.00 | -100.00 | 0.00 | -100.00 | -0.1034 | ||||
| DBI / Designer Brands Inc. | 0.00 | -100.00 | 0.00 | -100.00 | -0.9987 | ||||
| WRB / W. R. Berkley Corporation | 0.00 | -100.00 | 0.00 | -100.00 | -0.1142 | ||||
| FCN / FTI Consulting, Inc. | 0.00 | -100.00 | 0.00 | -100.00 | -0.8142 | ||||
| RHP / Ryman Hospitality Properties, Inc. | 0.00 | -100.00 | 0.00 | -100.00 | -0.3215 | ||||
| BPOP / Popular, Inc. | 0.00 | -100.00 | 0.00 | -100.00 | -0.4783 | ||||
| JEF / Jefferies Financial Group Inc. | 0.00 | -100.00 | 0.00 | -100.00 | -0.6919 | ||||
| NOVA / Sunnova Energy International Inc. | 0.00 | -100.00 | 0.00 | -100.00 | -0.5522 | ||||
| IMGO / Imago BioSciences Inc | 0.00 | -100.00 | 0.00 | -100.00 | -0.6733 | ||||
| PFGC / Performance Food Group Company | 0.00 | -100.00 | 0.00 | -100.00 | -0.4131 | ||||
| DAR / Darling Ingredients Inc. | 0.00 | -100.00 | 0.00 | -100.00 | -0.0745 | ||||
| EBC / Eastern Bankshares, Inc. | 0.00 | -100.00 | 0.00 | -100.00 | -1.0500 | ||||
| FNKO / Funko, Inc. | 0.00 | -100.00 | 0.00 | -100.00 | -0.5955 | ||||
| JBSS / John B. Sanfilippo & Son, Inc. | 0.00 | -100.00 | 0.00 | -100.00 | -0.7757 | ||||
| IMGN / ImmunoGen, Inc. | 0.00 | -100.00 | 0.00 | -100.00 | -0.9692 | ||||
| CAL / Caleres, Inc. | 0.00 | -100.00 | 0.00 | -100.00 | -0.4996 |