Mga Batayang Estadistika
| Profil Orang Dalam | Mubadala Investment Co PJSC |
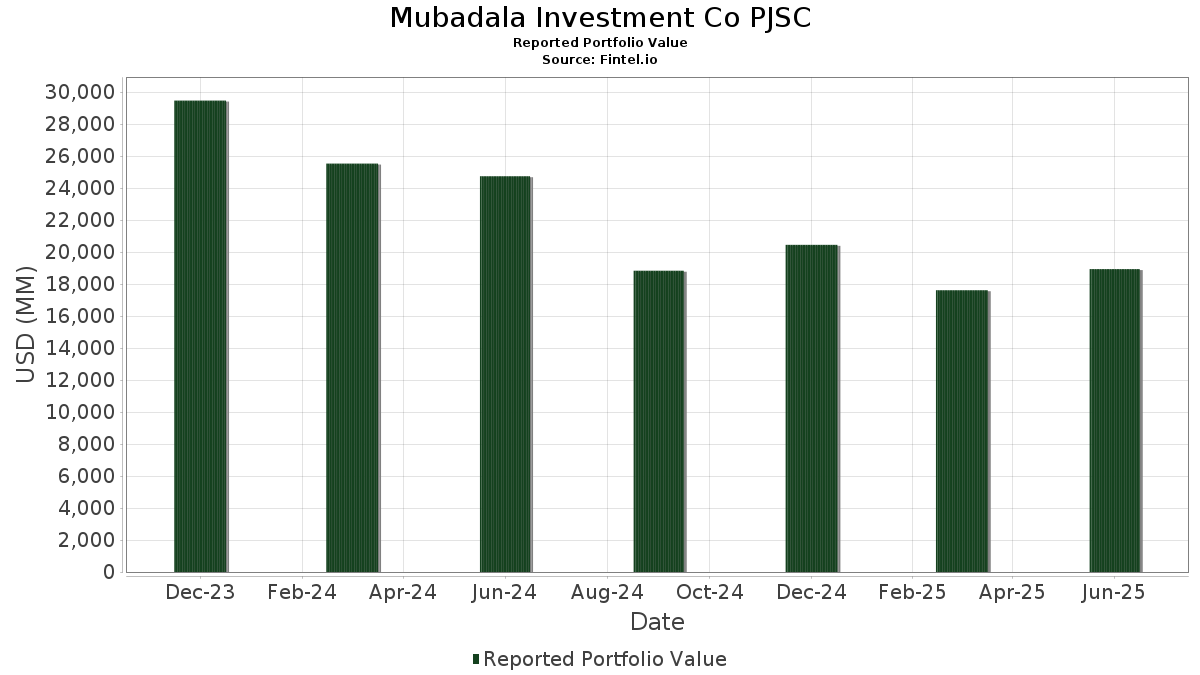
| Nilai Portofolio | $ 18,933,013,675 |
| Posisi Saat Ini | 54 |
Kepemilikan Terbaru, Kinerja, AUM (dari 13F, 13D)
Mubadala Investment Co PJSC telah mengungkapkan total kepemilikan 54 dalam pengajuan SEC terbaru mereka. Nilai portofolio terbaru dihitung sebesar $ 18,933,013,675 USD. Aset yang Dikelola (AUM) sebenarnya adalah nilai ini ditambah kas (yang tidak diungkapkan). Aset-aset utama Mubadala Investment Co PJSC adalah GLOBALFOUNDRIES Inc. (US:GFS) , iShares Bitcoin Trust ETF (US:IBIT) , Blue Owl Technology Finance Corp. (US:OTF) , Arm Holdings plc - Depositary Receipt (Common Stock) (US:ARM) , and NextDecade Corporation (US:NEXT) . Posisi baru Mubadala Investment Co PJSC meliputi: Blue Owl Technology Finance Corp. (US:OTF) , Edison International (US:EIX) , The Walt Disney Company (US:DIS) , Aptiv PLC (US:APTV) , and Corning Incorporated (US:GLW) . Industri unggulan Mubadala Investment Co PJSC adalah "Electronic And Other Electrical Equipment And Components, Except Computer Equipment" (sic 36) .
Peningkatan Tertinggi Kuartal Ini
Kami menggunakan perubahan dalam alokasi portofolio karena ini adalah metrik yang paling bermakna. Perubahan dapat disebabkan oleh perdagangan atau perubahan harga saham.
| Keamanan | Saham (MM) |
Nilai (Juta Dolar AS) |
Portfolio % | ΔPorsyento ng Portfolio |
|---|---|---|---|---|
| 29.13 | 444.24 | 2.3464 | 2.3464 | |
| 8.73 | 534.18 | 2.8214 | 0.5020 | |
| 1.50 | 242.93 | 1.2831 | 0.3724 | |
| 15.75 | 105.99 | 0.5598 | 0.1449 | |
| 0.54 | 29.86 | 0.1577 | 0.0930 | |
| 14.21 | 126.58 | 0.6686 | 0.0410 | |
| 0.14 | 7.14 | 0.0377 | 0.0377 | |
| 0.04 | 4.88 | 0.0258 | 0.0258 | |
| 0.06 | 4.37 | 0.0231 | 0.0231 | |
| 0.08 | 4.27 | 0.0225 | 0.0225 |
Penurunan Tertinggi Kuartal Ini
Kami menggunakan perubahan dalam alokasi portofolio karena ini adalah metrik yang paling bermakna. Perubahan dapat disebabkan oleh perdagangan atau perubahan harga saham.
| Keamanan | Saham (MM) |
Nilai (Juta Dolar AS) |
Portfolio % | ΔPorsyento ng Portfolio |
|---|---|---|---|---|
| 450.39 | 17,204.81 | 90.8720 | -3.5152 | |
| 12.99 | 65.71 | 0.3471 | -0.0430 | |
| 0.06 | 2.99 | 0.0158 | -0.0081 | |
| 0.02 | 3.46 | 0.0183 | -0.0077 | |
| 0.06 | 3.41 | 0.0180 | -0.0069 | |
| 0.05 | 2.01 | 0.0106 | -0.0043 | |
| 0.02 | 1.96 | 0.0103 | -0.0031 | |
| 0.03 | 4.23 | 0.0224 | -0.0022 | |
| 0.02 | 3.72 | 0.0196 | -0.0014 | |
| 0.01 | 4.24 | 0.0224 | -0.0012 |
Pengajuan 13D/G
Ini adalah daftar pengajuan 13D dan 13G yang dibuat dalam setahun terakhir (jika ada). Klik ikon tautan untuk melihat riwayat transaksi lengkap. Baris berwarna hijau menunjukkan posisi baru. Baris berwarna merah menunjukkan posisi yang sudah ditutup.
| Tanggal File | Formulir | Keamanan | Sebelumnya Saham |
Saat ini Saham |
ΔPersentase Saham | % Kepemilikan |
% ΔKepemilikan | |
|---|---|---|---|---|---|---|---|---|
| 2025-08-14 | OTF / Blue Owl Technology Finance Corp. | 29,130,491 | 6.30 | |||||
| 2025-03-27 | EDR / Endeavor Group Holdings, Inc. | 0 | 0.00 | |||||
| 2025-03-27 | / () | 0 | 0.00 | |||||
| 2025-02-13 | CERT / Certara, Inc. | 9,615,384 | 0 | -100.00 | 0.00 | -100.00 | ||
| 2024-11-06 | GFS / GLOBALFOUNDRIES Inc. | 469,501,994 | 450,387,613 | -4.07 | 81.50 | -7.70 | ||
| 2024-10-10 | EQX / Equinox Gold Corp. | 44,761,905 | 20,000,000 | -55.32 | 4.20 | -55.79 |
Pengajuan 13F dan Dana
Formulir ini diajukan pada 2025-08-14 untuk periode pelaporan 2025-06-30. Klik ikon tautan untuk melihat riwayat transaksi selengkapnya.
Tingkatkan ke versi premium untuk membuka data premium dan ekspor ke Excel. ![]() .
.
| Keamanan | Ketik | Harga Saham Rata-rata | Saham (MM) |
ΔSaham (%) |
ΔSaham (%) |
Nilai ($MM) |
Portpolyo (%) |
ΔPortofolio (%) |
|
|---|---|---|---|---|---|---|---|---|---|
| GFS / GLOBALFOUNDRIES Inc. | 450.39 | 0.00 | 17,204.81 | 3.49 | 90.8720 | -3.5152 | |||
| IBIT / iShares Bitcoin Trust ETF | 8.73 | 0.00 | 534.18 | 30.76 | 2.8214 | 0.5020 | |||
| OTF / Blue Owl Technology Finance Corp. | 29.13 | 444.24 | 2.3464 | 2.3464 | |||||
| ARM / Arm Holdings plc - Depositary Receipt (Common Stock) | 1.50 | 0.00 | 242.93 | 51.46 | 1.2831 | 0.3724 | |||
| NEXT / NextDecade Corporation | 14.21 | 0.00 | 126.58 | 14.52 | 0.6686 | 0.0410 | |||
| ARMN / Aris Mining Corporation | 15.75 | 0.00 | 105.99 | 45.04 | 0.5598 | 0.1449 | |||
| RXRX / Recursion Pharmaceuticals, Inc. | 12.99 | 0.00 | 65.71 | -4.35 | 0.3471 | -0.0430 | |||
| NBIS / Nebius Group N.V. | 0.54 | 0.00 | 29.86 | 162.10 | 0.1577 | 0.0930 | |||
| EVO / Evotec SE - Depositary Receipt (Common Stock) | 4.60 | 0.00 | 19.31 | 25.75 | 0.1020 | 0.0148 | |||
| VICI / VICI Properties Inc. | 0.25 | 86.85 | 8.20 | 86.73 | 0.0433 | 0.0184 | |||
| GILD / Gilead Sciences, Inc. | 0.07 | 69.09 | 8.01 | 67.34 | 0.0423 | 0.0151 | |||
| EIX / Edison International | 0.14 | 7.14 | 0.0377 | 0.0377 | |||||
| CCL / Carnival Corporation & plc | 0.20 | 24.63 | 5.58 | 79.46 | 0.0295 | 0.0118 | |||
| NTRS / Northern Trust Corporation | 0.04 | 2.38 | 4.98 | 31.58 | 0.0263 | 0.0048 | |||
| DIS / The Walt Disney Company | 0.04 | 4.88 | 0.0258 | 0.0258 | |||||
| LDOS / Leidos Holdings, Inc. | 0.03 | 11.62 | 4.50 | 30.51 | 0.0238 | 0.0042 | |||
| APTV / Aptiv PLC | 0.06 | 4.37 | 0.0231 | 0.0231 | |||||
| GLW / Corning Incorporated | 0.08 | 4.27 | 0.0225 | 0.0225 | |||||
| CHTR / Charter Communications, Inc. | 0.01 | -8.20 | 4.24 | 1.85 | 0.0224 | -0.0012 | |||
| GEN / Gen Digital Inc. | 0.14 | 0.07 | 4.23 | 10.84 | 0.0224 | 0.0007 | |||
| RTX / RTX Corporation | 0.03 | -11.21 | 4.23 | -2.13 | 0.0224 | -0.0022 | |||
| TFC / Truist Financial Corporation | 0.09 | 4.01 | 0.0212 | 0.0212 | |||||
| IVZ / Invesco Ltd. | 0.25 | 7.17 | 4.00 | 11.43 | 0.0211 | 0.0007 | |||
| CVS / CVS Health Corporation | 0.06 | 3.91 | 0.0207 | 0.0207 | |||||
| EXPE / Expedia Group, Inc. | 0.02 | 8.07 | 3.87 | 8.46 | 0.0205 | 0.0002 | |||
| SPG / Simon Property Group, Inc. | 0.02 | 3.72 | 3.72 | 0.38 | 0.0196 | -0.0014 | |||
| UHS / Universal Health Services, Inc. | 0.02 | 3.70 | 0.0195 | 0.0195 | |||||
| FLNG / FLEX LNG Ltd. | 0.07 | 3.67 | 0.0194 | 0.0194 | |||||
| GL / Globe Life Inc. | 0.03 | 3.60 | 0.0190 | 0.0190 | |||||
| MRK / Merck & Co., Inc. | 0.04 | 3.53 | 0.0187 | 0.0187 | |||||
| ABBV / AbbVie Inc. | 0.02 | -14.57 | 3.46 | -24.32 | 0.0183 | -0.0077 | |||
| ELV / Elevance Health, Inc. | 0.01 | 3.46 | 0.0183 | 0.0183 | |||||
| CNC / Centene Corporation | 0.06 | 3.46 | 0.0183 | 0.0183 | |||||
| TSN / Tyson Foods, Inc. | 0.06 | -11.25 | 3.41 | -22.21 | 0.0180 | -0.0069 | |||
| BMY / Bristol-Myers Squibb Company | 0.06 | -6.43 | 2.99 | -29.00 | 0.0158 | -0.0081 | |||
| NXT / Nextracker Inc. | 0.05 | 2.96 | 0.0157 | 0.0157 | |||||
| OSK / Oshkosh Corporation | 0.02 | 2.83 | 0.0149 | 0.0149 | |||||
| GAP / The Gap, Inc. | 0.12 | 23.76 | 2.71 | 31.00 | 0.0143 | 0.0026 | |||
| EXEL / Exelixis, Inc. | 0.06 | -6.85 | 2.68 | 11.18 | 0.0142 | 0.0005 | |||
| TNL / Travel + Leisure Co. | 0.05 | 13.49 | 2.67 | 26.55 | 0.0141 | 0.0021 | |||
| HWC / Hancock Whitney Corporation | 0.05 | 2.64 | 0.0140 | 0.0140 | |||||
| AYI / Acuity Inc. | 0.01 | 19.15 | 2.57 | 35.00 | 0.0136 | 0.0028 | |||
| CRUS / Cirrus Logic, Inc. | 0.02 | 2.57 | 0.0136 | 0.0136 | |||||
| UBSI / United Bankshares, Inc. | 0.07 | 2.47 | 0.0130 | 0.0130 | |||||
| JLL / Jones Lang LaSalle Incorporated | 0.01 | -1.37 | 2.42 | 1.76 | 0.0128 | -0.0007 | |||
| LAMR / Lamar Advertising Company | 0.02 | 2.42 | 0.0128 | 0.0128 | |||||
| BBWI / Bath & Body Works, Inc. | 0.08 | 2.36 | 0.0125 | 0.0125 | |||||
| MMS / Maximus, Inc. | 0.03 | 2.23 | 0.0118 | 0.0118 | |||||
| JHG / Janus Henderson Group plc | 0.06 | 0.00 | 2.21 | 7.45 | 0.0117 | -0.0000 | |||
| ORI / Old Republic International Corporation | 0.06 | 2.17 | 0.0114 | 0.0114 | |||||
| SR / Spire Inc. | 0.03 | 2.04 | 0.0108 | 0.0108 | |||||
| G / Genpact Limited | 0.05 | -12.46 | 2.01 | -23.52 | 0.0106 | -0.0043 | |||
| JAZZ / Jazz Pharmaceuticals plc | 0.02 | -2.95 | 1.96 | -17.06 | 0.0103 | -0.0031 | |||
| GDEVW / GDEV Inc. - Equity Warrant | 2.22 | 0.00 | 0.03 | -44.23 | 0.0002 | -0.0001 | |||
| STT / State Street Corporation | 0.00 | -100.00 | 0.00 | 0.0000 | |||||
| STX / Seagate Technology Holdings plc | 0.00 | -100.00 | 0.00 | 0.0000 | |||||
| ALL / The Allstate Corporation | 0.00 | -100.00 | 0.00 | 0.0000 | |||||
| COLB / Columbia Banking System, Inc. | 0.00 | -100.00 | 0.00 | 0.0000 | |||||
| CMI / Cummins Inc. | 0.00 | -100.00 | 0.00 | 0.0000 | |||||
| VNT / Vontier Corporation | 0.00 | -100.00 | 0.00 | 0.0000 | |||||
| SYF / Synchrony Financial | 0.00 | -100.00 | 0.00 | 0.0000 | |||||
| LHX / L3Harris Technologies, Inc. | 0.00 | -100.00 | 0.00 | 0.0000 | |||||
| ENS / EnerSys | 0.00 | -100.00 | 0.00 | 0.0000 | |||||
| CMCSA / Comcast Corporation | 0.00 | -100.00 | 0.00 | 0.0000 | |||||
| HPE / Hewlett Packard Enterprise Company | 0.00 | -100.00 | 0.00 | 0.0000 | |||||
| FLS / Flowserve Corporation | 0.00 | -100.00 | 0.00 | 0.0000 | |||||
| GLPI / Gaming and Leisure Properties, Inc. | 0.00 | -100.00 | 0.00 | 0.0000 | |||||
| UTHR / United Therapeutics Corporation | 0.00 | -100.00 | 0.00 | 0.0000 | |||||
| VAC / Marriott Vacations Worldwide Corporation | 0.00 | -100.00 | 0.00 | 0.0000 | |||||
| ALLE / Allegion plc | 0.00 | -100.00 | 0.00 | 0.0000 | |||||
| COKE / Coca-Cola Consolidated, Inc. | 0.00 | -100.00 | 0.00 | 0.0000 | |||||
| WU / The Western Union Company | 0.00 | -100.00 | 0.00 | 0.0000 | |||||
| EPAM / EPAM Systems, Inc. | 0.00 | -100.00 | 0.00 | 0.0000 | |||||
| UNM / Unum Group | 0.00 | -100.00 | 0.00 | 0.0000 | |||||
| TPR / Tapestry, Inc. | 0.00 | -100.00 | 0.00 | 0.0000 | |||||
| FNF / Fidelity National Financial, Inc. | 0.00 | -100.00 | 0.00 | 0.0000 | |||||
| JWN / Nordstrom, Inc. | 0.00 | -100.00 | 0.00 | 0.0000 |