Mga Batayang Estadistika
| Profil Orang Dalam | Nierenberg Investment Management Company, Inc. |
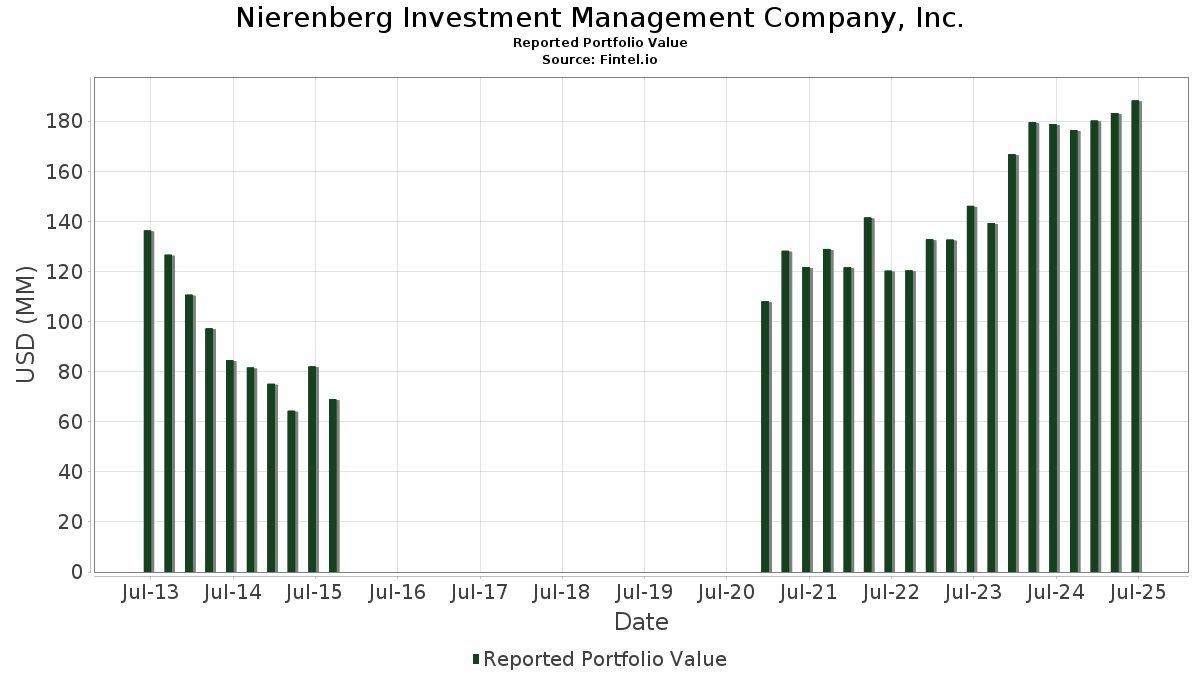
| Nilai Portofolio | $ 188,225,815 |
| Posisi Saat Ini | 49 |
Kepemilikan Terbaru, Kinerja, AUM (dari 13F, 13D)
Nierenberg Investment Management Company, Inc. telah mengungkapkan total kepemilikan 49 dalam pengajuan SEC terbaru mereka. Nilai portofolio terbaru dihitung sebesar $ 188,225,815 USD. Aset yang Dikelola (AUM) sebenarnya adalah nilai ini ditambah kas (yang tidak diungkapkan). Aset-aset utama Nierenberg Investment Management Company, Inc. adalah Mr. Cooper Group Inc. (US:COOP) , Potbelly Corporation (US:PBPB) , EQT Corporation (US:EQT) , Criteo S.A. - Depositary Receipt (Common Stock) (US:CRTO) , and Riverview Bancorp, Inc. (US:RVSB) . Posisi baru Nierenberg Investment Management Company, Inc. meliputi: Lyft, Inc. (IT:1LYFT) , . Industri unggulan Nierenberg Investment Management Company, Inc. adalah "Industrial And Commercial Machinery And Computer Equipment" (sic 35) , "Electronic And Other Electrical Equipment And Components, Except Computer Equipment" (sic 36) , and "Wholesale Trade-durable Goods" (sic 50) .
Peningkatan Tertinggi Kuartal Ini
Kami menggunakan perubahan dalam alokasi portofolio karena ini adalah metrik yang paling bermakna. Perubahan dapat disebabkan oleh perdagangan atau perubahan harga saham.
| Keamanan | Saham (MM) |
Nilai (Juta Dolar AS) |
Portfolio % | ΔPorsyento ng Portfolio |
|---|---|---|---|---|
| 2.98 | 36.51 | 19.3979 | 3.9287 | |
| 0.54 | 12.84 | 6.8192 | 1.6691 | |
| 0.34 | 3.66 | 1.9421 | 1.5849 | |
| 0.30 | 44.17 | 23.4687 | 1.4526 | |
| 0.01 | 4.87 | 2.5864 | 1.0536 | |
| 0.54 | 31.30 | 16.6289 | 0.9795 | |
| 1.94 | 10.66 | 5.6622 | 0.6268 | |
| 0.02 | 0.88 | 0.4667 | 0.4667 | |
| 0.04 | 0.67 | 0.3563 | 0.3563 | |
| 0.01 | 1.65 | 0.8745 | 0.3133 |
Penurunan Tertinggi Kuartal Ini
Kami menggunakan perubahan dalam alokasi portofolio karena ini adalah metrik yang paling bermakna. Perubahan dapat disebabkan oleh perdagangan atau perubahan harga saham.
| Keamanan | Saham (MM) |
Nilai (Juta Dolar AS) |
Portfolio % | ΔPorsyento ng Portfolio |
|---|---|---|---|---|
| 0.05 | 2.67 | 1.4175 | -0.5404 | |
| 0.34 | 3.08 | 1.6351 | -0.4355 | |
| 0.02 | 0.12 | 0.0620 | -0.2890 | |
| 0.01 | 0.03 | 0.0151 | -0.2594 | |
| 0.02 | 1.82 | 0.9664 | -0.2216 | |
| 0.12 | 0.78 | 0.4126 | -0.1518 | |
| 0.05 | 2.57 | 1.3680 | -0.0921 | |
| 0.16 | 0.44 | 0.2355 | -0.0448 | |
| 0.06 | 1.75 | 0.9302 | -0.0443 | |
| 0.01 | 0.21 | 0.1101 | -0.0160 |
Pengajuan 13D/G
Ini adalah daftar pengajuan 13D dan 13G yang dibuat dalam setahun terakhir (jika ada). Klik ikon tautan untuk melihat riwayat transaksi lengkap. Baris berwarna hijau menunjukkan posisi baru. Baris berwarna merah menunjukkan posisi yang sudah ditutup.
| Tanggal File | Formulir | Keamanan | Sebelumnya Saham |
Saat ini Saham |
ΔPersentase Saham | % Kepemilikan |
% ΔKepemilikan | |
|---|---|---|---|---|---|---|---|---|
| 2025-07-15 | RVSB / Riverview Bancorp, Inc. | 1,884,292 | 2,095,910 | 11.23 | 9.99 | 11.00 |
Pengajuan 13F dan Dana
Formulir ini diajukan pada 2025-08-11 untuk periode pelaporan 2025-06-30. Klik ikon tautan untuk melihat riwayat transaksi selengkapnya.
Tingkatkan ke versi premium untuk membuka data premium dan ekspor ke Excel. ![]() .
.
| Keamanan | Ketik | Harga Saham Rata-rata | Saham (MM) |
ΔSaham (%) |
ΔSaham (%) |
Nilai ($MM) |
Portpolyo (%) |
ΔPortofolio (%) |
|
|---|---|---|---|---|---|---|---|---|---|
| COOP / Mr. Cooper Group Inc. | 0.30 | -12.23 | 44.17 | 9.50 | 23.4687 | 1.4526 | |||
| PBPB / Potbelly Corporation | 2.98 | 0.00 | 36.51 | 28.81 | 19.3979 | 3.9287 | |||
| EQT / EQT Corporation | 0.54 | 0.00 | 31.30 | 9.15 | 16.6289 | 0.9795 | |||
| CRTO / Criteo S.A. - Depositary Receipt (Common Stock) | 0.54 | 101.02 | 12.84 | 36.02 | 6.8192 | 1.6691 | |||
| RVSB / Riverview Bancorp, Inc. | 1.94 | 18.66 | 10.66 | 15.51 | 5.6622 | 0.6268 | |||
| GEV / GE Vernova Inc. | Put | 0.01 | 0.00 | 4.87 | 73.36 | 2.5864 | 1.0536 | ||
| GDOT / Green Dot Corporation | 0.34 | 337.25 | 3.66 | 458.87 | 1.9421 | 1.5849 | |||
| QQQ / Invesco QQQ Trust, Series 1 | Put | 0.01 | 0.00 | 3.37 | 17.66 | 1.7877 | 0.2267 | ||
| ADTN / ADTRAN Holdings, Inc. | 0.34 | -21.14 | 3.08 | -18.90 | 1.6351 | -0.4355 | |||
| BKD / Brookdale Senior Living Inc. | 0.41 | 0.00 | 2.85 | 11.18 | 1.5165 | 0.1154 | |||
| CNXC / Concentrix Corporation | 0.05 | -21.71 | 2.67 | -25.62 | 1.4175 | -0.5404 | |||
| KBR / KBR, Inc. | 0.05 | 0.00 | 2.57 | -3.78 | 1.3680 | -0.0921 | |||
| TPC / Tutor Perini Corporation | 0.04 | -32.99 | 2.09 | 35.28 | 1.1104 | 0.2669 | |||
| ECVT / Ecovyst Inc. | 0.23 | 0.00 | 1.88 | 32.79 | 1.0005 | 0.2262 | |||
| EXE / Expand Energy Corporation | 0.02 | -20.46 | 1.82 | -16.41 | 0.9664 | -0.2216 | |||
| MTCH / Match Group, Inc. | 0.06 | -0.96 | 1.75 | -1.96 | 0.9302 | -0.0443 | |||
| NVDA / NVIDIA Corporation | Put | 0.01 | 0.00 | 1.71 | 45.81 | 0.9065 | 0.2677 | ||
| CEG / Constellation Energy Corporation | Put | 0.01 | 0.00 | 1.65 | 60.12 | 0.8745 | 0.3133 | ||
| EXE / Expand Energy Corporation | Call | 0.01 | 0.00 | 1.64 | 5.07 | 0.8698 | 0.0193 | ||
| DHC / Diversified Healthcare Trust | 0.46 | 0.00 | 1.63 | 49.18 | 0.8675 | 0.2701 | |||
| CLFD / Clearfield, Inc. | 0.03 | -14.81 | 1.50 | 24.52 | 0.7959 | 0.1388 | |||
| RRC / Range Resources Corporation | 0.03 | 0.00 | 1.20 | 1.86 | 0.6386 | -0.0055 | |||
| VRT / Vertiv Holdings Co | Put | 0.01 | 0.00 | 1.18 | 77.86 | 0.6276 | 0.2651 | ||
| HOPE / Hope Bancorp, Inc. | 0.10 | 0.00 | 1.07 | 2.50 | 0.5675 | -0.0013 | |||
| AVGO / Broadcom Inc. | Put | 0.00 | 0.00 | 0.88 | 64.86 | 0.4686 | 0.1762 | ||
| BFH / Bread Financial Holdings, Inc. | 0.02 | 0.88 | 0.4667 | 0.4667 | |||||
| WNC / Wabash National Corporation | 0.08 | 39.60 | 0.82 | 34.42 | 0.4380 | 0.1030 | |||
| SEB / Seaboard Corporation | 0.00 | 0.00 | 0.82 | 6.10 | 0.4347 | 0.0138 | |||
| HLX / Helix Energy Solutions Group, Inc. | 0.12 | 0.00 | 0.78 | -24.95 | 0.4126 | -0.1518 | |||
| PLPC / Preformed Line Products Company | 0.00 | 0.00 | 0.73 | 13.95 | 0.3867 | 0.0385 | |||
| 1LYFT / Lyft, Inc. | 0.04 | 0.67 | 0.3563 | 0.3563 | |||||
| OSK / Oshkosh Corporation | 0.01 | 0.00 | 0.65 | 20.74 | 0.3468 | 0.0516 | |||
| PLAB / Photronics, Inc. | 0.03 | 47.15 | 0.65 | 33.47 | 0.3434 | 0.0791 | |||
| OIS / Oil States International, Inc. | 0.11 | 0.00 | 0.60 | 4.01 | 0.3177 | 0.0041 | |||
| ANET / Arista Networks Inc | Put | 0.01 | 0.00 | 0.57 | 32.10 | 0.3044 | 0.0676 | ||
| ETN / Eaton Corporation plc | Put | 0.00 | 0.00 | 0.57 | 31.57 | 0.3035 | 0.0661 | ||
| ARHS / Arhaus, Inc. | 0.06 | 0.00 | 0.51 | -0.19 | 0.2732 | -0.0084 | |||
| BRY / Berry Corporation | Call | 0.16 | 0.00 | 0.44 | -13.65 | 0.2355 | -0.0448 | ||
| FLR / Fluor Corporation | 0.01 | 0.00 | 0.34 | 43.59 | 0.1785 | 0.0504 | |||
| DXC / DXC Technology Company | 0.01 | 0.00 | 0.21 | -10.39 | 0.1101 | -0.0160 | |||
| DHX / DHI Group, Inc. | 0.04 | 0.00 | 0.13 | 116.39 | 0.0703 | 0.0365 | |||
| GIFI / Gulf Island Fabrication, Inc. | 0.02 | -82.37 | 0.12 | -81.96 | 0.0620 | -0.2890 | |||
| SCYX / SCYNEXIS, Inc. | 0.08 | 0.00 | 0.05 | -29.58 | 0.0271 | -0.0122 | |||
| OSUR / OraSure Technologies, Inc. | 0.01 | 0.03 | 0.0184 | 0.0184 | |||||
| CTMX / CytomX Therapeutics, Inc. | 0.01 | 0.00 | 0.03 | 300.00 | 0.0151 | 0.0108 | |||
| NNBR / NN, Inc. | 0.01 | -93.91 | 0.03 | -94.42 | 0.0151 | -0.2594 | |||
| WTI / W&T Offshore, Inc. | 0.01 | 0.00 | 0.02 | 4.76 | 0.0119 | 0.0004 | |||
| OLPX / Olaplex Holdings, Inc. | 0.01 | 0.00 | 0.02 | 13.33 | 0.0093 | 0.0006 | |||
| BRY / Berry Corporation | 0.01 | 0.00 | 0.02 | -11.76 | 0.0082 | -0.0016 | |||
| SUP / Superior Industries International, Inc. | 0.00 | -100.00 | 0.00 | 0.0000 | |||||
| MTRX / Matrix Service Company | 0.00 | -100.00 | 0.00 | 0.0000 | |||||
| FFIC / Flushing Financial Corporation | 0.00 | -100.00 | 0.00 | 0.0000 | |||||
| ADS / Bread Financial Holdings Inc | 0.00 | -100.00 | 0.00 | 0.0000 | |||||
| ARRY / Array Technologies, Inc. | 0.00 | -100.00 | 0.00 | 0.0000 | |||||
| BGFV / Big 5 Sporting Goods Corporation | 0.00 | -100.00 | 0.00 | 0.0000 | |||||
| CTLP / Cantaloupe, Inc. | 0.00 | -100.00 | 0.00 | 0.0000 | |||||
| ENZB / Enzo Biochem, Inc. | 0.00 | -100.00 | 0.00 | 0.0000 | |||||
| NAGE / Niagen Bioscience, Inc. | 0.00 | -100.00 | 0.00 | 0.0000 | |||||
| UFI / Unifi, Inc. | 0.00 | -100.00 | 0.00 | 0.0000 | |||||
| FFWM / First Foundation Inc. | 0.00 | -100.00 | 0.00 | 0.0000 |