Mga Batayang Estadistika
| Manajer | Richard Pzena |
| Profil Orang Dalam | PZENA INVESTMENT MANAGEMENT LLC |
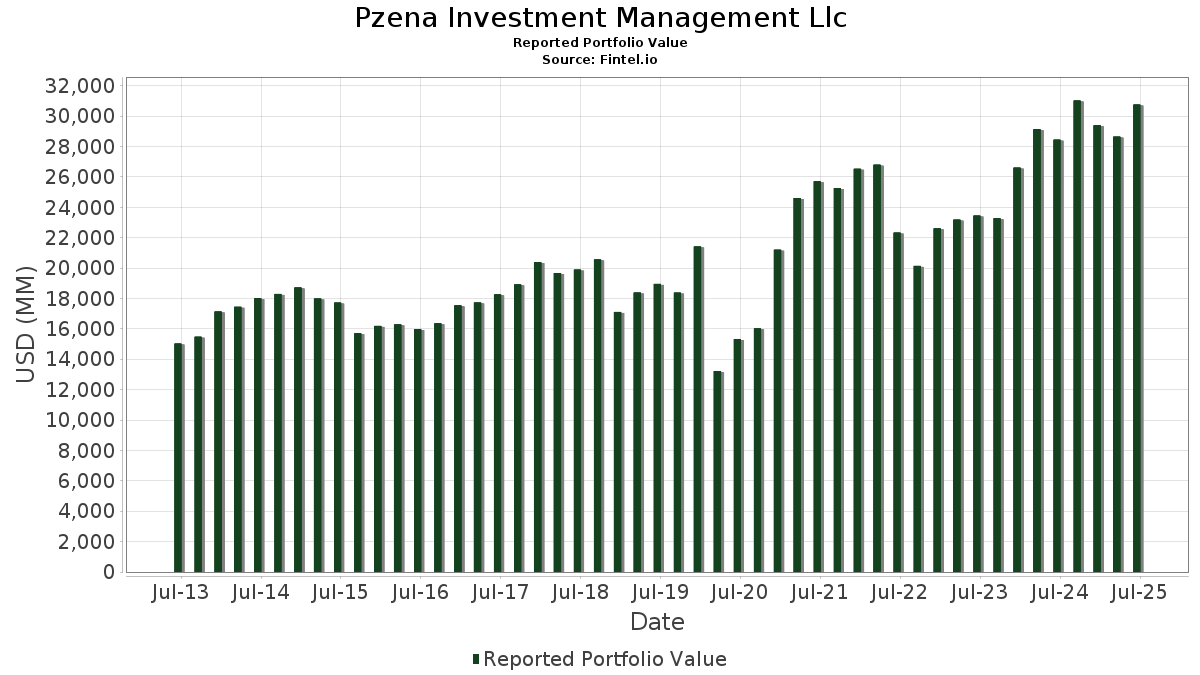
| Nilai Portofolio | $ 30,752,340,879 |
| Posisi Saat Ini | 152 |
Kepemilikan Terbaru, Kinerja, AUM (dari 13F, 13D)
Pzena Investment Management Llc telah mengungkapkan total kepemilikan 152 dalam pengajuan SEC terbaru mereka. Manajer portofolio tercantum sebagai Richard Pzena. Nilai portofolio terbaru dihitung sebesar $ 30,752,340,879 USD. Aset yang Dikelola (AUM) sebenarnya adalah nilai ini ditambah kas (yang tidak diungkapkan). Aset-aset utama Pzena Investment Management Llc adalah Magna International Inc. (US:MGA) , Cognizant Technology Solutions Corporation (US:CTSH) , Dollar General Corporation (US:DG) , Baxter International Inc. (US:BAX) , and Citigroup Inc. (US:C) . Posisi baru Pzena Investment Management Llc meliputi: WNS (Holdings) Limited (US:WNS) , Oshkosh Corporation (US:OSK) , Arcos Dorados Holdings Inc. (US:ARCO) , Teleflex Incorporated (US:TFX) , and GSK plc - Depositary Receipt (Common Stock) (US:GSK) . Industri unggulan Pzena Investment Management Llc adalah "Health Services" (sic 80) , "Stone, Clay, Glass, And Concrete Products" (sic 32) , and "Communications" (sic 48) .
Peningkatan Tertinggi Kuartal Ini
Kami menggunakan perubahan dalam alokasi portofolio karena ini adalah metrik yang paling bermakna. Perubahan dapat disebabkan oleh perdagangan atau perubahan harga saham.
| Keamanan | Saham (MM) |
Nilai (Juta Dolar AS) |
Portfolio % | ΔPorsyento ng Portfolio |
|---|---|---|---|---|
| 18.72 | 664.69 | 2.1326 | 1.2453 | |
| 12.21 | 909.71 | 2.9188 | 1.1671 | |
| 13.57 | 1,155.48 | 3.7574 | 0.4530 | |
| 11.85 | 1,355.28 | 4.3484 | 0.4279 | |
| 1.66 | 105.13 | 0.3419 | 0.3419 | |
| 10.37 | 830.99 | 2.7022 | 0.2385 | |
| 5.42 | 1,153.49 | 3.7009 | 0.2165 | |
| 0.53 | 59.71 | 0.1942 | 0.1942 | |
| 29.50 | 1,553.03 | 5.0501 | 0.1918 | |
| 2.79 | 103.08 | 0.3352 | 0.1858 |
Penurunan Tertinggi Kuartal Ini
Kami menggunakan perubahan dalam alokasi portofolio karena ini adalah metrik yang paling bermakna. Perubahan dapat disebabkan oleh perdagangan atau perubahan harga saham.
| Keamanan | Saham (MM) |
Nilai (Juta Dolar AS) |
Portfolio % | ΔPorsyento ng Portfolio |
|---|---|---|---|---|
| 27.09 | 717.38 | 2.3328 | -0.7100 | |
| 14.84 | 687.10 | 2.2045 | -0.6614 | |
| 39.34 | 1,191.11 | 3.8732 | -0.5214 | |
| 13.71 | 766.86 | 2.4605 | -0.4946 | |
| 42.71 | 530.87 | 1.7263 | -0.4824 | |
| 16.75 | 1,155.20 | 3.7565 | -0.4261 | |
| 4.08 | 996.66 | 3.1978 | -0.3395 | |
| 68.66 | 355.67 | 1.1566 | -0.3239 | |
| 4.24 | 237.93 | 0.7634 | -0.3100 | |
| 10.46 | 866.14 | 2.7790 | -0.2609 |
Pengajuan 13D/G
Ini adalah daftar pengajuan 13D dan 13G yang dibuat dalam setahun terakhir (jika ada). Klik ikon tautan untuk melihat riwayat transaksi lengkap. Baris berwarna hijau menunjukkan posisi baru. Baris berwarna merah menunjukkan posisi yang sudah ditutup.
| Tanggal File | Formulir | Keamanan | Sebelumnya Saham |
Saat ini Saham |
ΔPersentase Saham | % Kepemilikan |
% ΔKepemilikan | |
|---|---|---|---|---|---|---|---|---|
| 2025-09-02 | BAX / Baxter International Inc. | 39,708,226 | 55,458,217 | 39.66 | 10.80 | 40.26 | ||
| 2025-07-15 | ARCO / Arcos Dorados Holdings Inc. | 6,533,482 | 5.00 | |||||
| 2025-07-14 | AMWD / American Woodmark Corporation | 840,674 | 1,148,331 | 36.60 | 7.90 | 38.60 | ||
| 2025-07-14 | SWKS / Skyworks Solutions, Inc. | 7,851,443 | 12,321,597 | 56.93 | 8.20 | 60.78 | ||
| 2025-07-11 | PVH / PVH Corp. | 6,219,748 | 6,465,818 | 3.96 | 13.40 | 19.64 | ||
| 2025-07-11 | OEC / Orion S.A. | 3,647,985 | 4,577,197 | 25.47 | 8.10 | 28.57 | ||
| 2025-07-03 | VREX / Varex Imaging Corporation | 3,890,879 | 4,244,977 | 9.10 | 10.20 | 7.37 | ||
| 2025-07-03 | HVT / Haverty Furniture Companies, Inc. | 962,102 | 1,560,557 | 62.20 | 10.50 | 64.06 | ||
| 2025-07-03 | SHYF / The Shyft Group, Inc. | 3,099,622 | 3,579,364 | 15.48 | 10.20 | 13.33 | ||
| 2025-05-01 | JELD / JELD-WEN Holding, Inc. | 10,311,305 | 0 | -100.00 | 0.00 | -100.00 | ||
| 2025-05-01 | PLOW / Douglas Dynamics, Inc. | 2,273,003 | 2,325,476 | 2.31 | 10.10 | 3.06 | ||
| 2025-05-01 | GCO / Genesco Inc. | 1,047,673 | 1,399,224 | 33.56 | 12.70 | 36.56 | ||
| 2025-04-28 | KOP / Koppers Holdings Inc. | 1,221,328 | 6.10 | |||||
| 2025-04-28 | AAP / Advance Auto Parts, Inc. | 3,270,897 | 4,312,508 | 31.84 | 7.20 | 30.91 | ||
| 2025-04-28 | PAHC / Phibro Animal Health Corporation | 1,460,800 | 723,830 | -50.45 | 3.60 | -50.00 | ||
| 2025-04-28 | SPB / Spectrum Brands Holdings, Inc. | 1,334,033 | 5.10 | |||||
| 2025-02-04 | MGA / Magna International Inc. | 28,289,811 | 10.00 | |||||
| 2025-01-30 | DG / Dollar General Corporation | 11,861,633 | 5.40 | |||||
| 2025-01-30 | EQH / Equitable Holdings, Inc. | 8,234,705 | 2.60 | |||||
| 2025-01-30 | SSNC / SS&C Technologies Holdings, Inc. | 14,619,455 | 11,667,485 | -20.19 | 4.70 | -20.34 | ||
| 2025-01-23 | AVT / Avnet, Inc. | 8,751,446 | 7,364,024 | -15.85 | 8.50 | -12.37 | ||
| 2025-01-23 | NWL / Newell Brands Inc. | 54,518,863 | 49,432,520 | -9.33 | 11.90 | -9.85 | ||
| 2024-11-08 | TILE / Interface, Inc. | 3,490,324 | 317,299 | -90.91 | 0.50 | -91.67 | ||
| 2024-11-08 | SCSC / ScanSource, Inc. | 1,893,151 | 514,503 | -72.82 | 2.10 | -72.00 | ||
| 2024-10-22 | GIL / Gildan Activewear Inc. | 9,602,146 | 636,743 | -93.37 | 0.40 | -92.86 | ||
| 2024-10-22 | CNO / CNO Financial Group, Inc. | 6,982,684 | 4,577,890 | -34.44 | 4.30 | -30.65 | ||
| 2024-10-21 | MRC / MRC Global Inc. | 7,001,859 | 5,770,791 | -17.58 | 6.80 | -18.07 | ||
| 2024-10-21 | SCS / Steelcase Inc. | 7,843,245 | 5,239,449 | -33.20 | 5.60 | -33.33 | ||
| 2024-10-21 | USNA / USANA Health Sciences, Inc. | 1,049,610 | 5.50 | |||||
| 2024-10-21 | DOX / Amdocs Limited | 6,482,552 | 5.70 | |||||
| 2024-10-15 | MBUU / Malibu Boats, Inc. | 1,555,331 | 7.80 | |||||
| 2024-10-10 | HOFT / Hooker Furnishings Corporation | 1,426,039 | 1,286,381 | -9.79 | 12.00 | -10.45 | ||
| 2024-10-07 | LEA / Lear Corporation | 6,304,116 | 7,764,912 | 23.17 | 13.80 | 27.78 | ||
| 2024-10-04 | NOV / NOV Inc. | 31,371,893 | 43,348,680 | 38.18 | 11.00 | 37.50 |
Pengajuan 13F dan Dana
Formulir ini diajukan pada 2025-07-25 untuk periode pelaporan 2025-06-30. Klik ikon tautan untuk melihat riwayat transaksi selengkapnya.
Tingkatkan ke versi premium untuk membuka data premium dan ekspor ke Excel. ![]() .
.
| Keamanan | Ketik | Harga Saham Rata-rata | Saham (MM) |
ΔSaham (%) |
ΔSaham (%) |
Nilai ($MM) |
Portpolyo (%) |
ΔPortofolio (%) |
|
|---|---|---|---|---|---|---|---|---|---|
| MGA / Magna International Inc. | 29.50 | 3.70 | 1,553.03 | 11.61 | 5.0501 | 0.1918 | |||
| CTSH / Cognizant Technology Solutions Corporation | 17.45 | 2.20 | 1,361.68 | 4.24 | 4.4279 | -0.1327 | |||
| DG / Dollar General Corporation | 11.85 | -7.22 | 1,355.28 | 20.69 | 4.3484 | 0.4279 | |||
| BAX / Baxter International Inc. | 39.34 | 6.97 | 1,191.11 | -5.37 | 3.8732 | -0.5214 | |||
| C / Citigroup Inc. | 13.57 | 1.82 | 1,155.48 | 22.09 | 3.7574 | 0.4530 | |||
| CVS / CVS Health Corporation | 16.75 | -5.29 | 1,155.20 | -3.57 | 3.7565 | -0.4261 | |||
| COF / Capital One Financial Corporation | 5.42 | -2.60 | 1,153.49 | 15.58 | 3.7009 | 0.2165 | |||
| CHTR / Charter Communications, Inc. | 2.65 | -4.79 | 1,083.36 | 5.61 | 3.5229 | -0.0586 | |||
| HUM / Humana Inc. | 4.08 | 6.47 | 996.66 | -1.63 | 3.1978 | -0.3395 | |||
| SWKS / Skyworks Solutions, Inc. | 12.21 | 57.26 | 909.71 | 81.32 | 2.9188 | 1.1671 | |||
| GPN / Global Payments Inc. | 11.05 | 32.59 | 884.46 | 8.38 | 2.8761 | 0.0269 | |||
| SSNC / SS&C Technologies Holdings, Inc. | 10.46 | 0.36 | 866.14 | -0.52 | 2.7790 | -0.2609 | |||
| WFC / Wells Fargo & Company | 10.37 | 5.52 | 830.99 | 17.76 | 2.7022 | 0.2385 | |||
| UBS / UBS Group AG | 30.90 | 5.29 | 829.73 | 5.21 | 2.6622 | -0.0913 | |||
| MDT / Medtronic plc | 8.86 | 5.59 | 771.92 | 2.43 | 2.4767 | -0.1544 | |||
| TSN / Tyson Foods, Inc. | 13.71 | 3.35 | 766.86 | -9.39 | 2.4605 | -0.4946 | |||
| MET / MetLife, Inc. | 9.14 | 6.84 | 735.41 | 7.02 | 2.3595 | -0.0397 | |||
| LEA / Lear Corporation | 7.60 | -0.81 | 722.13 | 6.79 | 2.3169 | -0.0439 | |||
| DOW / Dow Inc. | 27.09 | 8.55 | 717.38 | -17.68 | 2.3328 | -0.7100 | |||
| BMY / Bristol-Myers Squibb Company | 14.84 | 10.29 | 687.10 | -16.29 | 2.2045 | -0.6614 | |||
| CRBG / Corebridge Financial, Inc. | 18.72 | 132.58 | 664.69 | 161.53 | 2.1326 | 1.2453 | |||
| DOX / Amdocs Limited | 6.55 | 2.06 | 597.72 | 1.77 | 1.9178 | -0.1327 | |||
| NOV / NOV Inc. | 42.71 | 2.75 | 530.87 | -16.08 | 1.7263 | -0.4824 | |||
| PVH / PVH Corp. | 6.41 | 3.99 | 439.56 | 10.36 | 1.4294 | 0.0388 | |||
| FMS / Fresenius Medical Care AG - Depositary Receipt (Common Stock) | 14.66 | -4.64 | 418.92 | 9.41 | 1.3441 | 0.0073 | |||
| TEL / TE Connectivity plc | 2.42 | -2.03 | 407.94 | 16.93 | 1.3089 | 0.0909 | |||
| AVT / Avnet, Inc. | 7.34 | 2.93 | 389.68 | 13.61 | 1.2671 | 0.0696 | |||
| NOK / Nokia Oyj - Depositary Receipt (Common Stock) | 68.66 | -14.66 | 355.67 | -16.12 | 1.1566 | -0.3239 | |||
| BAC / Bank of America Corporation | 6.58 | 3.52 | 311.21 | 17.39 | 1.0120 | 0.0864 | |||
| NWL / Newell Brands Inc. | 48.37 | -0.75 | 261.22 | -13.55 | 0.8494 | -0.2056 | |||
| VOYA / Voya Financial, Inc. | 3.66 | 1.73 | 259.95 | 6.59 | 0.8340 | -0.0174 | |||
| SHEL / Shell plc - Depositary Receipt (Common Stock) | 3.67 | 2.03 | 258.06 | -1.97 | 0.8280 | -0.0911 | |||
| EQH / Equitable Holdings, Inc. | 4.24 | -28.14 | 237.93 | -22.61 | 0.7634 | -0.3100 | |||
| BAP / Credicorp Ltd. | 1.03 | -1.69 | 229.72 | 18.04 | 0.7370 | 0.0576 | |||
| DAL / Delta Air Lines, Inc. | 4.31 | 1.91 | 212.08 | 14.95 | 0.6897 | 0.0455 | |||
| AAP / Advance Auto Parts, Inc. | 4.39 | 1.91 | 204.32 | 20.83 | 0.6644 | 0.0740 | |||
| CI / The Cigna Group | 0.52 | 9.66 | 173.09 | 10.19 | 0.5554 | 0.0069 | |||
| PFE / Pfizer Inc. | 6.56 | -7.08 | 158.99 | -11.12 | 0.5170 | -0.1075 | |||
| KSPI / Joint Stock Company Kaspi.kz - Depositary Receipt (Common Stock) | 1.68 | 17.28 | 142.67 | 7.23 | 0.4578 | -0.0068 | |||
| ZTO / ZTO Express (Cayman) Inc. - Depositary Receipt (Common Stock) | 7.62 | -1.36 | 135.31 | -11.75 | 0.4341 | -0.1012 | |||
| MHK / Mohawk Industries, Inc. | 1.18 | 5.36 | 123.27 | -3.26 | 0.4008 | -0.0440 | |||
| CNXC / Concentrix Corporation | 2.28 | -0.44 | 120.34 | -5.42 | 0.3861 | -0.0581 | |||
| GL / Globe Life Inc. | 0.95 | 0.54 | 117.58 | -5.13 | 0.3772 | -0.0555 | |||
| PPG / PPG Industries, Inc. | 1.01 | 5.25 | 115.34 | 9.49 | 0.3701 | 0.0023 | |||
| MS / Morgan Stanley | 0.79 | 3.67 | 111.44 | 25.16 | 0.3576 | 0.0467 | |||
| CSCO / Cisco Systems, Inc. | 1.60 | -12.54 | 111.00 | -1.67 | 0.3610 | -0.0332 | |||
| WNS / WNS (Holdings) Limited | 1.66 | 105.13 | 0.3419 | 0.3419 | |||||
| LKQ / LKQ Corporation | 2.79 | 176.89 | 103.08 | 140.90 | 0.3352 | 0.1858 | |||
| JPM / JPMorgan Chase & Co. | 0.34 | 9.63 | 99.24 | 29.57 | 0.3227 | 0.0553 | |||
| CNO / CNO Financial Group, Inc. | 2.55 | -0.49 | 98.47 | -7.82 | 0.3159 | -0.0570 | |||
| RHI / Robert Half Inc. | 2.38 | 80.27 | 97.59 | 35.66 | 0.3131 | 0.0620 | |||
| GSCE / GS Connect S&P GSCI Enhanced Commodity Total Return ETN | 0.13 | -7.57 | 89.40 | 19.75 | 0.2868 | 0.0262 | |||
| WBS / Webster Financial Corporation | 1.61 | 1.49 | 88.06 | 7.49 | 0.2863 | 0.0003 | |||
| GD / General Dynamics Corporation | 0.29 | 4.67 | 85.03 | 12.00 | 0.2728 | 0.0077 | |||
| ELV / Elevance Health, Inc. | 0.22 | 8.11 | 84.51 | -3.33 | 0.2748 | -0.0304 | |||
| ADNT / Adient plc | 4.17 | 7.00 | 81.24 | 61.91 | 0.2606 | 0.0855 | |||
| SPB / Spectrum Brands Holdings, Inc. | 1.47 | 10.53 | 78.15 | -18.13 | 0.2507 | -0.0825 | |||
| OLN / Olin Corporation | 3.83 | 4.55 | 76.93 | -13.35 | 0.2468 | -0.0632 | |||
| HAL / Halliburton Company | 3.73 | 134.68 | 76.10 | 88.52 | 0.2442 | 0.1032 | |||
| WAB / Westinghouse Air Brake Technologies Corporation | 0.36 | 4.81 | 75.51 | 20.99 | 0.2455 | 0.0277 | |||
| GPC / Genuine Parts Company | 0.60 | 98.03 | 72.31 | 101.64 | 0.2320 | 0.1068 | |||
| MRC / MRC Global Inc. | 5.22 | -2.37 | 71.61 | 16.59 | 0.2298 | 0.0153 | |||
| UHS / Universal Health Services, Inc. | 0.39 | -0.02 | 70.96 | -3.62 | 0.2277 | -0.0294 | |||
| XOM / Exxon Mobil Corporation | 0.65 | 6.28 | 70.51 | -3.66 | 0.2262 | -0.0293 | |||
| DRH / DiamondRock Hospitality Company | 8.79 | 2.11 | 67.30 | 1.32 | 0.2159 | -0.0160 | |||
| PLOW / Douglas Dynamics, Inc. | 2.28 | 0.38 | 67.24 | 27.34 | 0.2157 | 0.0314 | |||
| HSIC / Henry Schein, Inc. | 0.92 | -4.71 | 67.22 | 1.63 | 0.2157 | -0.0152 | |||
| TRS / TriMas Corporation | 2.18 | 1.98 | 62.31 | 24.52 | 0.1999 | 0.0252 | |||
| AMWD / American Woodmark Corporation | 1.15 | 36.60 | 61.29 | 23.92 | 0.1966 | 0.0240 | |||
| SCS / Steelcase Inc. | 5.75 | 7.27 | 60.02 | 2.08 | 0.1926 | -0.0127 | |||
| KFY / Korn Ferry | 0.82 | 6.56 | 60.01 | 15.20 | 0.1951 | 0.0133 | |||
| OSK / Oshkosh Corporation | 0.53 | 59.71 | 0.1942 | 0.1942 | |||||
| REZI / Resideo Technologies, Inc. | 2.69 | 1.58 | 59.28 | 26.60 | 0.1902 | 0.0267 | |||
| ONB / Old National Bancorp | 2.70 | -6.24 | 57.53 | -5.58 | 0.1846 | -0.0281 | |||
| HUN / Huntsman Corporation | 5.31 | 9.30 | 55.34 | -27.87 | 0.1776 | -0.0903 | |||
| MBUU / Malibu Boats, Inc. | 1.67 | 8.87 | 52.37 | 11.21 | 0.1680 | 0.0036 | |||
| ARCO / Arcos Dorados Holdings Inc. | 6.53 | 51.55 | 0.1676 | 0.1676 | |||||
| NVST / Envista Holdings Corporation | 2.46 | 7.18 | 48.05 | 21.34 | 0.1542 | 0.0159 | |||
| OEC / Orion S.A. | 4.58 | 37.50 | 48.01 | 11.55 | 0.1541 | 0.0038 | |||
| SHG / Shinhan Financial Group Co., Ltd. - Depositary Receipt (Common Stock) | 1.03 | -4.73 | 46.43 | 34.17 | 0.1490 | 0.0281 | |||
| BFH / Bread Financial Holdings, Inc. | 0.80 | 9.88 | 45.70 | 25.33 | 0.1486 | 0.0213 | |||
| ABM / ABM Industries Incorporated | 0.96 | 13.48 | 45.51 | 13.12 | 0.1460 | 0.0056 | |||
| MBC / MasterBrand, Inc. | 4.15 | 45.30 | 45.41 | 21.60 | 0.1457 | 0.0153 | |||
| ASB / Associated Banc-Corp | 1.86 | 4.01 | 45.35 | 12.60 | 0.1455 | 0.0049 | |||
| SHYF / The Shyft Group, Inc. | 3.58 | 16.05 | 44.89 | 79.88 | 0.1440 | 0.0569 | |||
| HDB / HDFC Bank Limited - Depositary Receipt (Common Stock) | 0.58 | 13.76 | 44.74 | 31.28 | 0.1455 | 0.0265 | |||
| RF / Regions Financial Corporation | 1.90 | 0.00 | 44.67 | 8.24 | 0.1433 | -0.0008 | |||
| WSFS / WSFS Financial Corporation | 0.81 | 2.97 | 44.61 | 9.18 | 0.1431 | 0.0005 | |||
| WCC / WESCO International, Inc. | 0.23 | 0.00 | 42.38 | 19.25 | 0.1360 | 0.0119 | |||
| TFX / Teleflex Incorporated | 0.36 | 42.15 | 0.1371 | 0.1371 | |||||
| CBRE / CBRE Group, Inc. | 0.30 | -26.86 | 41.37 | -21.63 | 0.1327 | -0.0516 | |||
| SCSC / ScanSource, Inc. | 0.98 | 3.56 | 40.79 | 27.31 | 0.1326 | 0.0208 | |||
| KOP / Koppers Holdings Inc. | 1.25 | 2.19 | 40.12 | 17.33 | 0.1287 | 0.0093 | |||
| MSM / MSC Industrial Direct Co., Inc. | 0.46 | 0.00 | 39.27 | 9.46 | 0.1260 | 0.0007 | |||
| FITB / Fifth Third Bancorp | 0.95 | 0.06 | 39.13 | 4.99 | 0.1256 | -0.0046 | |||
| LDOS / Leidos Holdings, Inc. | 0.24 | 5.44 | 38.54 | 23.27 | 0.1237 | 0.0145 | |||
| HCA / HCA Healthcare, Inc. | 0.10 | -12.41 | 38.30 | -2.89 | 0.1229 | -0.0148 | |||
| JNJ / Johnson & Johnson | 0.25 | 4.46 | 37.62 | -3.78 | 0.1207 | -0.0158 | |||
| VREX / Varex Imaging Corporation | 4.24 | 11.64 | 36.80 | -16.56 | 0.1181 | -0.0359 | |||
| AIG / American International Group, Inc. | 0.43 | -12.03 | 36.75 | -13.40 | 0.1179 | -0.0302 | |||
| USNA / USANA Health Sciences, Inc. | 1.20 | 9.41 | 36.58 | 23.85 | 0.1174 | 0.0142 | |||
| TGT / Target Corporation | 0.37 | 6.28 | 36.19 | 0.47 | 0.1161 | -0.0096 | |||
| COLB / Columbia Banking System, Inc. | 1.54 | 8.57 | 36.04 | 1.78 | 0.1156 | -0.0080 | |||
| HR / Healthcare Realty Trust Incorporated | 2.23 | 0.00 | 35.30 | -6.15 | 0.1133 | -0.0181 | |||
| SNV / Synovus Financial Corp. | 0.68 | 1.72 | 35.21 | 12.63 | 0.1130 | 0.0038 | |||
| G / Genpact Limited | 0.73 | 0.00 | 32.22 | -12.64 | 0.1034 | -0.0254 | |||
| HVT / Haverty Furniture Companies, Inc. | 1.56 | 61.53 | 31.76 | 66.69 | 0.1033 | 0.0368 | |||
| UVV / Universal Corporation | 0.50 | -45.50 | 28.94 | -43.37 | 0.0929 | -0.0856 | |||
| KEY / KeyCorp | 1.65 | 0.22 | 28.72 | 9.18 | 0.0921 | 0.0003 | |||
| GCO / Genesco Inc. | 1.43 | 44.42 | 28.22 | 33.95 | 0.0905 | 0.0170 | |||
| ARW / Arrow Electronics, Inc. | 0.22 | 0.00 | 28.19 | 22.73 | 0.0905 | 0.0103 | |||
| HELE / Helen of Troy Limited | 0.99 | 30.30 | 27.96 | -30.87 | 0.0897 | -0.0515 | |||
| UVSP / Univest Financial Corporation | 0.89 | -22.30 | 26.68 | -17.70 | 0.0856 | -0.0276 | |||
| CMA / Comerica Incorporated | 0.42 | 0.00 | 25.21 | 1.00 | 0.0809 | -0.0063 | |||
| ABEV / Ambev S.A. - Depositary Receipt (Common Stock) | 10.32 | -25.47 | 24.86 | -22.91 | 0.0798 | -0.0328 | |||
| CHRW / C.H. Robinson Worldwide, Inc. | 0.25 | -6.33 | 24.10 | -12.23 | 0.0784 | -0.0175 | |||
| BIDU / Baidu, Inc. - Depositary Receipt (Common Stock) | 0.28 | -0.06 | 23.71 | -6.87 | 0.0771 | -0.0118 | |||
| FMC / FMC Corporation | 0.56 | 0.08 | 23.44 | -0.96 | 0.0752 | -0.0074 | |||
| TBI / TrueBlue, Inc. | 2.92 | 2.97 | 18.92 | 25.65 | 0.0607 | 0.0081 | |||
| MMI / Marcus & Millichap, Inc. | 0.61 | 6.62 | 18.87 | -4.95 | 0.0605 | -0.0088 | |||
| HOFT / Hooker Furnishings Corporation | 1.36 | 2.23 | 14.38 | 7.73 | 0.0461 | -0.0005 | |||
| MAN / ManpowerGroup Inc. | 0.35 | 0.00 | 14.19 | -30.20 | 0.0455 | -0.0254 | |||
| FNF / Fidelity National Financial, Inc. | 0.22 | -4.78 | 12.52 | -17.98 | 0.0402 | -0.0131 | |||
| TSM / Taiwan Semiconductor Manufacturing Company Limited - Depositary Receipt (Common Stock) | 0.04 | 2.48 | 9.64 | 39.83 | 0.0313 | 0.0073 | |||
| BABA / Alibaba Group Holding Limited - Depositary Receipt (Common Stock) | 0.05 | 0.50 | 6.05 | -13.80 | 0.0194 | -0.0051 | |||
| KB / KB Financial Group Inc. - Depositary Receipt (Common Stock) | 0.04 | -17.38 | 3.44 | 26.10 | 0.0110 | 0.0015 | |||
| CIG / Companhia Energética de Minas Gerais - CEMIG - Depositary Receipt (Common Stock) | 1.59 | 0.30 | 3.11 | 11.70 | 0.0100 | 0.0003 | |||
| ITUB / Itaú Unibanco Holding S.A. - Depositary Receipt (Common Stock) | 0.41 | 0.00 | 2.78 | 23.49 | 0.0089 | 0.0011 | |||
| VALE / Vale S.A. - Depositary Receipt (Common Stock) | 0.29 | 0.00 | 2.78 | -2.73 | 0.0089 | -0.0011 | |||
| DAN / Dana Incorporated | 0.16 | -89.53 | 2.70 | -86.53 | 0.0087 | -0.0613 | |||
| PBR.A / Petróleo Brasileiro S.A. - Petrobras - Depositary Receipt (Common Stock) | 0.23 | 19.55 | 2.66 | 5.81 | 0.0085 | -0.0002 | |||
| ING / ING Groep N.V. - Depositary Receipt (Common Stock) | 0.06 | 11.47 | 1.23 | 24.49 | 0.0039 | 0.0005 | |||
| BCS / Barclays PLC - Depositary Receipt (Common Stock) | 0.06 | 8.95 | 1.20 | 31.87 | 0.0039 | 0.0007 | |||
| MT / ArcelorMittal S.A. - Depositary Receipt (Common Stock) | 0.04 | 10.48 | 1.18 | 20.92 | 0.0038 | 0.0004 | |||
| HSBC / HSBC Holdings plc - Depositary Receipt (Common Stock) | 0.02 | 6.04 | 1.15 | 12.25 | 0.0037 | 0.0002 | |||
| PHG / Koninklijke Philips N.V. - Depositary Receipt (Common Stock) | 0.02 | 33.52 | 0.50 | 26.07 | 0.0016 | 0.0002 | |||
| SMFG / Sumitomo Mitsui Financial Group, Inc. - Depositary Receipt (Common Stock) | 0.02 | 8.67 | 0.36 | 6.14 | 0.0012 | -0.0000 | |||
| NWG / NatWest Group plc - Depositary Receipt (Common Stock) | 0.02 | -45.10 | 0.34 | -34.86 | 0.0011 | -0.0007 | |||
| EQNR / Equinor ASA - Depositary Receipt (Common Stock) | 0.01 | 44.32 | 0.34 | 37.55 | 0.0011 | 0.0002 | |||
| IBN / ICICI Bank Limited - Depositary Receipt (Common Stock) | 0.01 | -48.94 | 0.34 | -45.53 | 0.0011 | -0.0011 | |||
| DIS / The Walt Disney Company | 0.00 | 0.00 | 0.32 | 25.50 | 0.0010 | 0.0001 | |||
| GSK / GSK plc - Depositary Receipt (Common Stock) | 0.01 | 0.29 | 0.0009 | 0.0009 | |||||
| CALM / Cal-Maine Foods, Inc. | 0.00 | 0.28 | 0.0009 | 0.0009 | |||||
| INTC / Intel Corporation | 0.01 | 0.00 | 0.28 | -1.08 | 0.0009 | -0.0001 | |||
| SNY / Sanofi - Depositary Receipt (Common Stock) | 0.01 | 3.62 | 0.27 | -9.73 | 0.0009 | -0.0002 | |||
| MRK / Merck & Co., Inc. | 0.00 | 0.26 | 0.0008 | 0.0008 | |||||
| ULTA / Ulta Beauty, Inc. | 0.00 | 0.25 | 0.0008 | 0.0008 | |||||
| CRUS / Cirrus Logic, Inc. | 0.00 | 0.00 | 0.24 | 4.76 | 0.0008 | -0.0000 | |||
| ADBE / Adobe Inc. | 0.00 | 0.23 | 0.0007 | 0.0007 | |||||
| HIG / The Hartford Insurance Group, Inc. | 0.00 | 0.22 | 0.0007 | 0.0007 | |||||
| ALKS / Alkermes plc | 0.01 | 0.21 | 0.0007 | 0.0007 | |||||
| DELL / Dell Technologies Inc. | 0.00 | 0.21 | 0.0007 | 0.0007 | |||||
| PAHC / Phibro Animal Health Corporation | 0.00 | -100.00 | 0.00 | 0.0000 | |||||
| JELD / JELD-WEN Holding, Inc. | 0.00 | -100.00 | 0.00 | -100.00 | -0.2149 | ||||
| COR / Cencora, Inc. | 0.00 | -100.00 | 0.00 | 0.0000 | |||||
| GILD / Gilead Sciences, Inc. | 0.00 | -100.00 | 0.00 | 0.0000 | |||||
| DFS / Discover Financial Services | 0.00 | -100.00 | 0.00 | 0.0000 | |||||
| EBAY / eBay Inc. | 0.00 | -100.00 | 0.00 | 0.0000 |