Mga Batayang Estadistika
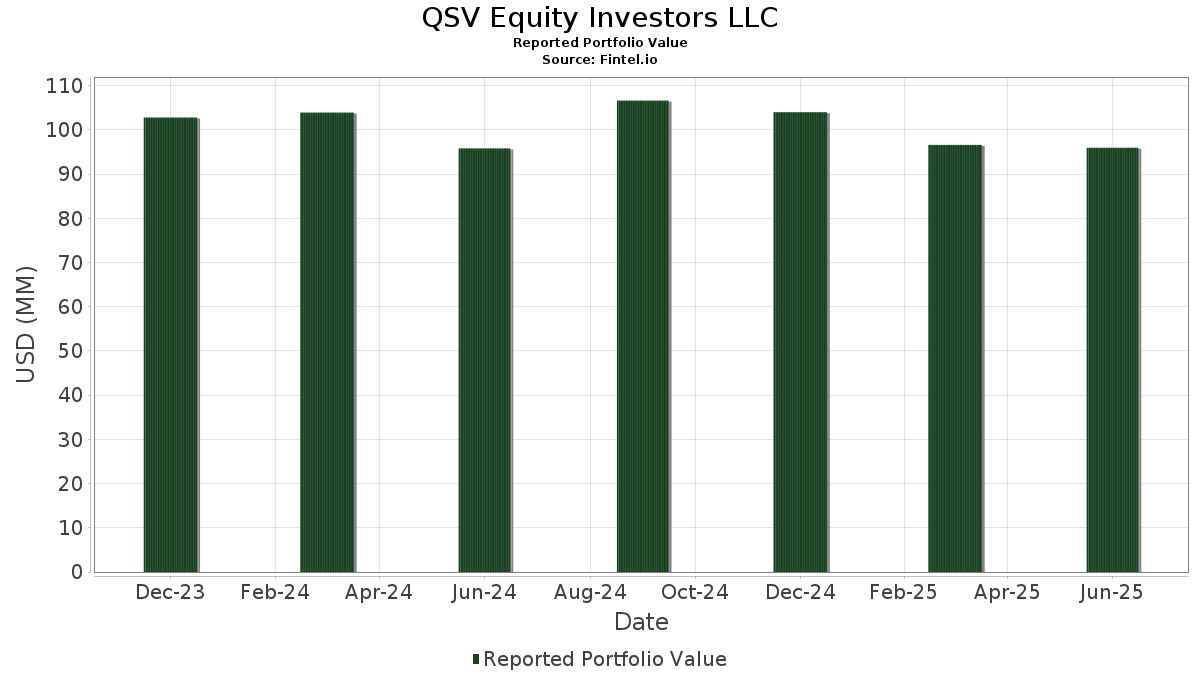
| Nilai Portofolio | $ 95,955,890 |
| Posisi Saat Ini | 90 |
Kepemilikan Terbaru, Kinerja, AUM (dari 13F, 13D)
QSV Equity Investors LLC telah mengungkapkan total kepemilikan 90 dalam pengajuan SEC terbaru mereka. Nilai portofolio terbaru dihitung sebesar $ 95,955,890 USD. Aset yang Dikelola (AUM) sebenarnya adalah nilai ini ditambah kas (yang tidak diungkapkan). Aset-aset utama QSV Equity Investors LLC adalah Dorman Products, Inc. (US:DORM) , Bank OZK (US:OZK) , Progress Software Corporation (US:PRGS) , CSG Systems International, Inc. (US:CSGS) , and ExlService Holdings, Inc. (US:EXLS) . Posisi baru QSV Equity Investors LLC meliputi: Haemonetics Corporation (US:HAE) , Cabot Corporation (US:CBT) , Quaker Chemical Corporation (US:KWR) , Tennant Company (US:TNC) , and Bruker Corporation (US:BRKR) .
Peningkatan Tertinggi Kuartal Ini
Kami menggunakan perubahan dalam alokasi portofolio karena ini adalah metrik yang paling bermakna. Perubahan dapat disebabkan oleh perdagangan atau perubahan harga saham.
| Keamanan | Saham (MM) |
Nilai (Juta Dolar AS) |
Portfolio % | ΔPorsyento ng Portfolio |
|---|---|---|---|---|
| 0.02 | 1.55 | 1.6165 | 1.6165 | |
| 0.02 | 1.20 | 1.2520 | 1.2520 | |
| 0.01 | 1.19 | 1.2410 | 1.2410 | |
| 0.07 | 1.43 | 1.4918 | 1.2301 | |
| 0.01 | 1.06 | 1.1019 | 1.1019 | |
| 0.02 | 0.91 | 0.9507 | 0.9507 | |
| 0.04 | 0.88 | 0.9199 | 0.9199 | |
| 0.01 | 2.12 | 2.2096 | 0.5591 | |
| 0.03 | 0.95 | 0.9922 | 0.4527 | |
| 0.04 | 2.29 | 2.3873 | 0.4476 |
Penurunan Tertinggi Kuartal Ini
Kami menggunakan perubahan dalam alokasi portofolio karena ini adalah metrik yang paling bermakna. Perubahan dapat disebabkan oleh perdagangan atau perubahan harga saham.
| Keamanan | Saham (MM) |
Nilai (Juta Dolar AS) |
Portfolio % | ΔPorsyento ng Portfolio |
|---|---|---|---|---|
| 0.05 | 1.16 | 1.2085 | -0.8968 | |
| 0.01 | 0.94 | 0.9765 | -0.6442 | |
| 0.05 | 1.52 | 1.5885 | -0.3719 | |
| 0.03 | 0.71 | 0.7436 | -0.3365 | |
| 0.04 | 1.25 | 1.3012 | -0.3233 | |
| 0.02 | 1.41 | 1.4711 | -0.3131 | |
| 0.08 | 1.59 | 1.6562 | -0.2599 | |
| 0.04 | 0.98 | 1.0231 | -0.2541 | |
| 0.03 | 0.95 | 0.9916 | -0.2416 | |
| 0.06 | 1.57 | 1.6327 | -0.2362 |
Pengajuan 13F dan Dana
Formulir ini diajukan pada 2025-08-13 untuk periode pelaporan 2025-06-30. Klik ikon tautan untuk melihat riwayat transaksi selengkapnya.
Tingkatkan ke versi premium untuk membuka data premium dan ekspor ke Excel. ![]() .
.
| Keamanan | Ketik | Harga Saham Rata-rata | Saham (MM) |
ΔSaham (%) |
ΔSaham (%) |
Nilai ($MM) |
Portpolyo (%) |
ΔPortofolio (%) |
|
|---|---|---|---|---|---|---|---|---|---|
| DORM / Dorman Products, Inc. | 0.02 | -1.23 | 2.40 | 0.55 | 2.4962 | 0.0294 | |||
| OZK / Bank OZK | 0.05 | -1.30 | 2.38 | 6.91 | 2.4838 | 0.1758 | |||
| PRGS / Progress Software Corporation | 0.04 | -1.36 | 2.29 | 22.26 | 2.3873 | 0.4476 | |||
| CSGS / CSG Systems International, Inc. | 0.03 | -0.83 | 2.16 | 7.08 | 2.2538 | 0.1636 | |||
| EXLS / ExlService Holdings, Inc. | 0.05 | -0.81 | 2.14 | -7.99 | 2.2336 | -0.1780 | |||
| EVR / Evercore Inc. | 0.01 | -1.64 | 2.12 | 33.00 | 2.2096 | 0.5591 | |||
| GBCI / Glacier Bancorp, Inc. | 0.05 | -1.19 | 2.10 | -3.71 | 2.1928 | -0.0700 | |||
| BRC / Brady Corporation | 0.03 | -1.25 | 2.09 | -4.96 | 2.1750 | -0.0989 | |||
| PRI / Primerica, Inc. | 0.01 | -0.42 | 2.06 | -4.22 | 2.1513 | -0.0799 | |||
| SBCF / Seacoast Banking Corporation of Florida | 0.07 | -1.81 | 1.91 | 5.41 | 1.9887 | 0.1145 | |||
| ITRN / Ituran Location and Control Ltd. | 0.05 | -0.86 | 1.90 | 6.20 | 1.9830 | 0.1280 | |||
| THG / The Hanover Insurance Group, Inc. | 0.01 | -1.42 | 1.83 | -3.74 | 1.9052 | -0.0607 | |||
| CTRE / CareTrust REIT, Inc. | 0.06 | -1.22 | 1.73 | 5.73 | 1.8080 | 0.1099 | |||
| ALG / Alamo Group Inc. | 0.01 | -14.19 | 1.68 | 5.20 | 1.7509 | 0.0970 | |||
| WSBC / WesBanco, Inc. | 0.05 | -0.82 | 1.63 | 1.31 | 1.6980 | 0.0333 | |||
| AEIS / Advanced Energy Industries, Inc. | 0.01 | -18.39 | 1.61 | 13.42 | 1.6828 | 0.2095 | |||
| INVA / Innoviva, Inc. | 0.08 | -22.52 | 1.59 | -14.11 | 1.6562 | -0.2599 | |||
| GTY / Getty Realty Corp. | 0.06 | -2.11 | 1.57 | -13.24 | 1.6327 | -0.2362 | |||
| HAE / Haemonetics Corporation | 0.02 | 1.55 | 1.6165 | 1.6165 | |||||
| FBK / FB Financial Corporation | 0.03 | -0.74 | 1.54 | -3.03 | 1.6026 | -0.0387 | |||
| NSA / National Storage Affiliates Trust | 0.05 | -0.87 | 1.52 | -19.49 | 1.5885 | -0.3719 | |||
| PSTL / Postal Realty Trust, Inc. | 0.10 | -0.84 | 1.52 | 2.29 | 1.5817 | 0.0457 | |||
| EVTC / EVERTEC, Inc. | 0.04 | -0.81 | 1.51 | -2.77 | 1.5730 | -0.0337 | |||
| ICFI / ICF International, Inc. | 0.02 | -0.81 | 1.49 | -1.13 | 1.5513 | -0.0070 | |||
| ABM / ABM Industries Incorporated | 0.03 | -1.59 | 1.45 | -1.89 | 1.5116 | -0.0190 | |||
| LXP / LXP Industrial Trust | 0.17 | -0.83 | 1.43 | -5.29 | 1.4932 | -0.0730 | |||
| GNTX / Gentex Corporation | 0.07 | 500.12 | 1.43 | 467.86 | 1.4918 | 1.2301 | |||
| GMED / Globus Medical, Inc. | 0.02 | 54.46 | 1.43 | 24.54 | 1.4917 | 0.3019 | |||
| HWC / Hancock Whitney Corporation | 0.02 | -0.84 | 1.42 | 8.51 | 1.4756 | 0.1249 | |||
| WD / Walker & Dunlop, Inc. | 0.02 | -0.81 | 1.41 | -18.11 | 1.4711 | -0.3131 | |||
| AUDC / AudioCodes Ltd. | 0.14 | -1.75 | 1.33 | 2.39 | 1.3835 | 0.0417 | |||
| WHD / Cactus, Inc. | 0.03 | 34.74 | 1.30 | 28.57 | 1.3516 | 0.3071 | |||
| ADUS / Addus HomeCare Corporation | 0.01 | -2.47 | 1.28 | 13.69 | 1.3331 | 0.1675 | |||
| WDFC / WD-40 Company | 0.01 | 0.45 | 1.27 | -6.07 | 1.3240 | -0.0766 | |||
| POWI / Power Integrations, Inc. | 0.02 | -1.46 | 1.25 | 9.15 | 1.3060 | 0.1166 | |||
| NXRT / NexPoint Residential Trust, Inc. | 0.04 | -5.61 | 1.25 | -20.46 | 1.3012 | -0.3233 | |||
| UFPI / UFP Industries, Inc. | 0.01 | -1.55 | 1.23 | -8.67 | 1.2858 | -0.1119 | |||
| MBUU / Malibu Boats, Inc. | 0.04 | -0.81 | 1.23 | 1.32 | 1.2776 | 0.0251 | |||
| HBNC / Horizon Bancorp, Inc. | 0.08 | -0.82 | 1.21 | 1.17 | 1.2624 | 0.0228 | |||
| CBT / Cabot Corporation | 0.02 | 1.20 | 1.2520 | 1.2520 | |||||
| KWR / Quaker Chemical Corporation | 0.01 | 1.19 | 1.2410 | 1.2410 | |||||
| KLIC / Kulicke and Soffa Industries, Inc. | 0.03 | -0.83 | 1.19 | 4.04 | 1.2363 | 0.0559 | |||
| FAF / First American Financial Corporation | 0.02 | -2.11 | 1.17 | -8.46 | 1.2179 | -0.1033 | |||
| CPRX / Catalyst Pharmaceuticals, Inc. | 0.05 | -36.28 | 1.16 | -42.99 | 1.2085 | -0.8968 | |||
| USPH / U.S. Physical Therapy, Inc. | 0.01 | -0.83 | 1.16 | 7.24 | 1.2049 | 0.0882 | |||
| KAI / Kadant Inc. | 0.00 | -0.84 | 1.16 | -6.55 | 1.2039 | -0.0761 | |||
| AWR / American States Water Company | 0.01 | -0.86 | 1.15 | -3.45 | 1.1961 | -0.0339 | |||
| CGNX / Cognex Corporation | 0.04 | -0.30 | 1.14 | 5.95 | 1.1889 | 0.0749 | |||
| VSTS / Vestis Corporation | 0.20 | 70.89 | 1.13 | -1.05 | 1.1766 | -0.0050 | |||
| CNS / Cohen & Steers, Inc. | 0.01 | -1.77 | 1.11 | -7.81 | 1.1577 | -0.0892 | |||
| LBRT / Liberty Energy Inc. | 0.09 | 20.32 | 1.09 | -12.71 | 1.1309 | -0.1566 | |||
| TNC / Tennant Company | 0.01 | 1.06 | 1.1019 | 1.1019 | |||||
| IOSP / Innospec Inc. | 0.01 | -1.15 | 1.02 | -12.35 | 1.0661 | -0.1411 | |||
| ASTH / Astrana Health, Inc. | 0.04 | -0.82 | 0.98 | -20.44 | 1.0231 | -0.2541 | |||
| CZNC / Citizens & Northern Corporation | 0.05 | -0.84 | 0.96 | -6.68 | 1.0053 | -0.0645 | |||
| MGPI / MGP Ingredients, Inc. | 0.03 | 79.08 | 0.95 | 82.73 | 0.9922 | 0.4527 | |||
| ZD / Ziff Davis, Inc. | 0.03 | -0.84 | 0.95 | -20.15 | 0.9916 | -0.2416 | |||
| RLI / RLI Corp. | 0.01 | -33.43 | 0.94 | -40.19 | 0.9765 | -0.6442 | |||
| BRKR / Bruker Corporation | 0.02 | 0.91 | 0.9507 | 0.9507 | |||||
| REYN / Reynolds Consumer Products Inc. | 0.04 | 0.88 | 0.9199 | 0.9199 | |||||
| HELE / Helen of Troy Limited | 0.03 | 28.89 | 0.71 | -31.64 | 0.7436 | -0.3365 | |||
| MOAT / VanEck ETF Trust - VanEck Morningstar Wide Moat ETF | 0.00 | -1.06 | 0.46 | 5.45 | 0.4838 | 0.0281 | |||
| LH / Labcorp Holdings Inc. | 0.00 | 0.00 | 0.44 | 12.69 | 0.4632 | 0.0553 | |||
| PAYC / Paycom Software, Inc. | 0.00 | -0.26 | 0.44 | 5.76 | 0.4599 | 0.0274 | |||
| ROL / Rollins, Inc. | 0.01 | 0.00 | 0.39 | 4.27 | 0.4082 | 0.0199 | |||
| SNV / Synovus Financial Corp. | 0.01 | 0.00 | 0.38 | 10.59 | 0.3926 | 0.0404 | |||
| OTIS / Otis Worldwide Corporation | 0.00 | 0.00 | 0.36 | -3.96 | 0.3796 | -0.0134 | |||
| DINO / HF Sinclair Corporation | 0.01 | 14.52 | 0.36 | 43.37 | 0.3725 | 0.1139 | |||
| ZBRA / Zebra Technologies Corporation | 0.00 | 29.89 | 0.33 | 41.70 | 0.3477 | 0.1041 | |||
| BR / Broadridge Financial Solutions, Inc. | 0.00 | 0.00 | 0.33 | 0.30 | 0.3465 | 0.0031 | |||
| TYL / Tyler Technologies, Inc. | 0.00 | 0.00 | 0.33 | 2.19 | 0.3410 | 0.0088 | |||
| CF / CF Industries Holdings, Inc. | 0.00 | 0.00 | 0.32 | 17.98 | 0.3284 | 0.0513 | |||
| JKHY / Jack Henry & Associates, Inc. | 0.00 | 0.42 | 0.30 | -0.99 | 0.3147 | -0.0008 | |||
| CPAY / Corpay, Inc. | 0.00 | -0.11 | 0.30 | -4.79 | 0.3106 | -0.0134 | |||
| JLL / Jones Lang LaSalle Incorporated | 0.00 | 0.00 | 0.30 | 3.13 | 0.3103 | 0.0116 | |||
| EGP / EastGroup Properties, Inc. | 0.00 | 0.48 | 0.28 | -4.79 | 0.2907 | -0.0122 | |||
| MTCH / Match Group, Inc. | 0.01 | 0.00 | 0.28 | -1.07 | 0.2906 | -0.0010 | |||
| DOX / Amdocs Limited | 0.00 | -0.10 | 0.28 | -0.36 | 0.2900 | 0.0008 | |||
| BAH / Booz Allen Hamilton Holding Corporation | 0.00 | 0.44 | 0.26 | 0.00 | 0.2702 | 0.0018 | |||
| MSA / MSA Safety Incorporated | 0.00 | 1.06 | 0.26 | 15.32 | 0.2675 | 0.0373 | |||
| ARE / Alexandria Real Estate Equities, Inc. | 0.00 | 0.00 | 0.25 | -21.50 | 0.2626 | -0.0697 | |||
| CHE / Chemed Corporation | 0.00 | 0.39 | 0.25 | -20.51 | 0.2588 | -0.0648 | |||
| HAL / Halliburton Company | 0.01 | 16.55 | 0.24 | -6.18 | 0.2536 | -0.0155 | |||
| WST / West Pharmaceutical Services, Inc. | 0.00 | 0.00 | 0.24 | -2.46 | 0.2488 | -0.0041 | |||
| CPB / The Campbell's Company | 0.01 | 8.12 | 0.23 | -17.20 | 0.2414 | -0.0475 | |||
| NDAQ / Nasdaq, Inc. | 0.00 | 0.23 | 0.2364 | 0.2364 | |||||
| FDS / FactSet Research Systems Inc. | 0.00 | 0.23 | 0.2349 | 0.2349 | |||||
| ICLR / ICON Public Limited Company | 0.00 | -0.48 | 0.21 | -17.19 | 0.2212 | -0.0444 | |||
| JFR / Nuveen Floating Rate Income Fund | 0.02 | 0.00 | 0.14 | 0.00 | 0.1463 | 0.0010 | |||
| EHI / Western Asset Global High Income Fund Inc. | 0.01 | 0.00 | 0.08 | -1.30 | 0.0800 | -0.0003 | |||
| HWKN / Hawkins, Inc. | 0.00 | -100.00 | 0.00 | 0.0000 | |||||
| MEDP / Medpace Holdings, Inc. | 0.00 | -100.00 | 0.00 | 0.0000 | |||||
| CLB / Core Laboratories Inc. | 0.00 | -100.00 | 0.00 | 0.0000 | |||||
| NSP / Insperity, Inc. | 0.00 | -100.00 | 0.00 | 0.0000 | |||||
| SLP / Simulations Plus, Inc. | 0.00 | -100.00 | 0.00 | 0.0000 |