Mga Batayang Estadistika
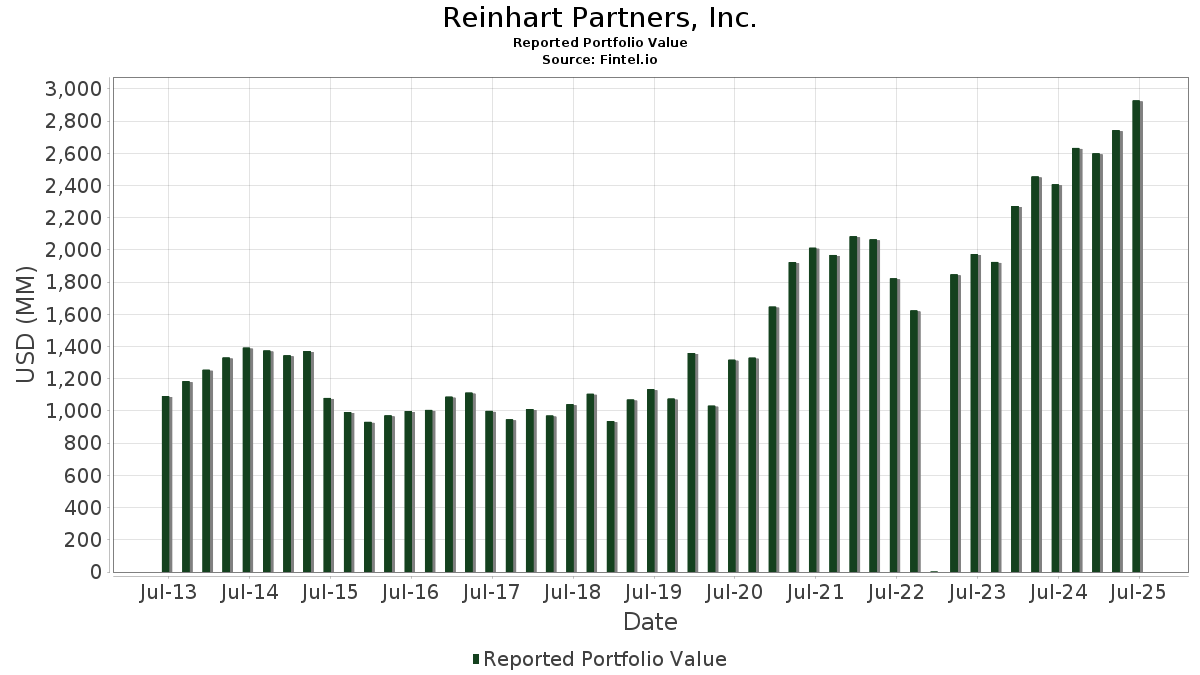
| Nilai Portofolio | $ 2,927,557,163 |
| Posisi Saat Ini | 74 |
Kepemilikan Terbaru, Kinerja, AUM (dari 13F, 13D)
Reinhart Partners, Inc. telah mengungkapkan total kepemilikan 74 dalam pengajuan SEC terbaru mereka. Nilai portofolio terbaru dihitung sebesar $ 2,927,557,163 USD. Aset yang Dikelola (AUM) sebenarnya adalah nilai ini ditambah kas (yang tidak diungkapkan). Aset-aset utama Reinhart Partners, Inc. adalah First Citizens BancShares, Inc. (US:FCNCA) , Lantheus Holdings, Inc. (US:LNTH) , Silicon Motion Technology Corporation - Depositary Receipt (Common Stock) (US:SIMO) , Frontdoor, Inc. (US:FTDR) , and Modine Manufacturing Company (US:MOD) . Posisi baru Reinhart Partners, Inc. meliputi: Independent Bank Corp. (US:INDB) , Marriott International, Inc. (US:MAR) , . Industri unggulan Reinhart Partners, Inc. adalah "Rubber And Miscellaneous Plastics Products" (sic 30) , "Railroad Transportation" (sic 40) , and "Apparel And Accessory Stores" (sic 56) .
Peningkatan Tertinggi Kuartal Ini
Kami menggunakan perubahan dalam alokasi portofolio karena ini adalah metrik yang paling bermakna. Perubahan dapat disebabkan oleh perdagangan atau perubahan harga saham.
| Keamanan | Saham (MM) |
Nilai (Juta Dolar AS) |
Portfolio % | ΔPorsyento ng Portfolio |
|---|---|---|---|---|
| 1.47 | 110.62 | 3.7786 | 1.2639 | |
| 1.09 | 107.52 | 3.6727 | 1.2222 | |
| 0.51 | 31.93 | 1.0906 | 1.0906 | |
| 1.90 | 65.54 | 2.2388 | 1.0470 | |
| 2.14 | 67.54 | 2.3071 | 1.0247 | |
| 1.52 | 105.83 | 3.6149 | 1.0056 | |
| 0.64 | 69.96 | 2.3896 | 0.6924 | |
| 0.09 | 19.08 | 0.6517 | 0.6517 | |
| 0.60 | 58.74 | 2.0064 | 0.5487 | |
| 1.65 | 37.39 | 1.2771 | 0.5103 |
Penurunan Tertinggi Kuartal Ini
Kami menggunakan perubahan dalam alokasi portofolio karena ini adalah metrik yang paling bermakna. Perubahan dapat disebabkan oleh perdagangan atau perubahan harga saham.
| Keamanan | Saham (MM) |
Nilai (Juta Dolar AS) |
Portfolio % | ΔPorsyento ng Portfolio |
|---|---|---|---|---|
| 1.79 | 107.43 | 3.6697 | -1.1578 | |
| 0.99 | 45.32 | 1.5479 | -1.0521 | |
| 1.08 | 63.34 | 2.1635 | -0.9605 | |
| 1.75 | 95.27 | 3.2543 | -0.5348 | |
| 7.31 | 68.96 | 2.3555 | -0.5041 | |
| 0.28 | 53.35 | 1.8225 | -0.4885 | |
| 0.04 | 74.90 | 2.5584 | -0.4238 | |
| 2.21 | 68.02 | 2.3233 | -0.3931 | |
| 1.40 | 114.90 | 3.9249 | -0.3659 | |
| 1.22 | 74.73 | 2.5526 | -0.3280 |
Pengajuan 13D/G
Ini adalah daftar pengajuan 13D dan 13G yang dibuat dalam setahun terakhir (jika ada). Klik ikon tautan untuk melihat riwayat transaksi lengkap. Baris berwarna hijau menunjukkan posisi baru. Baris berwarna merah menunjukkan posisi yang sudah ditutup.
| Tanggal File | Formulir | Keamanan | Sebelumnya Saham |
Saat ini Saham |
ΔPersentase Saham | % Kepemilikan |
% ΔKepemilikan | |
|---|---|---|---|---|---|---|---|---|
| 2025-08-05 | HLMN / Hillman Solutions Corp. | 10,053,219 | 5.10 | |||||
| 2025-05-15 | AHCO / AdaptHealth Corp. | 7,236,262 | 5.40 | |||||
| 2025-05-15 | MMI / Marcus & Millichap, Inc. | 2,162,935 | 5.60 |
Pengajuan 13F dan Dana
Formulir ini diajukan pada 2025-07-09 untuk periode pelaporan 2025-06-30. Klik ikon tautan untuk melihat riwayat transaksi selengkapnya.
Tingkatkan ke versi premium untuk membuka data premium dan ekspor ke Excel. ![]() .
.
| Keamanan | Ketik | Harga Saham Rata-rata | Saham (MM) |
ΔSaham (%) |
ΔSaham (%) |
Nilai ($MM) |
Portpolyo (%) |
ΔPortofolio (%) |
|
|---|---|---|---|---|---|---|---|---|---|
| FCNCA / First Citizens BancShares, Inc. | 0.07 | 4.24 | 135.58 | 10.02 | 4.6310 | 0.1388 | |||
| LNTH / Lantheus Holdings, Inc. | 1.40 | 16.40 | 114.90 | -2.37 | 3.9249 | -0.3659 | |||
| SIMO / Silicon Motion Technology Corporation - Depositary Receipt (Common Stock) | 1.47 | 7.86 | 110.62 | 60.37 | 3.7786 | 1.2639 | |||
| FTDR / Frontdoor, Inc. | 1.87 | -20.90 | 110.44 | 21.35 | 3.7723 | 0.4547 | |||
| MOD / Modine Manufacturing Company | 1.09 | 24.63 | 107.52 | 59.95 | 3.6727 | 1.2222 | |||
| NSP / Insperity, Inc. | 1.79 | 20.41 | 107.43 | -18.87 | 3.6697 | -1.1578 | |||
| ACLS / Axcelis Technologies, Inc. | 1.52 | 5.38 | 105.83 | 47.86 | 3.6149 | 1.0056 | |||
| AGO / Assured Guaranty Ltd. | 1.14 | 0.32 | 99.16 | -0.82 | 3.3870 | -0.2577 | |||
| UHALB / U-Haul Holding Company - Series N | 1.75 | -0.23 | 95.27 | -8.34 | 3.2543 | -0.5348 | |||
| WTFC / Wintrust Financial Corporation | 0.75 | 12.21 | 93.17 | 23.71 | 3.1825 | 0.4368 | |||
| IDCC / InterDigital, Inc. | 0.41 | -0.27 | 91.78 | 8.16 | 3.1352 | 0.0416 | |||
| EEFT / Euronet Worldwide, Inc. | 0.90 | 21.60 | 91.03 | 15.38 | 3.1095 | 0.2333 | |||
| WTM / White Mountains Insurance Group, Ltd. | 0.04 | -1.85 | 74.90 | -8.44 | 2.5584 | -0.4238 | |||
| FAF / First American Financial Corporation | 1.22 | 1.10 | 74.73 | -5.43 | 2.5526 | -0.3280 | |||
| HLMN / Hillman Solutions Corp. | 10.05 | 16.10 | 71.78 | -5.70 | 2.4519 | -0.3229 | |||
| GMS / GMS Inc. | 0.64 | 1.10 | 69.96 | 50.27 | 2.3896 | 0.6924 | |||
| AHCO / AdaptHealth Corp. | 7.31 | 1.06 | 68.96 | -12.09 | 2.3555 | -0.5041 | |||
| MMI / Marcus & Millichap, Inc. | 2.21 | 2.40 | 68.02 | -8.72 | 2.3233 | -0.3931 | |||
| YETI / YETI Holdings, Inc. | 2.14 | 101.63 | 67.54 | 92.01 | 2.3071 | 1.0247 | |||
| FORM / FormFactor, Inc. | 1.90 | 64.82 | 65.54 | 100.48 | 2.2388 | 1.0470 | |||
| MMS / Maximus, Inc. | 0.91 | 0.26 | 64.15 | 3.21 | 2.1914 | -0.0745 | |||
| AL / Air Lease Corporation | 1.08 | -38.95 | 63.34 | -26.09 | 2.1635 | -0.9605 | |||
| PAR / PAR Technology Corporation | 0.88 | 2.90 | 61.31 | 16.38 | 2.0942 | 0.1737 | |||
| LSTR / Landstar System, Inc. | 0.43 | 49.21 | 59.23 | 38.10 | 2.0232 | 0.4597 | |||
| RHP / Ryman Hospitality Properties, Inc. | 0.60 | 36.14 | 58.74 | 46.90 | 2.0064 | 0.5487 | |||
| FHB / First Hawaiian, Inc. | 2.34 | 0.75 | 58.49 | 2.89 | 1.9979 | -0.0744 | |||
| EHC / Encompass Health Corporation | 0.45 | -19.51 | 55.57 | -2.54 | 1.8981 | -0.1805 | |||
| SKWD / Skyward Specialty Insurance Group, Inc. | 0.96 | 1.55 | 55.42 | 10.89 | 1.8932 | 0.0712 | |||
| LOPE / Grand Canyon Education, Inc. | 0.28 | -22.96 | 53.35 | -15.84 | 1.8225 | -0.4885 | |||
| IBOC / International Bancshares Corporation | 0.79 | 1.38 | 52.48 | 7.01 | 1.7926 | 0.0047 | |||
| ASGN / ASGN Incorporated | 1.02 | 53.07 | 50.90 | 21.27 | 1.7386 | 0.2086 | |||
| ACIW / ACI Worldwide, Inc. | 0.99 | -24.28 | 45.32 | -36.46 | 1.5479 | -1.0521 | |||
| ESI / Element Solutions Inc | 1.65 | 77.44 | 37.39 | 77.75 | 1.2771 | 0.5103 | |||
| GXO / GXO Logistics, Inc. | 0.72 | -0.57 | 35.16 | 23.92 | 1.2009 | 0.1666 | |||
| INDB / Independent Bank Corp. | 0.51 | 31.93 | 1.0906 | 1.0906 | |||||
| IWM / iShares Trust - iShares Russell 2000 ETF | 0.09 | 19.08 | 0.6517 | 0.6517 | |||||
| PAYC / Paycom Software, Inc. | 0.06 | -8.55 | 14.79 | -3.14 | 0.5052 | -0.0515 | |||
| VVX / V2X, Inc. | 0.29 | 14.08 | 0.4811 | 0.4811 | |||||
| TPR / Tapestry, Inc. | 0.15 | 17.56 | 12.90 | 46.62 | 0.4406 | 0.1199 | |||
| AMG / Affiliated Managers Group, Inc. | 0.06 | -8.30 | 12.67 | 7.39 | 0.4329 | 0.0026 | |||
| SSNC / SS&C Technologies Holdings, Inc. | 0.14 | -8.09 | 11.21 | -8.89 | 0.3829 | -0.0656 | |||
| TRU / TransUnion | 0.13 | -6.43 | 11.16 | -0.77 | 0.3812 | -0.0288 | |||
| LPLA / LPL Financial Holdings Inc. | 0.03 | -8.91 | 11.14 | 4.41 | 0.3806 | -0.0084 | |||
| MTB / M&T Bank Corporation | 0.05 | -8.72 | 10.01 | -0.93 | 0.3420 | -0.0264 | |||
| LYV / Live Nation Entertainment, Inc. | 0.06 | -8.27 | 9.74 | 6.27 | 0.3327 | -0.0014 | |||
| MCHP / Microchip Technology Incorporated | 0.13 | -5.48 | 9.03 | 37.40 | 0.3086 | 0.0689 | |||
| LKQ / LKQ Corporation | 0.24 | -7.97 | 8.95 | -19.94 | 0.3059 | -0.1019 | |||
| REXR / Rexford Industrial Realty, Inc. | 0.25 | -7.67 | 8.92 | -16.11 | 0.3048 | -0.0830 | |||
| FIS / Fidelity National Information Services, Inc. | 0.11 | -7.79 | 8.75 | 0.52 | 0.2989 | -0.0185 | |||
| CPT / Camden Property Trust | 0.08 | -7.96 | 8.71 | -15.20 | 0.2976 | -0.0769 | |||
| KEYS / Keysight Technologies, Inc. | 0.05 | 28.90 | 8.60 | 41.03 | 0.2937 | 0.0714 | |||
| XEL / Xcel Energy Inc. | 0.12 | -8.11 | 8.45 | -11.60 | 0.2886 | -0.0598 | |||
| ALSN / Allison Transmission Holdings, Inc. | 0.09 | -8.53 | 8.38 | -9.18 | 0.2864 | -0.0502 | |||
| ST / Sensata Technologies Holding plc | 0.27 | -6.07 | 8.23 | 16.54 | 0.2811 | 0.0237 | |||
| FNF / Fidelity National Financial, Inc. | 0.15 | -6.86 | 8.21 | -19.77 | 0.2805 | -0.0926 | |||
| BKR / Baker Hughes Company | 0.21 | -7.95 | 8.18 | -19.69 | 0.2795 | -0.0919 | |||
| ICE / Intercontinental Exchange, Inc. | 0.04 | -8.45 | 7.93 | -2.64 | 0.2710 | -0.0260 | |||
| AVTR / Avantor, Inc. | 0.57 | -7.70 | 7.65 | -23.36 | 0.2613 | -0.1026 | |||
| EXP / Eagle Materials Inc. | 0.04 | -5.90 | 7.52 | -14.30 | 0.2568 | -0.0630 | |||
| DG / Dollar General Corporation | 0.06 | -4.90 | 7.40 | 23.70 | 0.2526 | 0.0347 | |||
| AOS / A. O. Smith Corporation | 0.11 | 7.16 | 0.2447 | 0.2447 | |||||
| CTSH / Cognizant Technology Solutions Corporation | 0.09 | -9.16 | 7.07 | -7.35 | 0.2415 | -0.0367 | |||
| COLD / Americold Realty Trust, Inc. | 0.41 | -7.52 | 6.81 | -28.33 | 0.2328 | -0.1139 | |||
| AFG / American Financial Group, Inc. | 0.05 | -8.97 | 6.79 | -12.52 | 0.2320 | -0.0510 | |||
| ZBH / Zimmer Biomet Holdings, Inc. | 0.07 | -8.11 | 6.73 | -25.95 | 0.2299 | -0.1014 | |||
| BOKF / BOK Financial Corporation | 0.07 | -7.46 | 6.64 | -13.26 | 0.2268 | -0.0522 | |||
| GPN / Global Payments Inc. | 0.07 | -10.30 | 5.89 | -26.69 | 0.2013 | -0.0917 | |||
| PGR / The Progressive Corporation | 0.02 | -33.09 | 4.95 | -36.90 | 0.1691 | -0.1169 | |||
| BJ / BJ's Wholesale Club Holdings, Inc. | 0.04 | -29.09 | 4.64 | -32.99 | 0.1584 | -0.0939 | |||
| MAR / Marriott International, Inc. | 0.01 | 3.91 | 0.1336 | 0.1336 | |||||
| SNA / Snap-on Incorporated | 0.01 | -7.83 | 3.87 | -14.89 | 0.1322 | -0.0336 | |||
| WSC / WillScot Holdings Corporation | 0.10 | -5.73 | 2.76 | -7.07 | 0.0943 | -0.0140 | |||
| IVV / iShares Trust - iShares Core S&P 500 ETF | 0.00 | 0.00 | 1.39 | 10.47 | 0.0476 | 0.0016 | |||
| SPSB / SPDR Series Trust - SPDR Portfolio Short Term Corporate Bond ETF | 0.01 | 0.00 | 0.29 | 0.35 | 0.0098 | -0.0006 | |||
| THO / THOR Industries, Inc. | 0.00 | -100.00 | 0.00 | 0.0000 | |||||
| SFM / Sprouts Farmers Market, Inc. | 0.00 | -100.00 | 0.00 | 0.0000 | |||||
| AMN / AMN Healthcare Services, Inc. | 0.00 | -100.00 | 0.00 | 0.0000 | |||||
| PINC / Premier, Inc. | 0.00 | -100.00 | 0.00 | 0.0000 | |||||
| IWN / iShares Trust - iShares Russell 2000 Value ETF | 0.00 | -100.00 | 0.00 | 0.0000 | |||||
| CRL / Charles River Laboratories International, Inc. | 0.00 | -100.00 | 0.00 | 0.0000 | |||||
| FMC / FMC Corporation | 0.00 | -100.00 | 0.00 | 0.0000 | |||||
| ALEX / Alexander & Baldwin, Inc. | 0.00 | -100.00 | 0.00 | 0.0000 |