Mga Batayang Estadistika
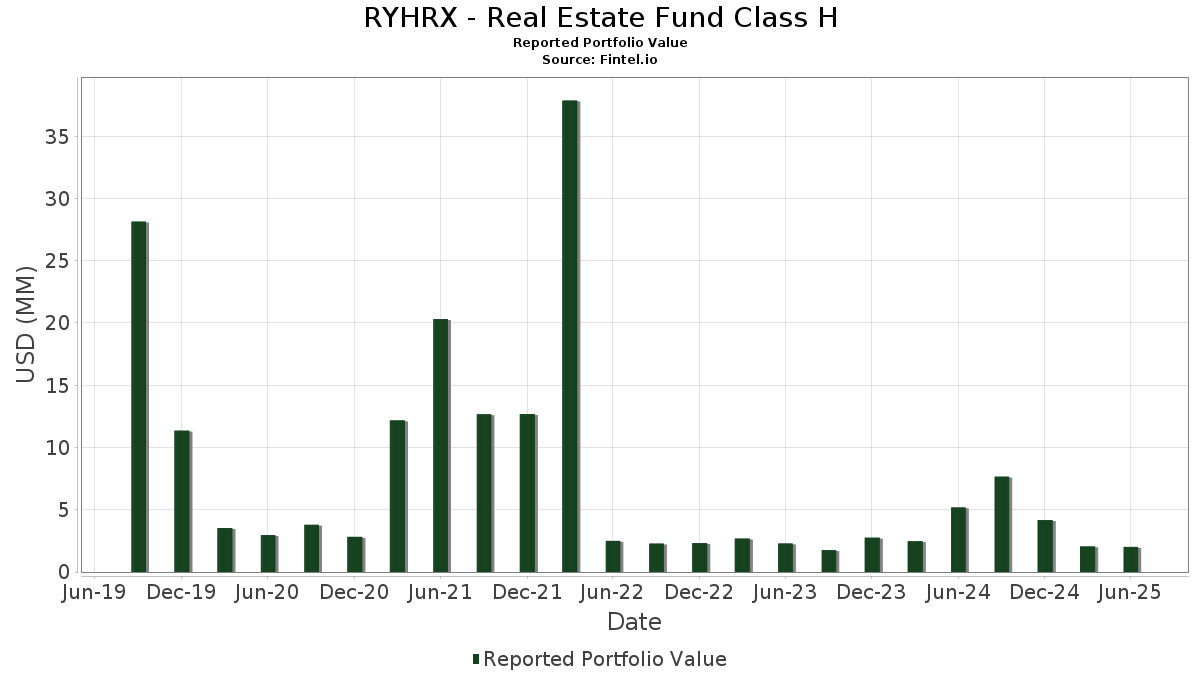
| Nilai Portofolio | $ 2,014,501 |
| Posisi Saat Ini | 95 |
Kepemilikan Terbaru, Kinerja, AUM (dari 13F, 13D)
RYHRX - Real Estate Fund Class H telah mengungkapkan total kepemilikan 95 dalam pengajuan SEC terbaru mereka. Nilai portofolio terbaru dihitung sebesar $ 2,014,501 USD. Aset yang Dikelola (AUM) sebenarnya adalah nilai ini ditambah kas (yang tidak diungkapkan). Aset-aset utama RYHRX - Real Estate Fund Class H adalah American Tower Corporation (US:AMT) , Welltower Inc. (US:WELL) , Prologis, Inc. (US:PLD) , Digital Realty Trust, Inc. (US:DLR) , and Realty Income Corporation (US:O) .
Peningkatan Tertinggi Kuartal Ini
Kami menggunakan perubahan dalam alokasi portofolio karena ini adalah metrik yang paling bermakna. Perubahan dapat disebabkan oleh perdagangan atau perubahan harga saham.
| Keamanan | Saham (MM) |
Nilai (Juta Dolar AS) |
Portfolio % | ΔPorsyento ng Portfolio |
|---|---|---|---|---|
| 0.08 | 0.08 | 3.9305 | 3.9305 | |
| 0.00 | 0.05 | 2.5660 | 0.3053 | |
| 0.00 | 0.04 | 1.8371 | 0.1807 | |
| 0.00 | 0.1150 | 0.1150 | ||
| 0.00 | 0.02 | 0.8282 | 0.0961 | |
| 0.00 | 0.02 | 0.8227 | 0.0877 | |
| 0.01 | 0.00 | 0.1831 | 0.0756 | |
| 0.00 | 0.02 | 1.0822 | 0.0754 | |
| 0.00 | 0.02 | 0.8378 | 0.0749 | |
| 0.00 | 0.01 | 0.3980 | 0.0685 |
Penurunan Tertinggi Kuartal Ini
Kami menggunakan perubahan dalam alokasi portofolio karena ini adalah metrik yang paling bermakna. Perubahan dapat disebabkan oleh perdagangan atau perubahan harga saham.
| Keamanan | Saham (MM) |
Nilai (Juta Dolar AS) |
Portfolio % | ΔPorsyento ng Portfolio |
|---|---|---|---|---|
| 0.00 | 0.04 | 2.2926 | -0.6200 | |
| 0.00 | 0.01 | 0.7483 | -0.2306 | |
| 0.00 | 0.02 | 0.9083 | -0.1126 | |
| 0.00 | 0.01 | 0.4425 | -0.1092 | |
| 0.00 | 0.03 | 1.4108 | -0.1030 | |
| 0.00 | 0.01 | 0.6128 | -0.1006 | |
| 0.00 | 0.01 | 0.7172 | -0.0962 | |
| 0.00 | 0.01 | 0.6388 | -0.0962 | |
| 0.00 | 0.03 | 1.3864 | -0.0936 | |
| 0.00 | 0.01 | 0.5264 | -0.0932 |
Pengajuan 13F dan Dana
Formulir ini diajukan pada 2025-08-27 untuk periode pelaporan 2025-06-30. Klik ikon tautan untuk melihat riwayat transaksi selengkapnya.
Tingkatkan ke versi premium untuk membuka data premium dan ekspor ke Excel. ![]() .
.
| Keamanan | Ketik | Harga Saham Rata-rata | Saham (MM) |
ΔSaham (%) |
ΔSaham (%) |
Nilai ($MM) |
Portpolyo (%) |
ΔPortofolio (%) |
|
|---|---|---|---|---|---|---|---|---|---|
| First American Government Obligations Fund - Class X / STIV (N/A) | 0.08 | 0.08 | 3.9305 | 3.9305 | |||||
| AMT / American Tower Corporation | 0.00 | -3.49 | 0.07 | -1.47 | 3.4580 | 0.0572 | |||
| WELL / Welltower Inc. | 0.00 | -2.73 | 0.07 | -2.99 | 3.3863 | 0.0416 | |||
| PLD / Prologis, Inc. | 0.00 | 1.16 | 0.06 | -4.48 | 3.3110 | -0.0446 | |||
| DLR / Digital Realty Trust, Inc. | 0.00 | -10.06 | 0.05 | 8.89 | 2.5660 | 0.3053 | |||
| O / Realty Income Corporation | 0.00 | -1.68 | 0.05 | -2.08 | 2.4224 | 0.0306 | |||
| SPG / Simon Property Group, Inc. | 0.00 | -0.68 | 0.05 | -4.17 | 2.4077 | -0.0067 | |||
| PSA / Public Storage | 0.00 | -1.30 | 0.04 | -4.35 | 2.2954 | 0.0086 | |||
| EQIX / Equinix, Inc. | 0.00 | -22.22 | 0.04 | -24.14 | 2.2926 | -0.6200 | |||
| CCI / Crown Castle Inc. | 0.00 | -3.79 | 0.04 | -4.35 | 2.2841 | -0.0379 | |||
| CBRE / CBRE Group, Inc. | 0.00 | -8.51 | 0.04 | -2.33 | 2.1707 | 0.0359 | |||
| VICI / VICI Properties Inc. | 0.00 | -0.92 | 0.04 | 0.00 | 1.9781 | 0.0522 | |||
| CSGP / CoStar Group, Inc. | 0.00 | -5.74 | 0.04 | -5.26 | 1.9034 | -0.0149 | |||
| EXR / Extra Space Storage Inc. | 0.00 | -2.39 | 0.04 | -2.70 | 1.8591 | 0.0099 | |||
| IRM / Iron Mountain Incorporated | 0.00 | -10.31 | 0.04 | 6.06 | 1.8371 | 0.1807 | |||
| VTR / Ventas, Inc. | 0.00 | 2.80 | 0.03 | -5.56 | 1.7876 | -0.0376 | |||
| AVB / AvalonBay Communities, Inc. | 0.00 | -0.58 | 0.03 | -5.56 | 1.7805 | -0.0404 | |||
| EQR / Equity Residential | 0.00 | -2.07 | 0.03 | -8.82 | 1.6430 | -0.0724 | |||
| SBAC / SBA Communications Corporation | 0.00 | -12.08 | 0.03 | -6.25 | 1.5833 | -0.0431 | |||
| INVH / Invitation Homes Inc. | 0.00 | -2.53 | 0.03 | -10.00 | 1.4315 | -0.0728 | |||
| WY / Weyerhaeuser Company | 0.00 | 2.40 | 0.03 | -10.00 | 1.4108 | -0.1030 | |||
| MAA / Mid-America Apartment Communities, Inc. | 0.00 | 2.25 | 0.03 | -10.34 | 1.3864 | -0.0936 | |||
| SUI / Sun Communities, Inc. | 0.00 | -0.48 | 0.03 | 0.00 | 1.3541 | 0.0201 | |||
| Z / Zillow Group, Inc. | 0.00 | -5.29 | 0.03 | 0.00 | 1.2907 | 0.0049 | |||
| KIM / Kimco Realty Corporation | 0.00 | -2.11 | 0.02 | -4.00 | 1.2549 | 0.0061 | |||
| WPC / W. P. Carey Inc. | 0.00 | -1.03 | 0.02 | -4.17 | 1.2296 | 0.0178 | |||
| REG / Regency Centers Corporation | 0.00 | -0.59 | 0.02 | -4.17 | 1.2281 | -0.0052 | |||
| UDR / UDR, Inc. | 0.00 | 0.00 | 0.02 | -11.54 | 1.2188 | -0.0811 | |||
| ARE / Alexandria Real Estate Equities, Inc. | 0.00 | 14.86 | 0.02 | -8.00 | 1.1850 | -0.0819 | |||
| LAMR / Lamar Advertising Company | 0.00 | -5.03 | 0.02 | 0.00 | 1.1805 | 0.0571 | |||
| DOC / Healthpeak Properties, Inc. | 0.00 | 6.70 | 0.02 | -8.33 | 1.1769 | -0.0510 | |||
| GLPI / Gaming and Leisure Properties, Inc. | 0.00 | 1.46 | 0.02 | -8.33 | 1.1724 | -0.0423 | |||
| CPT / Camden Property Trust | 0.00 | -1.51 | 0.02 | -8.33 | 1.1368 | -0.0708 | |||
| AMH / American Homes 4 Rent | 0.00 | -3.80 | 0.02 | -8.70 | 1.1268 | -0.0569 | |||
| OHI / Omega Healthcare Investors, Inc. | 0.00 | 1.22 | 0.02 | 0.00 | 1.0997 | 0.0114 | |||
| ELS / Equity LifeStyle Properties, Inc. | 0.00 | 1.79 | 0.02 | -4.55 | 1.0855 | -0.0265 | |||
| HST / Host Hotels & Resorts, Inc. | 0.00 | -4.13 | 0.02 | 5.00 | 1.0822 | 0.0754 | |||
| BXP / Boston Properties, Inc. | 0.00 | -3.18 | 0.02 | -4.76 | 1.0556 | 0.0089 | |||
| CUBE / CubeSmart | 0.00 | -2.07 | 0.02 | 0.00 | 1.0368 | 0.0112 | |||
| NNN / NNN REIT, Inc. | 0.00 | -1.59 | 0.02 | 0.00 | 0.9645 | 0.0313 | |||
| REXR / Rexford Industrial Realty, Inc. | 0.00 | 4.19 | 0.02 | -5.26 | 0.9556 | -0.0176 | |||
| FRT / Federal Realty Investment Trust | 0.00 | -1.02 | 0.02 | -5.26 | 0.9533 | -0.0028 | |||
| BRX / Brixmor Property Group Inc. | 0.00 | -1.25 | 0.02 | -5.26 | 0.9502 | 0.0044 | |||
| ESS / Essex Property Trust, Inc. | 0.00 | -1.52 | 0.02 | -10.00 | 0.9481 | -0.0558 | |||
| ADC / Agree Realty Corporation | 0.00 | 1.22 | 0.02 | 0.00 | 0.9363 | -0.0059 | |||
| JLL / Jones Lang LaSalle Incorporated | 0.00 | -16.87 | 0.02 | -15.00 | 0.9083 | -0.1126 | |||
| STAG / STAG Industrial, Inc. | 0.00 | -1.88 | 0.02 | 0.00 | 0.8795 | 0.0192 | |||
| VNO / Vornado Realty Trust | 0.00 | -7.74 | 0.02 | -5.88 | 0.8443 | -0.0091 | |||
| EPRT / Essential Properties Realty Trust, Inc. | 0.00 | 0.59 | 0.02 | 0.00 | 0.8441 | 0.0166 | |||
| CTRE / CareTrust REIT, Inc. | 0.00 | -1.12 | 0.02 | 6.67 | 0.8378 | 0.0749 | |||
| FR / First Industrial Realty Trust, Inc. | 0.00 | 4.02 | 0.02 | -5.88 | 0.8323 | -0.0324 | |||
| AHR / American Healthcare REIT, Inc. | 0.00 | -10.06 | 0.02 | 14.29 | 0.8282 | 0.0961 | |||
| RHP / Ryman Hospitality Properties, Inc. | 0.00 | 0.00 | 0.02 | 7.14 | 0.8227 | 0.0877 | |||
| HR / Healthcare Realty Trust Incorporated | 0.00 | 5.46 | 0.02 | -6.25 | 0.8203 | 0.0213 | |||
| TRNO / Terreno Realty Corporation | 0.00 | 6.69 | 0.02 | -6.25 | 0.7820 | -0.0147 | |||
| CUZ / Cousins Properties Incorporated | 0.00 | -4.72 | 0.01 | -6.67 | 0.7496 | 0.0046 | |||
| KRG / Kite Realty Group Trust | 0.00 | -3.16 | 0.01 | 0.00 | 0.7496 | 0.0126 | |||
| EGP / EastGroup Properties, Inc. | 0.00 | -22.32 | 0.01 | -26.32 | 0.7483 | -0.2306 | |||
| PECO / Phillips Edison & Company, Inc. | 0.00 | -2.62 | 0.01 | -6.67 | 0.7374 | -0.0230 | |||
| COLD / Americold Realty Trust, Inc. | 0.00 | 9.69 | 0.01 | -18.75 | 0.7172 | -0.0962 | |||
| EPR / EPR Properties | 0.00 | -6.75 | 0.01 | 0.00 | 0.7046 | 0.0468 | |||
| SBRA / Sabra Health Care REIT, Inc. | 0.00 | -4.52 | 0.01 | 0.00 | 0.7023 | 0.0305 | |||
| SLG / SL Green Realty Corp. | 0.00 | -8.82 | 0.01 | 0.00 | 0.6913 | 0.0100 | |||
| MAC / The Macerich Company | 0.00 | 0.12 | 0.01 | -7.14 | 0.6820 | -0.0148 | |||
| IRT / Independence Realty Trust, Inc. | 0.00 | 4.57 | 0.01 | -14.29 | 0.6664 | -0.0709 | |||
| KRC / Kilroy Realty Corporation | 0.00 | -6.28 | 0.01 | -7.69 | 0.6587 | 0.0117 | |||
| NSA / National Storage Affiliates Trust | 0.00 | 3.19 | 0.01 | -14.29 | 0.6388 | -0.0962 | |||
| SKT / Tanger Inc. | 0.00 | 2.05 | 0.01 | -7.69 | 0.6264 | -0.0274 | |||
| COMP / Compass, Inc. | 0.00 | 15.12 | 0.01 | -21.43 | 0.6128 | -0.1006 | |||
| HIW / Highwoods Properties, Inc. | 0.00 | -7.14 | 0.01 | -8.33 | 0.6032 | 0.0062 | |||
| CDP / COPT Defense Properties | 0.00 | -4.22 | 0.01 | 0.00 | 0.5806 | 0.0028 | |||
| BNL / Broadstone Net Lease, Inc. | 0.00 | 1.75 | 0.01 | 0.00 | 0.5766 | -0.0034 | |||
| NMRK / Newmark Group, Inc. | 0.00 | 2.33 | 0.01 | 10.00 | 0.5759 | 0.0325 | |||
| PCH / PotlatchDeltic Corporation | 0.00 | 4.73 | 0.01 | -8.33 | 0.5687 | -0.0469 | |||
| 2IY / Cushman & Wakefield plc | 0.00 | -4.44 | 0.01 | 0.00 | 0.5390 | 0.0370 | |||
| APLE / Apple Hospitality REIT, Inc. | 0.00 | 4.99 | 0.01 | 0.00 | 0.5303 | -0.0083 | |||
| LINE / Lineage, Inc. | 0.00 | 10.33 | 0.01 | -16.67 | 0.5264 | -0.0932 | |||
| DEI / Douglas Emmett, Inc. | 0.00 | -0.44 | 0.01 | 0.00 | 0.5233 | -0.0158 | |||
| OUT / OUTFRONT Media Inc. | 0.00 | -2.50 | 0.01 | 0.00 | 0.5233 | 0.0116 | |||
| UE / Urban Edge Properties | 0.00 | -1.47 | 0.01 | 0.00 | 0.5157 | 0.0019 | |||
| AKR / Acadia Realty Trust | 0.00 | 8.10 | 0.01 | -10.00 | 0.5104 | -0.0031 | |||
| LXP / LXP Industrial Trust | 0.00 | 0.93 | 0.01 | -10.00 | 0.5067 | -0.0001 | |||
| PK / Park Hotels & Resorts Inc. | 0.00 | 1.05 | 0.01 | -11.11 | 0.4581 | 0.0018 | |||
| MPW / Medical Properties Trust, Inc. | 0.00 | 8.19 | 0.01 | -27.27 | 0.4425 | -0.1092 | |||
| SHO / Sunstone Hotel Investors, Inc. | 0.00 | 2.64 | 0.01 | 0.00 | 0.4342 | -0.0079 | |||
| DRH / DiamondRock Hospitality Company | 0.00 | -0.38 | 0.01 | 0.00 | 0.4175 | 0.0103 | |||
| RDFN / Redfin Corporation | 0.00 | -4.16 | 0.01 | 16.67 | 0.3980 | 0.0685 | |||
| PEB / Pebblebrook Hotel Trust | 0.00 | 3.99 | 0.01 | 0.00 | 0.3748 | 0.0225 | |||
| UNIT / Unity Group LLC | 0.00 | -7.66 | 0.01 | -14.29 | 0.3135 | -0.0684 | |||
| EXPI / eXp World Holdings, Inc. | 0.00 | 1.16 | 0.01 | 0.00 | 0.2866 | -0.0069 | |||
| SITC / SITE Centers Corp. | 0.00 | 4.67 | 0.00 | -20.00 | 0.2480 | -0.0113 | |||
| OPEN / Opendoor Technologies Inc. | 0.01 | 214.37 | 0.00 | 50.00 | 0.1831 | 0.0756 | |||
| DE000C4SA6R6 / EURO STOXX 50 Index | 0.00 | 0.1150 | 0.1150 | ||||||
| Barclays Capital, Inc. / RA (N/A) | 0.00 | 0.0496 | 0.0496 | ||||||
| BofA Securities, Inc. / RA (N/A) | 0.00 | 0.0479 | 0.0479 |