Mga Batayang Estadistika
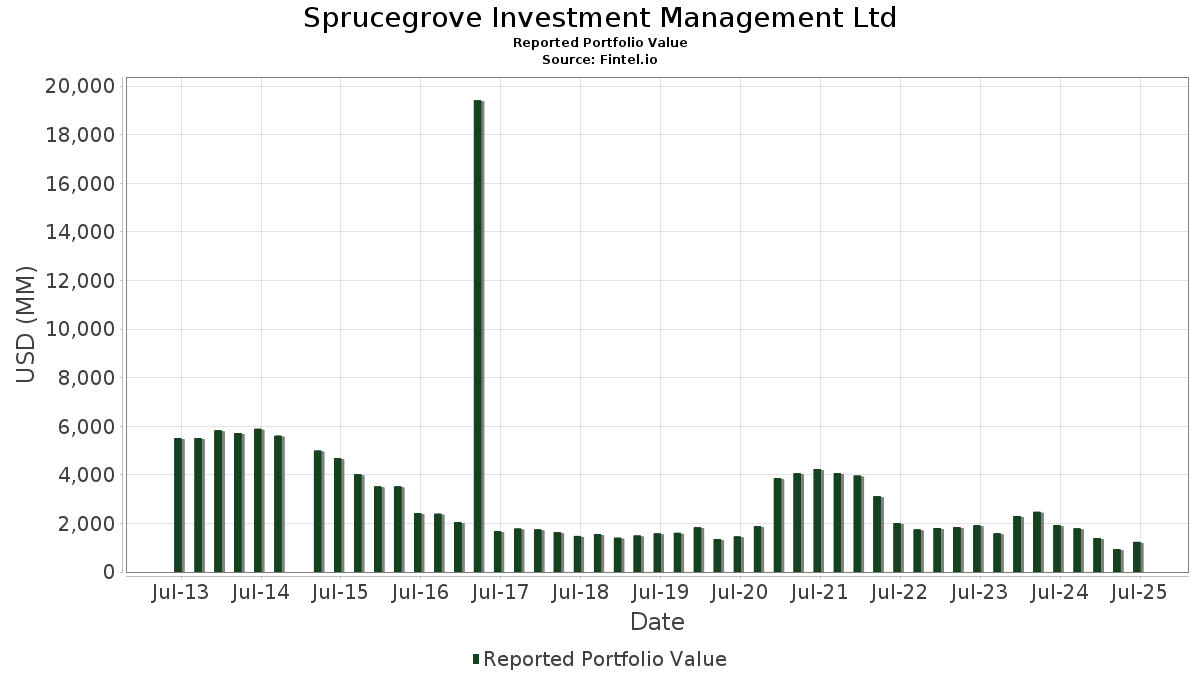
| Nilai Portofolio | $ 1,237,665,914 |
| Posisi Saat Ini | 43 |
Kepemilikan Terbaru, Kinerja, AUM (dari 13F, 13D)
Sprucegrove Investment Management Ltd telah mengungkapkan total kepemilikan 43 dalam pengajuan SEC terbaru mereka. Nilai portofolio terbaru dihitung sebesar $ 1,237,665,914 USD. Aset yang Dikelola (AUM) sebenarnya adalah nilai ini ditambah kas (yang tidak diungkapkan). Aset-aset utama Sprucegrove Investment Management Ltd adalah Ryanair Holdings plc - Depositary Receipt (Common Stock) (US:RYAAY) , Copa Holdings, S.A. (US:CPA) , Samsung Electronics Co., Ltd. - Depositary Receipt (Common Stock) (GB:BC94) , Commercial International Bank Egypt (CIB) S.A.E. - Depositary Receipt (Common Stock) (GB:CBKD) , and Markel Group Inc. (US:MKL) . Posisi baru Sprucegrove Investment Management Ltd meliputi: Dollar General Corporation (US:DG) , Littelfuse, Inc. (US:LFUS) , BOK Financial Corporation (US:BOKF) , Acuity Inc. (US:AYI) , and Cognex Corporation (US:CGNX) . Industri unggulan Sprucegrove Investment Management Ltd adalah "Wholesale Trade-non-durable Goods" (sic 51) , "Motor Freight Transportation And Warehousing" (sic 42) , and "Paper And Allied Products" (sic 26) .
Peningkatan Tertinggi Kuartal Ini
Kami menggunakan perubahan dalam alokasi portofolio karena ini adalah metrik yang paling bermakna. Perubahan dapat disebabkan oleh perdagangan atau perubahan harga saham.
| Keamanan | Saham (MM) |
Nilai (Juta Dolar AS) |
Portfolio % | ΔPorsyento ng Portfolio |
|---|---|---|---|---|
| 6.01 | 346.67 | 28.0097 | 9.5864 | |
| 2.53 | 278.63 | 22.5129 | 1.7216 | |
| 0.17 | 183.40 | 14.8181 | 0.4895 | |
| 0.04 | 4.43 | 0.3579 | 0.3579 | |
| 0.06 | 4.42 | 0.3575 | 0.1916 | |
| 0.12 | 4.28 | 0.3455 | 0.1812 | |
| 0.00 | 0.16 | 0.0128 | 0.0128 | |
| 0.00 | 0.13 | 0.0103 | 0.0103 | |
| 0.00 | 0.12 | 0.0098 | 0.0098 | |
| 0.00 | 0.12 | 0.0096 | 0.0096 |
Penurunan Tertinggi Kuartal Ini
Kami menggunakan perubahan dalam alokasi portofolio karena ini adalah metrik yang paling bermakna. Perubahan dapat disebabkan oleh perdagangan atau perubahan harga saham.
| Keamanan | Saham (MM) |
Nilai (Juta Dolar AS) |
Portfolio % | ΔPorsyento ng Portfolio |
|---|---|---|---|---|
| 21.21 | 35.64 | 2.8794 | -1.5471 | |
| 0.04 | 21.67 | 1.7512 | -1.0265 | |
| 0.10 | 14.69 | 1.1872 | -0.7818 | |
| 0.19 | 20.57 | 1.6623 | -0.7714 | |
| 0.46 | 12.28 | 0.9919 | -0.5897 | |
| 0.05 | 9.14 | 0.7386 | -0.5835 | |
| 0.01 | 24.35 | 1.9671 | -0.5715 | |
| 0.15 | 14.64 | 1.1829 | -0.5139 | |
| 0.08 | 12.54 | 1.0131 | -0.4670 | |
| 0.30 | 21.76 | 1.7582 | -0.4506 |
Pengajuan 13D/G
Ini adalah daftar pengajuan 13D dan 13G yang dibuat dalam setahun terakhir (jika ada). Klik ikon tautan untuk melihat riwayat transaksi lengkap. Baris berwarna hijau menunjukkan posisi baru. Baris berwarna merah menunjukkan posisi yang sudah ditutup.
| Tanggal File | Formulir | Keamanan | Sebelumnya Saham |
Saat ini Saham |
ΔPersentase Saham | % Kepemilikan |
% ΔKepemilikan | |
|---|---|---|---|---|---|---|---|---|
| 2025-08-06 | CPA / Copa Holdings, S.A. | 3,079,532 | 2,533,736 | -17.72 | 8.38 | -13.43 |
Pengajuan 13F dan Dana
Formulir ini diajukan pada 2025-08-06 untuk periode pelaporan 2025-06-30. Klik ikon tautan untuk melihat riwayat transaksi selengkapnya.
Tingkatkan ke versi premium untuk membuka data premium dan ekspor ke Excel. ![]() .
.
| Keamanan | Ketik | Harga Saham Rata-rata | Saham (MM) |
ΔSaham (%) |
ΔSaham (%) |
Nilai ($MM) |
Portpolyo (%) |
ΔPortofolio (%) |
|
|---|---|---|---|---|---|---|---|---|---|
| RYAAY / Ryanair Holdings plc - Depositary Receipt (Common Stock) | 6.01 | -19.02 | 346.67 | 102.36 | 28.0097 | 9.5864 | |||
| CPA / Copa Holdings, S.A. | 2.53 | -17.72 | 278.63 | 44.12 | 22.5129 | 1.7216 | |||
| BC94 / Samsung Electronics Co., Ltd. - Depositary Receipt (Common Stock) | 0.17 | -18.64 | 183.40 | 37.65 | 14.8181 | 0.4895 | |||
| CBKD / Commercial International Bank Egypt (CIB) S.A.E. - Depositary Receipt (Common Stock) | 21.21 | -22.18 | 35.64 | -13.42 | 2.8794 | -1.5471 | |||
| MKL / Markel Group Inc. | 0.01 | -3.46 | 24.35 | 3.13 | 1.9671 | -0.5715 | |||
| DIS / The Walt Disney Company | 0.18 | -3.31 | 22.08 | 21.48 | 1.7842 | -0.1706 | |||
| HSIC / Henry Schein, Inc. | 0.30 | -0.67 | 21.76 | 5.94 | 1.7582 | -0.4506 | |||
| BRK.A / Berkshire Hathaway Inc. | 0.04 | -8.00 | 21.67 | -16.09 | 1.7512 | -1.0265 | |||
| META / Meta Platforms, Inc. | 0.03 | -3.33 | 21.48 | 23.79 | 1.7353 | -0.1305 | |||
| GILD / Gilead Sciences, Inc. | 0.19 | -8.12 | 20.57 | -9.09 | 1.6623 | -0.7714 | |||
| WFC / Wells Fargo & Company | 0.26 | 11.98 | 20.48 | 24.97 | 1.6546 | -0.1076 | |||
| DCI / Donaldson Company, Inc. | 0.28 | -0.25 | 19.12 | 3.16 | 1.5452 | -0.4486 | |||
| QCOM / QUALCOMM Incorporated | 0.11 | -1.20 | 17.11 | 2.44 | 1.3828 | -0.4139 | |||
| TROW / T. Rowe Price Group, Inc. | 0.18 | -1.23 | 17.05 | 3.75 | 1.3775 | -0.3897 | |||
| CFR / Cullen/Frost Bankers, Inc. | 0.13 | -1.10 | 16.15 | 1.53 | 1.3048 | -0.4056 | |||
| MSM / MSC Industrial Direct Co., Inc. | 0.19 | -0.52 | 16.12 | 8.89 | 1.3025 | -0.2896 | |||
| RTX / RTX Corporation | 0.10 | -27.20 | 14.69 | -19.75 | 1.1872 | -0.7818 | |||
| SNA / Snap-on Incorporated | 0.05 | 13.23 | 14.65 | 4.55 | 1.1837 | -0.3233 | |||
| CHRW / C.H. Robinson Worldwide, Inc. | 0.15 | -0.97 | 14.64 | -7.21 | 1.1829 | -0.5139 | |||
| AXP / American Express Company | 0.04 | -0.88 | 14.35 | 17.51 | 1.1595 | -0.1538 | |||
| GNTX / Gentex Corporation | 0.59 | -0.14 | 13.01 | -5.75 | 1.0510 | -0.4332 | |||
| JNJ / Johnson & Johnson | 0.08 | -1.08 | 12.54 | -8.89 | 1.0131 | -0.4670 | |||
| BFB / Brown-Forman Corp. - Class B | 0.46 | 5.28 | 12.28 | -16.52 | 0.9919 | -0.5897 | |||
| GOOGL / Alphabet Inc. | 0.06 | 6.26 | 11.19 | 21.10 | 0.9038 | -0.0896 | |||
| XOM / Exxon Mobil Corporation | 0.10 | 2.91 | 11.07 | -6.73 | 0.8944 | -0.3819 | |||
| BDX / Becton, Dickinson and Company | 0.05 | -1.12 | 9.14 | -25.64 | 0.7386 | -0.5835 | |||
| SBID / State Bank of India - Depositary Receipt (Common Stock) | 0.10 | -2.26 | 9.10 | 4.89 | 0.7350 | -0.1977 | |||
| DG / Dollar General Corporation | 0.04 | 4.43 | 0.3579 | 0.3579 | |||||
| TTC / The Toro Company | 0.06 | 195.28 | 4.42 | 186.90 | 0.3575 | 0.1916 | |||
| XPEL / XPEL, Inc. | 0.12 | 129.04 | 4.28 | 179.96 | 0.3455 | 0.1812 | |||
| BWA / BorgWarner Inc. | 0.08 | -5.55 | 2.79 | 10.40 | 0.2257 | -0.0465 | |||
| BIIB / Biogen Inc. | 0.01 | -5.67 | 1.67 | -13.42 | 0.1351 | -0.0726 | |||
| LFUS / Littelfuse, Inc. | 0.00 | 0.16 | 0.0128 | 0.0128 | |||||
| BOKF / BOK Financial Corporation | 0.00 | 0.13 | 0.0103 | 0.0103 | |||||
| EXP / Eagle Materials Inc. | 0.00 | 0.12 | 0.0098 | 0.0098 | |||||
| AYI / Acuity Inc. | 0.00 | 0.12 | 0.0096 | 0.0096 | |||||
| CGNX / Cognex Corporation | 0.00 | 0.12 | 0.0095 | 0.0095 | |||||
| WAFD / WaFd, Inc | 0.00 | 0.10 | 0.0083 | 0.0083 | |||||
| AX / Axos Financial, Inc. | 0.00 | 0.10 | 0.0080 | 0.0080 | |||||
| LSTR / Landstar System, Inc. | 0.00 | 0.10 | 0.0079 | 0.0079 | |||||
| FMC / FMC Corporation | 0.00 | 0.07 | 0.0054 | 0.0054 | |||||
| SSD / Simpson Manufacturing Co., Inc. | 0.00 | 0.06 | 0.0050 | 0.0050 | |||||
| GGG / Graco Inc. | 0.00 | 0.06 | 0.0049 | 0.0049 | |||||
| INTC / Intel Corporation | 0.00 | -100.00 | 0.00 | 0.0000 |