Mga Batayang Estadistika
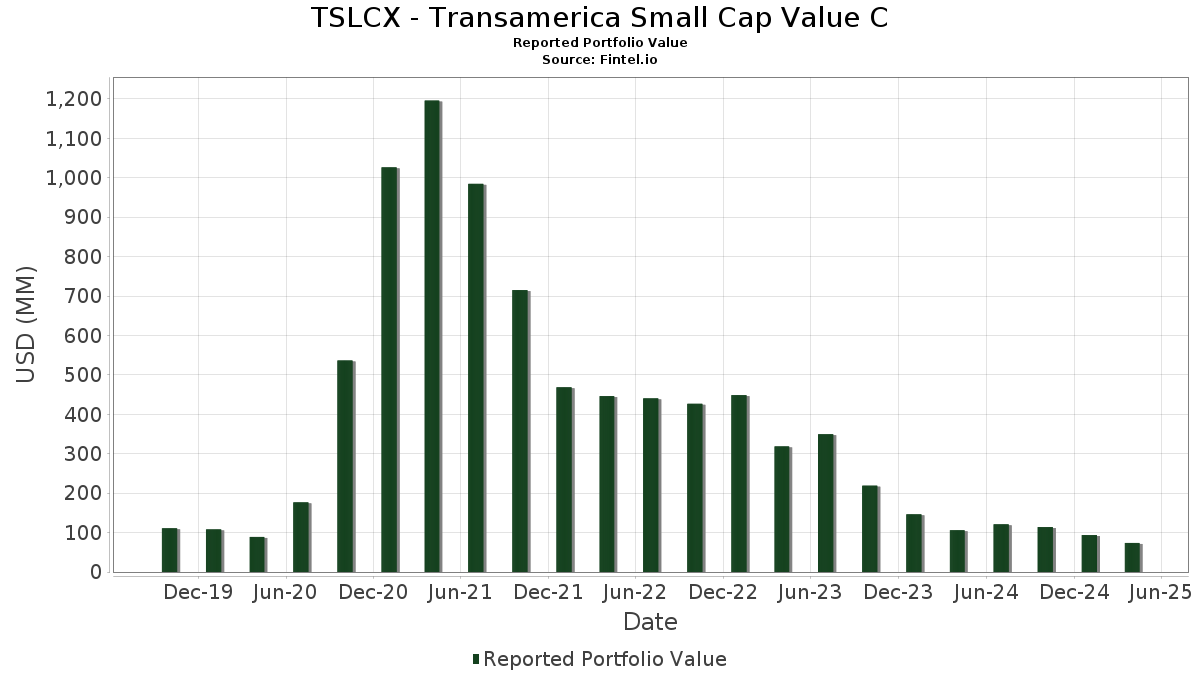
| Nilai Portofolio | $ 73,675,884 |
| Posisi Saat Ini | 156 |
Kepemilikan Terbaru, Kinerja, AUM (dari 13F, 13D)
TSLCX - Transamerica Small Cap Value C telah mengungkapkan total kepemilikan 156 dalam pengajuan SEC terbaru mereka. Nilai portofolio terbaru dihitung sebesar $ 73,675,884 USD. Aset yang Dikelola (AUM) sebenarnya adalah nilai ini ditambah kas (yang tidak diungkapkan). Aset-aset utama TSLCX - Transamerica Small Cap Value C adalah Mueller Industries, Inc. (US:MLI) , NorthWestern Energy Group, Inc. (US:NWE) , Magnolia Oil & Gas Corporation (US:MGY) , EMCOR Group, Inc. (US:EME) , and OSI Systems, Inc. (US:OSIS) . Posisi baru TSLCX - Transamerica Small Cap Value C meliputi: Smithfield Foods, Inc. (US:SFD) , Catalyst Pharmaceuticals, Inc. (US:CPRX) , .
Peningkatan Tertinggi Kuartal Ini
Kami menggunakan perubahan dalam alokasi portofolio karena ini adalah metrik yang paling bermakna. Perubahan dapat disebabkan oleh perdagangan atau perubahan harga saham.
| Keamanan | Saham (MM) |
Nilai (Juta Dolar AS) |
Portfolio % | ΔPorsyento ng Portfolio |
|---|---|---|---|---|
| 0.79 | 1.0780 | 1.0780 | ||
| 0.04 | 1.07 | 1.4659 | 0.8592 | |
| 0.02 | 0.58 | 0.7920 | 0.5579 | |
| 0.03 | 1.48 | 2.0213 | 0.4453 | |
| 0.01 | 0.31 | 0.4211 | 0.4211 | |
| 0.01 | 1.12 | 1.5319 | 0.3891 | |
| 0.03 | 1.00 | 1.3617 | 0.3890 | |
| 0.46 | 0.46 | 0.6232 | 0.3794 | |
| 0.02 | 1.48 | 2.0217 | 0.2719 | |
| 0.01 | 1.07 | 1.4552 | 0.2634 |
Penurunan Tertinggi Kuartal Ini
Kami menggunakan perubahan dalam alokasi portofolio karena ini adalah metrik yang paling bermakna. Perubahan dapat disebabkan oleh perdagangan atau perubahan harga saham.
| Keamanan | Saham (MM) |
Nilai (Juta Dolar AS) |
Portfolio % | ΔPorsyento ng Portfolio |
|---|---|---|---|---|
| 0.00 | 0.05 | 0.0648 | -0.6996 | |
| 0.00 | 0.14 | 0.1847 | -0.6855 | |
| 0.01 | 0.17 | 0.2342 | -0.5111 | |
| 0.00 | 0.33 | 0.4519 | -0.2979 | |
| 0.03 | 0.27 | 0.3691 | -0.2721 | |
| 0.01 | 0.46 | 0.6273 | -0.2644 | |
| 0.01 | 0.27 | 0.3724 | -0.2431 | |
| 0.01 | 0.16 | 0.2128 | -0.2139 | |
| 0.00 | 0.38 | 0.5240 | -0.2105 | |
| 0.01 | 0.38 | 0.5166 | -0.1930 |
Pengajuan 13F dan Dana
Formulir ini diajukan pada 2025-06-26 untuk periode pelaporan 2025-04-30. Klik ikon tautan untuk melihat riwayat transaksi selengkapnya.
Tingkatkan ke versi premium untuk membuka data premium dan ekspor ke Excel. ![]() .
.
| Keamanan | Ketik | Harga Saham Rata-rata | Saham (MM) |
ΔSaham (%) |
ΔSaham (%) |
Nilai ($MM) |
Portpolyo (%) |
ΔPortofolio (%) |
|
|---|---|---|---|---|---|---|---|---|---|
| MLI / Mueller Industries, Inc. | 0.02 | -2.89 | 1.48 | -9.30 | 2.0217 | 0.2719 | |||
| NWE / NorthWestern Energy Group, Inc. | 0.03 | -6.78 | 1.48 | 0.68 | 2.0213 | 0.4453 | |||
| MGY / Magnolia Oil & Gas Corporation | 0.07 | -5.69 | 1.38 | -18.33 | 1.8789 | 0.0732 | |||
| EME / EMCOR Group, Inc. | 0.00 | -5.80 | 1.30 | -15.73 | 1.7763 | 0.1209 | |||
| OSIS / OSI Systems, Inc. | 0.01 | -11.89 | 1.29 | -8.19 | 1.7593 | 0.2553 | |||
| WBS / Webster Financial Corporation | 0.03 | -2.88 | 1.19 | -23.75 | 1.6290 | -0.0482 | |||
| EHC / Encompass Health Corporation | 0.01 | -10.70 | 1.12 | 5.25 | 1.5319 | 0.3891 | |||
| AUB / Atlantic Union Bankshares Corporation | 0.04 | 158.67 | 1.07 | 89.75 | 1.4659 | 0.8592 | |||
| LRN / Stride, Inc. | 0.01 | -9.09 | 1.07 | -4.14 | 1.4552 | 0.2634 | |||
| WAFD / WaFd, Inc | 0.04 | -11.56 | 1.04 | -14.93 | 1.4145 | 0.1083 | |||
| URBN / Urban Outfitters, Inc. | 0.02 | -9.72 | 1.03 | -14.04 | 1.4038 | 0.1219 | |||
| EXEL / Exelixis, Inc. | 0.03 | -6.93 | 1.00 | 9.91 | 1.3617 | 0.3890 | |||
| JAZZ / Jazz Pharmaceuticals plc | 0.01 | -3.69 | 0.99 | -9.41 | 1.3520 | 0.1800 | |||
| UMBF / UMB Financial Corporation | 0.01 | -3.27 | 0.98 | -22.44 | 1.3350 | -0.0159 | |||
| PIPR / Piper Sandler Companies | 0.00 | -5.88 | 0.96 | -28.43 | 1.3155 | -0.1278 | |||
| EG / Everest Group, Ltd. | 0.00 | -5.31 | 0.96 | -2.24 | 1.3092 | 0.2580 | |||
| COLB / Columbia Banking System, Inc. | 0.04 | -6.49 | 0.94 | -24.82 | 1.2767 | -0.0573 | |||
| TRST / TrustCo Bank Corp NY | 0.03 | -5.43 | 0.93 | -10.51 | 1.2667 | 0.1561 | |||
| LYTS / LSI Industries Inc. | 0.06 | -2.78 | 0.92 | -30.37 | 1.2607 | -0.1608 | |||
| FCNCA / First Citizens BancShares, Inc. | 0.00 | -4.76 | 0.89 | -23.16 | 1.2133 | -0.0261 | |||
| PRGS / Progress Software Corporation | 0.01 | -7.55 | 0.88 | -3.29 | 1.2022 | 0.2261 | |||
| SBRA / Sabra Health Care REIT, Inc. | 0.05 | -6.55 | 0.88 | -0.11 | 1.1991 | 0.2561 | |||
| GVA / Granite Construction Incorporated | 0.01 | -4.00 | 0.88 | -11.50 | 1.1975 | 0.1356 | |||
| KBR / KBR, Inc. | 0.02 | -7.25 | 0.84 | -10.02 | 1.1525 | 0.1472 | |||
| SF / Stifel Financial Corp. | 0.01 | -3.90 | 0.84 | -28.90 | 1.1512 | -0.1203 | |||
| ORI / Old Republic International Corporation | 0.02 | -7.68 | 0.84 | -5.11 | 1.1411 | 0.1971 | |||
| OC / Owens Corning | 0.01 | -1.29 | 0.83 | -22.24 | 1.1355 | -0.0108 | |||
| INVA / Innoviva, Inc. | 0.04 | -7.36 | 0.81 | -7.10 | 1.1064 | 0.1712 | |||
| PFS / Provident Financial Services, Inc. | 0.05 | -7.55 | 0.80 | -18.50 | 1.0941 | 0.0401 | |||
| FIXED INC CLEARING CORP.REPO / RA (000000000) | 0.79 | 1.0780 | 1.0780 | ||||||
| PRGO / Perrigo Company plc | 0.03 | -6.61 | 0.76 | -3.54 | 1.0402 | 0.1932 | |||
| NOMD / Nomad Foods Limited | 0.04 | -9.67 | 0.76 | 1.07 | 1.0320 | 0.2307 | |||
| FRME / First Merchants Corporation | 0.02 | -4.65 | 0.73 | -23.56 | 0.9965 | -0.0266 | |||
| FIX / Comfort Systems USA, Inc. | 0.00 | -5.19 | 0.73 | -13.69 | 0.9896 | 0.0893 | |||
| DCOM / Dime Community Bancshares, Inc. | 0.03 | -6.69 | 0.72 | -23.26 | 0.9776 | -0.0223 | |||
| SIMO / Silicon Motion Technology Corporation - Depositary Receipt (Common Stock) | 0.01 | -8.42 | 0.67 | -16.91 | 0.9182 | 0.0498 | |||
| EBC / Eastern Bankshares, Inc. | 0.04 | -4.35 | 0.66 | -22.27 | 0.8954 | -0.0090 | |||
| BHLB / Berkshire Hills Bancorp, Inc. | 0.03 | -7.43 | 0.65 | -21.81 | 0.8856 | -0.0041 | |||
| DOC / Healthpeak Properties, Inc. | 0.04 | -5.26 | 0.64 | -18.22 | 0.8760 | 0.0353 | |||
| UCBI / United Community Banks, Inc. | 0.02 | -7.75 | 0.64 | -23.26 | 0.8737 | -0.0196 | |||
| ADEA / Adeia Inc. | 0.05 | -3.27 | 0.64 | -7.29 | 0.8681 | 0.1326 | |||
| POR / Portland General Electric Company | 0.01 | -7.28 | 0.62 | -5.08 | 0.8416 | 0.1456 | |||
| VEC / V2X Inc | 0.01 | -14.88 | 0.61 | -18.73 | 0.8348 | 0.0282 | |||
| REX / REX American Resources Corporation | 0.02 | -6.67 | 0.61 | -11.19 | 0.8343 | 0.0972 | |||
| OVV / Ovintiv Inc. | 0.02 | -7.69 | 0.60 | -26.61 | 0.8244 | -0.0572 | |||
| SIGI / Selective Insurance Group, Inc. | 0.01 | -9.80 | 0.60 | -6.53 | 0.8210 | 0.1318 | |||
| KBH / KB Home | 0.01 | -7.50 | 0.60 | -25.59 | 0.8180 | -0.0442 | |||
| TPR / Tapestry, Inc. | 0.01 | -4.57 | 0.59 | -7.68 | 0.8046 | 0.1212 | |||
| MSGE / Madison Square Garden Entertainment Corp. | 0.02 | 184.13 | 0.58 | 239.18 | 0.7920 | 0.5579 | |||
| ADC / Agree Realty Corporation | 0.01 | -11.83 | 0.58 | -5.71 | 0.7886 | 0.1320 | |||
| TSEM / Tower Semiconductor Ltd. | 0.02 | -3.87 | 0.58 | -29.72 | 0.7882 | -0.0914 | |||
| CW / Curtiss-Wright Corporation | 0.00 | -6.94 | 0.58 | -7.53 | 0.7879 | 0.1192 | |||
| APLE / Apple Hospitality REIT, Inc. | 0.05 | -7.04 | 0.57 | -29.22 | 0.7842 | -0.0846 | |||
| LDOS / Leidos Holdings, Inc. | 0.00 | -12.14 | 0.56 | -8.96 | 0.7628 | 0.1050 | |||
| MSGS / Madison Square Garden Sports Corp. | 0.00 | -5.00 | 0.55 | -16.84 | 0.7486 | 0.0422 | |||
| WSM / Williams-Sonoma, Inc. | 0.00 | -3.42 | 0.54 | -29.44 | 0.7427 | -0.0835 | |||
| CMC / Commercial Metals Company | 0.01 | -4.72 | 0.54 | -12.52 | 0.7351 | 0.0756 | |||
| LXP / LXP Industrial Trust | 0.07 | -6.14 | 0.52 | -11.04 | 0.7157 | 0.0844 | |||
| CHCT / Community Healthcare Trust Incorporated | 0.03 | -4.98 | 0.51 | -18.15 | 0.6896 | 0.0281 | |||
| SPB / Spectrum Brands Holdings, Inc. | 0.01 | -10.73 | 0.50 | -33.42 | 0.6799 | -0.1215 | |||
| VC / Visteon Corporation | 0.01 | -10.71 | 0.49 | -15.99 | 0.6751 | 0.0450 | |||
| SAIC / Science Applications International Corporation | 0.00 | -34.43 | 0.48 | -26.67 | 0.6603 | -0.0470 | |||
| HSII / Heidrick & Struggles International, Inc. | 0.01 | -12.09 | 0.47 | -26.18 | 0.6387 | -0.0409 | |||
| NX / Quanex Building Products Corporation | 0.03 | -4.07 | 0.47 | -24.88 | 0.6346 | -0.0288 | |||
| ANF / Abercrombie & Fitch Co. | 0.01 | -5.02 | 0.46 | -44.83 | 0.6273 | -0.2644 | |||
| AMWD / American Woodmark Corporation | 0.01 | -10.40 | 0.46 | -32.10 | 0.6237 | -0.0975 | |||
| US8575093013 / State Street Navigator Securities Lending Government Money Market Portfolio | 0.46 | 100.74 | 0.46 | 100.88 | 0.6232 | 0.3794 | |||
| BNL / Broadstone Net Lease, Inc. | 0.03 | -2.33 | 0.44 | 0.46 | 0.6003 | 0.1309 | |||
| LZB / La-Z-Boy Incorporated | 0.01 | -19.57 | 0.44 | -32.72 | 0.5980 | -0.0995 | |||
| HAYW / Hayward Holdings, Inc. | 0.03 | -3.41 | 0.43 | -14.57 | 0.5927 | 0.0484 | |||
| OCFC / OceanFirst Financial Corp. | 0.03 | -5.77 | 0.43 | -13.05 | 0.5907 | 0.0570 | |||
| KRG / Kite Realty Group Trust | 0.02 | -6.32 | 0.43 | -12.35 | 0.5906 | 0.0613 | |||
| ANGO / AngioDynamics, Inc. | 0.05 | -1.59 | 0.43 | -19.89 | 0.5886 | 0.0119 | |||
| HNI / HNI Corporation | 0.01 | -7.27 | 0.43 | -21.35 | 0.5885 | 0.0013 | |||
| VSH / Vishay Intertechnology, Inc. | 0.03 | -10.98 | 0.43 | -31.73 | 0.5820 | -0.0869 | |||
| US7587501039 / Regal-Beloit Corp. | 0.00 | -7.23 | 0.41 | -38.15 | 0.5558 | -0.1496 | |||
| KALU / Kaiser Aluminum Corporation | 0.01 | -2.33 | 0.41 | -9.98 | 0.5539 | 0.0704 | |||
| CHDN / Churchill Downs Incorporated | 0.00 | -3.76 | 0.40 | -29.62 | 0.5518 | -0.0635 | |||
| HLX / Helix Energy Solutions Group, Inc. | 0.07 | -6.70 | 0.40 | -29.23 | 0.5495 | -0.0594 | |||
| UFCS / United Fire Group, Inc. | 0.01 | -5.86 | 0.40 | 5.00 | 0.5454 | 0.1375 | |||
| MTUS / Metallus Inc. | 0.03 | -0.98 | 0.39 | -16.12 | 0.5254 | 0.0334 | |||
| ONTO / Onto Innovation Inc. | 0.00 | -5.97 | 0.38 | -43.94 | 0.5240 | -0.2105 | |||
| GEF / Greif, Inc. | 0.01 | -13.61 | 0.38 | -25.92 | 0.5225 | -0.0314 | |||
| NMRK / Newmark Group, Inc. | 0.03 | -4.83 | 0.38 | -25.98 | 0.5172 | -0.0313 | |||
| MKSI / MKS Inc. | 0.01 | -7.69 | 0.38 | -42.90 | 0.5166 | -0.1930 | |||
| INMD / InMode Ltd. | 0.03 | -3.85 | 0.37 | -21.11 | 0.5048 | 0.0017 | |||
| GDEN / Golden Entertainment, Inc. | 0.01 | -22.01 | 0.37 | -38.87 | 0.5030 | -0.1421 | |||
| IART / Integra LifeSciences Holdings Corporation | 0.02 | -4.70 | 0.37 | -40.16 | 0.4985 | -0.1555 | |||
| MCFT / MasterCraft Boat Holdings, Inc. | 0.02 | -5.52 | 0.35 | -14.81 | 0.4799 | 0.0382 | |||
| UBSI / United Bankshares, Inc. | 0.01 | -1.44 | 0.35 | -12.25 | 0.4794 | 0.0506 | |||
| UHALB / U-Haul Holding Company - Series N | 0.01 | -6.02 | 0.34 | -20.47 | 0.4672 | 0.0061 | |||
| ITRI / Itron, Inc. | 0.00 | -10.45 | 0.33 | -7.24 | 0.4554 | 0.0703 | |||
| OLED / Universal Display Corporation | 0.00 | -4.50 | 0.33 | -20.19 | 0.4541 | 0.0086 | |||
| ICFI / ICF International, Inc. | 0.00 | -35.00 | 0.33 | -52.71 | 0.4519 | -0.2979 | |||
| COHR / Coherent Corp. | 0.01 | -1.90 | 0.33 | -30.32 | 0.4518 | -0.0569 | |||
| MLR / Miller Industries, Inc. | 0.01 | -5.88 | 0.33 | -41.79 | 0.4453 | -0.1552 | |||
| COHU / Cohu, Inc. | 0.02 | -9.38 | 0.32 | -36.84 | 0.4430 | -0.1065 | |||
| FCBC / First Community Bankshares, Inc. | 0.01 | -7.30 | 0.31 | -19.48 | 0.4240 | 0.0107 | |||
| SFD / Smithfield Foods, Inc. | 0.01 | 0.31 | 0.4211 | 0.4211 | |||||
| NE / Noble Corporation plc | 0.01 | -6.29 | 0.31 | -36.44 | 0.4196 | -0.0987 | |||
| IMKTA / Ingles Markets, Incorporated | 0.00 | 9.55 | 0.30 | 2.04 | 0.4102 | 0.0946 | |||
| LXU / LSB Industries, Inc. | 0.05 | -8.63 | 0.30 | -30.93 | 0.4055 | -0.0554 | |||
| DRH / DiamondRock Hospitality Company | 0.04 | -6.05 | 0.29 | -21.62 | 0.3965 | 0.0002 | |||
| ASGN / ASGN Incorporated | 0.01 | -4.27 | 0.28 | -45.35 | 0.3848 | -0.1678 | |||
| EHAB / Enhabit, Inc. | 0.03 | -14.09 | 0.28 | -18.15 | 0.3754 | 0.0147 | |||
| SHOO / Steven Madden, Ltd. | 0.01 | -7.14 | 0.27 | -52.44 | 0.3724 | -0.2431 | |||
| AEO / American Eagle Outfitters, Inc. | 0.03 | -30.73 | 0.27 | -54.85 | 0.3691 | -0.2721 | |||
| DK / Delek US Holdings, Inc. | 0.02 | -9.56 | 0.26 | -34.16 | 0.3614 | -0.0689 | |||
| HP / Helmerich & Payne, Inc. | 0.01 | -6.73 | 0.26 | -44.35 | 0.3568 | -0.1455 | |||
| SONO / Sonos, Inc. | 0.03 | 12.00 | 0.26 | -25.29 | 0.3517 | -0.0174 | |||
| PHM / PulteGroup, Inc. | 0.00 | -9.09 | 0.26 | -17.95 | 0.3498 | 0.0147 | |||
| ESLT / Elbit Systems Ltd. | 0.00 | -3.85 | 0.25 | 25.25 | 0.3389 | 0.1262 | |||
| VLGEA / Village Super Market, Inc. | 0.01 | -14.19 | 0.25 | -7.20 | 0.3342 | 0.0512 | |||
| SUPN / Supernus Pharmaceuticals, Inc. | 0.01 | -8.02 | 0.24 | -22.26 | 0.3300 | -0.0028 | |||
| TNK / Teekay Tankers Ltd. | 0.01 | -8.94 | 0.24 | -7.39 | 0.3252 | 0.0491 | |||
| NHC / National HealthCare Corporation | 0.00 | -12.50 | 0.23 | -19.51 | 0.3158 | 0.0079 | |||
| GNTX / Gentex Corporation | 0.01 | -5.07 | 0.22 | -20.28 | 0.3060 | 0.0048 | |||
| SDRL / Seadrill Limited | 0.01 | -3.12 | 0.22 | -45.05 | 0.3040 | -0.1297 | |||
| HLIT / Harmonic Inc. | 0.02 | -17.00 | 0.22 | -34.03 | 0.3019 | -0.0568 | |||
| AMPH / Amphastar Pharmaceuticals, Inc. | 0.01 | 15.94 | 0.20 | -18.75 | 0.2664 | 0.0087 | |||
| AZTA / Azenta, Inc. | 0.01 | -5.13 | 0.19 | -53.92 | 0.2659 | -0.1856 | |||
| GENC / Gencor Industries, Inc. | 0.01 | -14.87 | 0.19 | -29.66 | 0.2527 | -0.0299 | |||
| LUCK / Lucky Strike Entertainment Corporation | 0.02 | -9.57 | 0.18 | -20.27 | 0.2423 | 0.0040 | |||
| HUN / Huntsman Corporation | 0.01 | -13.07 | 0.18 | -31.13 | 0.2415 | -0.0343 | |||
| ASO / Academy Sports and Outdoors, Inc. | 0.00 | -8.00 | 0.17 | -33.72 | 0.2364 | -0.0437 | |||
| WTTR / Select Water Solutions, Inc. | 0.02 | 47.62 | 0.17 | 0.59 | 0.2342 | 0.0514 | |||
| MSGE / Madison Square Garden Entertainment Corp. | 0.01 | -67.10 | 0.17 | -75.40 | 0.2342 | -0.5111 | |||
| OSK / Oshkosh Corporation | 0.00 | -4.76 | 0.17 | -31.56 | 0.2285 | -0.0333 | |||
| PDM / Piedmont Realty Trust, Inc. | 0.03 | 46.21 | 0.17 | -1.20 | 0.2257 | 0.0465 | |||
| PLOW / Douglas Dynamics, Inc. | 0.01 | -8.11 | 0.16 | -14.66 | 0.2224 | 0.0176 | |||
| PII / Polaris Inc. | 0.00 | -6.93 | 0.16 | -33.75 | 0.2177 | -0.0402 | |||
| HELE / Helen of Troy Limited | 0.01 | -13.18 | 0.16 | -60.80 | 0.2128 | -0.2139 | |||
| HWC / Hancock Whitney Corporation | 0.00 | -96.57 | 0.14 | -95.12 | 0.1847 | -0.6855 | |||
| IPGP / IPG Photonics Corporation | 0.00 | -27.42 | 0.13 | -40.97 | 0.1838 | -0.0596 | |||
| AYI / Acuity Inc. | 0.00 | -4.55 | 0.13 | -30.22 | 0.1744 | -0.0213 | |||
| KLIC / Kulicke and Soffa Industries, Inc. | 0.00 | -6.25 | 0.12 | -32.20 | 0.1649 | -0.0251 | |||
| PERI / Perion Network Ltd. | 0.01 | -20.19 | 0.12 | -16.55 | 0.1584 | 0.0088 | |||
| ROCK / Gibraltar Industries, Inc. | 0.00 | -6.67 | 0.11 | -19.57 | 0.1517 | 0.0038 | |||
| BPRN / Princeton Bancorp, Inc. | 0.00 | -19.28 | 0.10 | -19.05 | 0.1393 | 0.0036 | |||
| AMN / AMN Healthcare Services, Inc. | 0.00 | -9.26 | 0.10 | -32.43 | 0.1365 | -0.0226 | |||
| BLMN / Bloomin' Brands, Inc. | 0.01 | -41.37 | 0.10 | -62.64 | 0.1356 | -0.1488 | |||
| DOOO / BRP Inc. | 0.00 | 0.00 | 0.10 | -28.99 | 0.1341 | -0.0144 | |||
| CWBC / Community West Bancshares | 0.01 | -6.03 | 0.10 | -15.93 | 0.1301 | 0.0090 | |||
| CPRX / Catalyst Pharmaceuticals, Inc. | 0.00 | 0.09 | 0.1292 | 0.1292 | |||||
| MX / Magnachip Semiconductor Corporation | 0.03 | -15.42 | 0.09 | -34.81 | 0.1210 | -0.0239 | |||
| INN / Summit Hotel Properties, Inc. | 0.02 | -18.24 | 0.08 | -50.30 | 0.1132 | -0.0660 | |||
| FCN / FTI Consulting, Inc. | 0.00 | -25.00 | 0.07 | -36.75 | 0.1021 | -0.0235 | |||
| OSUR / OraSure Technologies, Inc. | 0.02 | -28.57 | 0.06 | -47.46 | 0.0856 | -0.0409 | |||
| QDEL / QuidelOrtho Corporation | 0.00 | -7.50 | 0.05 | -40.70 | 0.0701 | -0.0230 | |||
| CMCO / Columbus McKinnon Corporation | 0.00 | -83.67 | 0.05 | -93.41 | 0.0648 | -0.6996 | |||
| MRVI / Maravai LifeSciences Holdings, Inc. | 0.02 | -9.24 | 0.05 | -63.11 | 0.0623 | -0.0692 | |||
| TTEK / Tetra Tech, Inc. | 0.00 | -10.34 | 0.04 | -24.53 | 0.0553 | -0.0018 | |||
| APEI / American Public Education, Inc. | 0.00 | -32.50 | 0.03 | -29.55 | 0.0433 | -0.0042 | |||
| SILC / Silicom Ltd. | 0.00 | -35.09 | 0.03 | -45.83 | 0.0357 | -0.0163 | |||
| CCRN / Cross Country Healthcare, Inc. | 0.00 | 0.00 | 0.01 | -33.33 | 0.0092 | -0.0005 | |||
| KVHI / KVH Industries, Inc. | 0.00 | -50.00 | 0.01 | -58.33 | 0.0070 | -0.0061 | |||
| BDN / Brandywine Realty Trust | 0.00 | -100.00 | 0.00 | -100.00 | -0.0561 |