Mga Batayang Estadistika
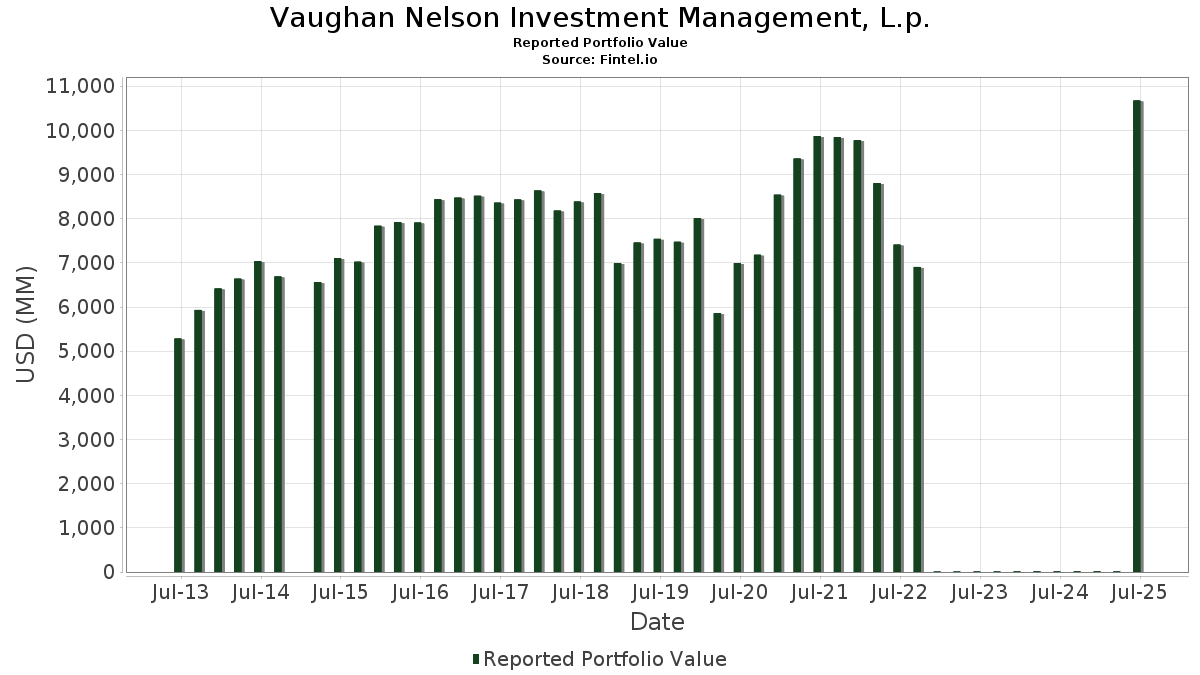
| Nilai Portofolio | $ 10,673,836,692 |
| Posisi Saat Ini | 195 |
Kepemilikan Terbaru, Kinerja, AUM (dari 13F, 13D)
Vaughan Nelson Investment Management, L.p. telah mengungkapkan total kepemilikan 195 dalam pengajuan SEC terbaru mereka. Nilai portofolio terbaru dihitung sebesar $ 10,673,836,692 USD. Aset yang Dikelola (AUM) sebenarnya adalah nilai ini ditambah kas (yang tidak diungkapkan). Aset-aset utama Vaughan Nelson Investment Management, L.p. adalah Microsoft Corporation (US:MSFT) , Amazon.com, Inc. (US:AMZN) , NVIDIA Corporation (US:NVDA) , Meta Platforms, Inc. (US:META) , and Taiwan Semiconductor Manufacturing Company Limited - Depositary Receipt (Common Stock) (US:TSM) . Posisi baru Vaughan Nelson Investment Management, L.p. meliputi: Spotify Technology S.A. (US:SPOT) , TransDigm Group Incorporated (US:TDG) , Burlington Stores, Inc. (US:BURL) , Clean Harbors, Inc. (US:CLH) , and Hexcel Corporation (US:HXL) . Industri unggulan Vaughan Nelson Investment Management, L.p. adalah "Water Transportation" (sic 44) , "Apparel And Accessory Stores" (sic 56) , and "Motor Freight Transportation And Warehousing" (sic 42) .
Peningkatan Tertinggi Kuartal Ini
Kami menggunakan perubahan dalam alokasi portofolio karena ini adalah metrik yang paling bermakna. Perubahan dapat disebabkan oleh perdagangan atau perubahan harga saham.
| Keamanan | Saham (MM) |
Nilai (Juta Dolar AS) |
Portfolio % | ΔPorsyento ng Portfolio |
|---|---|---|---|---|
| 0.27 | 209.49 | 1.9627 | 1.9627 | |
| 0.74 | 157.97 | 1.4800 | 1.4800 | |
| 0.44 | 156.22 | 1.4635 | 1.4635 | |
| 0.20 | 152.07 | 1.4247 | 1.4247 | |
| 0.06 | 94.09 | 0.8815 | 0.8815 | |
| 0.41 | 75.14 | 0.7039 | 0.7039 | |
| 1.94 | 307.26 | 2.8787 | 0.6868 | |
| 0.28 | 64.35 | 0.6029 | 0.6029 | |
| 0.26 | 59.08 | 0.5535 | 0.5535 | |
| 0.75 | 374.13 | 3.5051 | 0.5246 |
Penurunan Tertinggi Kuartal Ini
Kami menggunakan perubahan dalam alokasi portofolio karena ini adalah metrik yang paling bermakna. Perubahan dapat disebabkan oleh perdagangan atau perubahan harga saham.
| Keamanan | Saham (MM) |
Nilai (Juta Dolar AS) |
Portfolio % | ΔPorsyento ng Portfolio |
|---|---|---|---|---|
| 0.77 | 141.10 | 0.3532 | -2.0064 | |
| 0.41 | 197.68 | 0.4948 | -1.7949 | |
| 1.29 | 87.12 | 0.2181 | -1.6809 | |
| 1.00 | 155.80 | 0.3899 | -1.6103 | |
| 0.92 | 113.50 | 0.2841 | -1.2890 | |
| 0.95 | 215.08 | 0.5383 | -1.1525 | |
| 0.31 | 128.82 | 0.3224 | -1.1304 | |
| 2.20 | 131.24 | 0.3285 | -1.1204 | |
| 1.97 | 153.71 | 0.3847 | -1.0817 | |
| 0.80 | 93.90 | 0.2350 | -1.0351 |
Pengajuan 13D/G
Ini adalah daftar pengajuan 13D dan 13G yang dibuat dalam setahun terakhir (jika ada). Klik ikon tautan untuk melihat riwayat transaksi lengkap. Baris berwarna hijau menunjukkan posisi baru. Baris berwarna merah menunjukkan posisi yang sudah ditutup.
| Tanggal File | Formulir | Keamanan | Sebelumnya Saham |
Saat ini Saham |
ΔPersentase Saham | % Kepemilikan |
% ΔKepemilikan | |
|---|---|---|---|---|---|---|---|---|
| 2025-07-22 | CWK / Cushman & Wakefield plc | 9,130,323 | 13,312,527 | 45.81 | 5.75 | 44.84 | ||
| 2025-07-22 | MFA / MFA Financial, Inc. | 5,602,534 | 0 | -100.00 | 0.00 | -100.00 | ||
| 2025-04-17 | KOS / Kosmos Energy Ltd. | 25,112,534 | 4,031,165 | -83.95 | 0.84 | -84.21 |
Pengajuan 13F dan Dana
Formulir ini diajukan pada 2025-07-21 untuk periode pelaporan 2025-06-30. Klik ikon tautan untuk melihat riwayat transaksi selengkapnya.
Tingkatkan ke versi premium untuk membuka data premium dan ekspor ke Excel. ![]() .
.
| Keamanan | Ketik | Harga Saham Rata-rata | Saham (MM) |
ΔSaham (%) |
ΔSaham (%) |
Nilai ($MM) |
Portpolyo (%) |
ΔPortofolio (%) |
|
|---|---|---|---|---|---|---|---|---|---|
| MSFT / Microsoft Corporation | 0.75 | -5.28 | 374.13 | 125,445.30 | 3.5051 | 0.5246 | |||
| AMZN / Amazon.com, Inc. | 1.41 | -5.27 | 308.67 | 109,357.45 | 2.8918 | 0.0665 | |||
| NVDA / NVIDIA Corporation | 1.94 | -3.85 | 307.26 | 140,202.74 | 2.8787 | 0.6868 | |||
| META / Meta Platforms, Inc. | 0.36 | -3.75 | 263.00 | 123,374.18 | 2.4640 | 0.3306 | |||
| TSM / Taiwan Semiconductor Manufacturing Company Limited - Depositary Receipt (Common Stock) | 0.95 | -6.78 | 215.08 | 127,167.46 | 0.5383 | -1.1525 | |||
| GOOGL / Alphabet Inc. | 1.20 | -8.64 | 211.80 | 104,235.96 | 1.9843 | -0.0496 | |||
| JPM / JPMorgan Chase & Co. | 0.73 | -5.12 | 211.16 | 112,218.62 | 1.9783 | 0.0955 | |||
| SPOT / Spotify Technology S.A. | 0.27 | 209.49 | 1.9627 | 1.9627 | |||||
| IWN / iShares Trust - iShares Russell 2000 Value ETF | 1.29 | 4.53 | 203.58 | 109,348.92 | 1.9072 | 0.0438 | |||
| MPWR / Monolithic Power Systems, Inc. | 0.27 | 6.26 | 198.97 | 134,338.51 | 1.8641 | 0.3795 | |||
| BRK.B / Berkshire Hathaway Inc. | 0.41 | -5.36 | 197.68 | 86,220.96 | 0.4948 | -1.7949 | |||
| NOW / ServiceNow, Inc. | 0.18 | 14.11 | 180.15 | 147,565.57 | 0.4509 | -0.7715 | |||
| COHR / Coherent Corp. | 1.82 | 333.42 | 162.60 | 602,111.11 | 0.4070 | 0.1339 | |||
| SHW / The Sherwin-Williams Company | 0.47 | 83.06 | 161.70 | 181,589.89 | 0.4047 | -0.4934 | |||
| COF / Capital One Financial Corporation | 0.74 | 157.97 | 1.4800 | 1.4800 | |||||
| ETN / Eaton Corporation plc | 0.44 | 156.22 | 1.4635 | 1.4635 | |||||
| ZTS / Zoetis Inc. | 1.00 | -17.78 | 155.80 | 77,799.50 | 0.3899 | -1.6103 | |||
| ORLY / O'Reilly Automotive, Inc. | 1.72 | 1,052.93 | 155.24 | 72,442.06 | 1.4544 | -0.6854 | |||
| WAL / Western Alliance Bancorporation | 1.97 | 3.26 | 153.71 | 105,183.56 | 0.3847 | -1.0817 | |||
| URI / United Rentals, Inc. | 0.20 | 152.07 | 1.4247 | 1.4247 | |||||
| ZION / Zions Bancorporation, National Association | 2.83 | 9.26 | 147.25 | 114,044.96 | 0.3685 | -0.9249 | |||
| ICE / Intercontinental Exchange, Inc. | 0.77 | -43.79 | 141.10 | 59,942.98 | 0.3532 | -2.0064 | |||
| CWK / Cushman & Wakefield plc | 12.16 | 46.22 | 134.57 | 160,104.76 | 1.2608 | 0.4113 | |||
| CMA / Comerica Incorporated | 2.20 | -10.33 | 131.24 | 91,036.81 | 0.3285 | -1.1204 | |||
| MSI / Motorola Solutions, Inc. | 0.31 | -7.69 | 128.82 | 88,739.31 | 0.3224 | -1.1304 | |||
| XYL / Xylem Inc. | 0.97 | 29.13 | 125.61 | 141,033.71 | 0.3144 | -0.5837 | |||
| BLD / TopBuild Corp. | 0.37 | -5.52 | 118.34 | 101,047.01 | 0.2962 | -0.8835 | |||
| DIS / The Walt Disney Company | 0.92 | -42.59 | 113.50 | 72,194.90 | 0.2841 | -1.2890 | |||
| APAM / Artisan Partners Asset Management Inc. | 2.46 | 25.03 | 109.23 | 141,761.04 | 0.2734 | -0.4970 | |||
| IBP / Installed Building Products, Inc. | 0.59 | 11.94 | 107.02 | 118,810.00 | 0.2679 | -0.6410 | |||
| LECO / Lincoln Electric Holdings, Inc. | 0.50 | 24.39 | 104.59 | 137,515.79 | 0.2618 | -0.5052 | |||
| CFR / Cullen/Frost Bankers, Inc. | 0.81 | 13.38 | 103.70 | 116,415.73 | 0.2595 | -0.6311 | |||
| CIEN / Ciena Corporation | 1.24 | 375.44 | 100.50 | 669,893.33 | 0.2515 | 0.0945 | |||
| SIGI / Selective Insurance Group, Inc. | 1.15 | 1.99 | 99.70 | 96,700.00 | 0.2496 | -0.7831 | |||
| ESI / Element Solutions Inc | 4.30 | -9.80 | 97.32 | 90,856.07 | 0.2436 | -0.8333 | |||
| TDG / TransDigm Group Incorporated | 0.06 | 94.09 | 0.8815 | 0.8815 | |||||
| EXE / Expand Energy Corporation | 0.80 | -29.63 | 93.90 | 73,839.37 | 0.2350 | -1.0351 | |||
| VVV / Valvoline Inc. | 2.45 | 19.93 | 92.89 | 130,732.39 | 0.2325 | -0.4793 | |||
| CADE / Cadence Bank | 2.90 | 19.89 | 92.64 | 126,804.11 | 0.2319 | -0.5016 | |||
| RRR / Red Rock Resorts, Inc. | 1.77 | 10.69 | 92.28 | 133,639.13 | 0.2310 | -0.4638 | |||
| HRI / Herc Holdings Inc. | 0.70 | 362.83 | 92.24 | 461,075.00 | 0.2309 | 0.0277 | |||
| HII / Huntington Ingalls Industries, Inc. | 0.38 | 25.02 | 90.78 | 148,713.11 | 0.2272 | -0.3862 | |||
| PB / Prosperity Bancshares, Inc. | 1.27 | 14.12 | 89.18 | 112,784.81 | 0.8355 | 0.0416 | |||
| MDLZ / Mondelez International, Inc. | 1.29 | -53.85 | 87.12 | 45,996.83 | 0.2181 | -1.6809 | |||
| AR / Antero Resources Corporation | 2.15 | 12.14 | 86.49 | 112,223.38 | 0.2165 | -0.5577 | |||
| JBTM / JBT Marel Corporation | 0.69 | 21.16 | 83.40 | 120,765.22 | 0.7813 | 0.0820 | |||
| GXO / GXO Logistics, Inc. | 1.67 | -8.05 | 81.47 | 114,643.66 | 0.2039 | -0.5070 | |||
| KEX / Kirby Corporation | 0.71 | 12.67 | 80.99 | 126,445.31 | 0.2027 | -0.4374 | |||
| THG / The Hanover Insurance Group, Inc. | 0.46 | 25.62 | 78.93 | 123,229.69 | 0.1976 | -0.4457 | |||
| FCFS / FirstCash Holdings, Inc. | 0.58 | -9.96 | 77.94 | 101,123.38 | 0.1951 | -0.5754 | |||
| STAG / STAG Industrial, Inc. | 2.11 | 2.45 | 76.56 | 103,364.86 | 0.1916 | -0.5522 | |||
| CLS / Celestica Inc. | 0.48 | 75.69 | 0.1894 | 0.1894 | |||||
| WCC / WESCO International, Inc. | 0.41 | 75.14 | 0.7039 | 0.7039 | |||||
| XOM / Exxon Mobil Corporation | 0.67 | -6.74 | 72.00 | 84,603.53 | 0.1802 | -0.6714 | |||
| SR / Spire Inc. | 0.97 | 9.06 | 71.10 | 102,944.93 | 0.1780 | -0.5208 | |||
| AVGO / Broadcom Inc. | 0.25 | -0.51 | 69.23 | 164,730.95 | 0.1733 | -0.2493 | |||
| HWKN / Hawkins, Inc. | 0.47 | 35.08 | 67.32 | 181,845.95 | 0.6307 | 0.2593 | |||
| GATX / GATX Corporation | 0.43 | 52.71 | 66.71 | 151,509.09 | 0.1670 | -0.2746 | |||
| HUBB / Hubbell Incorporated | 0.16 | 130.31 | 66.25 | 287,926.09 | 0.1658 | -0.0672 | |||
| BURL / Burlington Stores, Inc. | 0.28 | 64.35 | 0.6029 | 0.6029 | |||||
| GIL / Gildan Activewear Inc. | 1.30 | 14.40 | 64.18 | 128,266.00 | 0.1606 | -0.3431 | |||
| EXP / Eagle Materials Inc. | 0.31 | 198.25 | 62.05 | 281,922.73 | 0.1553 | -0.0731 | |||
| TW / Tradeweb Markets Inc. | 0.42 | -19.82 | 61.91 | 79,269.23 | 0.1549 | -0.6278 | |||
| VMI / Valmont Industries, Inc. | 0.19 | 42.91 | 61.32 | 165,624.32 | 0.1535 | -0.2214 | |||
| SLGN / Silgan Holdings Inc. | 1.13 | 61.30 | 0.1534 | 0.1534 | |||||
| CLH / Clean Harbors, Inc. | 0.26 | 59.08 | 0.5535 | 0.5535 | |||||
| VMC / Vulcan Materials Company | 0.22 | -2.57 | 57.44 | 110,353.85 | 0.1438 | -0.3835 | |||
| AXON / Axon Enterprise, Inc. | 0.07 | 143.14 | 57.33 | 409,385.71 | 0.5371 | 0.3873 | |||
| BRKR / Bruker Corporation | 1.29 | 71.16 | 53.30 | 171,829.03 | 0.4993 | 0.1839 | |||
| RUSHA / Rush Enterprises, Inc. | 1.03 | -20.84 | 53.10 | 76,856.52 | 0.1329 | -0.5625 | |||
| NNN / NNN REIT, Inc. | 1.20 | -24.13 | 51.90 | 77,367.16 | 0.1299 | -0.5457 | |||
| RGA / Reinsurance Group of America, Incorporated | 0.26 | -21.16 | 51.02 | 79,621.88 | 0.1277 | -0.5146 | |||
| WTS / Watts Water Technologies, Inc. | 0.20 | 50.40 | 0.1261 | 0.1261 | |||||
| FSS / Federal Signal Corporation | 0.47 | 32.01 | 49.94 | 191,961.54 | 0.1250 | -0.1364 | |||
| HXL / Hexcel Corporation | 0.86 | 48.69 | 0.4562 | 0.4562 | |||||
| WRBY / Warby Parker Inc. | 2.22 | 105.53 | 48.60 | 255,705.26 | 0.1217 | -0.0749 | |||
| NWN / Northwest Natural Holding Company | 1.22 | 48.55 | 0.1215 | 0.1215 | |||||
| TNET / TriNet Group, Inc. | 0.65 | 90.11 | 47.44 | 175,603.70 | 0.1187 | -0.1516 | |||
| ERJ / Embraer S.A. - Depositary Receipt (Common Stock) | 0.83 | 15.36 | 47.37 | 143,451.52 | 0.1186 | -0.2147 | |||
| TYL / Tyler Technologies, Inc. | 0.08 | 25.59 | 46.94 | 130,286.11 | 0.4398 | 0.0733 | |||
| PFGC / Performance Food Group Company | 0.54 | 2.38 | 46.94 | 114,382.93 | 0.1175 | -0.2946 | |||
| WAB / Westinghouse Air Brake Technologies Corporation | 0.22 | 70.01 | 46.46 | 201,886.96 | 0.1163 | -0.1204 | |||
| CCCS / CCC Intelligent Solutions Holdings Inc. | 4.83 | 45.49 | 0.4262 | 0.4262 | |||||
| BWXT / BWX Technologies, Inc. | 0.31 | -43.76 | 44.99 | 83,220.37 | 0.1126 | -0.4351 | |||
| GEV / GE Vernova Inc. | 0.08 | 138.61 | 42.93 | 429,240.00 | 0.1075 | 0.0037 | |||
| BJ / BJ's Wholesale Club Holdings, Inc. | 0.39 | -2.76 | 42.29 | 91,839.13 | 0.1059 | -0.3543 | |||
| AZO / AutoZone, Inc. | 0.01 | -46.61 | 42.04 | 52,455.00 | 0.3939 | -0.4147 | |||
| MRVL / Marvell Technology, Inc. | 0.54 | -21.49 | 41.91 | 99,680.95 | 0.3926 | -0.0319 | |||
| VST / Vistra Corp. | 0.21 | 67.59 | 41.17 | 293,950.00 | 0.1030 | -0.0458 | |||
| SYF / Synchrony Financial | 0.61 | 40.38 | 0.1011 | 0.1011 | |||||
| FN / Fabrinet | 0.13 | 178.86 | 39.22 | 435,644.44 | 0.0982 | 0.0039 | |||
| EVRG / Evergy, Inc. | 0.57 | -2.95 | 39.09 | 97,612.50 | 0.3662 | -0.0366 | |||
| WEC / WEC Energy Group, Inc. | 0.37 | -5.27 | 38.52 | 91,611.90 | 0.0964 | -0.3288 | |||
| CMS / CMS Energy Corporation | 0.54 | -2.96 | 37.25 | 90,743.90 | 0.0932 | -0.3228 | |||
| LNT / Alliant Energy Corporation | 0.61 | -52.21 | 37.05 | 45,078.05 | 0.0927 | -0.7321 | |||
| CACI / CACI International Inc | 0.08 | -14.54 | 36.69 | 111,093.94 | 0.0918 | -0.2386 | |||
| VRT / Vertiv Holdings Co | 0.28 | 146.43 | 35.58 | 444,612.50 | 0.3333 | 0.2522 | |||
| NDAQ / Nasdaq, Inc. | 0.40 | -2.07 | 35.38 | 117,823.33 | 0.3314 | 0.0250 | |||
| GMED / Globus Medical, Inc. | 0.58 | -20.33 | 34.38 | 64,771.70 | 0.3221 | -0.2130 | |||
| EGP / EastGroup Properties, Inc. | 0.20 | -60.04 | 33.84 | 37,926.97 | 0.0847 | -0.8079 | |||
| ADMA / ADMA Biologics, Inc. | 1.80 | 32.79 | 0.3072 | 0.3072 | |||||
| ROK / Rockwell Automation, Inc. | 0.10 | -19.93 | 32.70 | 105,396.77 | 0.0819 | -0.2358 | |||
| FND / Floor & Decor Holdings, Inc. | 0.43 | 32.54 | 0.0815 | 0.0815 | |||||
| DPZ / Domino's Pizza, Inc. | 0.07 | -16.01 | 32.03 | 84,178.95 | 0.0802 | -0.3086 | |||
| MTDR / Matador Resources Company | 0.67 | -3.93 | 31.96 | 91,220.00 | 0.2994 | -0.0567 | |||
| PR / Permian Resources Corporation | 2.33 | -8.76 | 31.74 | 90,591.43 | 0.0794 | -0.2743 | |||
| PH / Parker-Hannifin Corporation | 0.04 | 118.86 | 31.42 | 261,750.00 | 0.2944 | 0.1695 | |||
| TOL / Toll Brothers, Inc. | 0.27 | 188.26 | 30.45 | 338,188.89 | 0.2852 | 0.1876 | |||
| OWL / Blue Owl Capital Inc. | 1.58 | 513.09 | 30.28 | 605,580.00 | 0.0758 | 0.0243 | |||
| MUR / Murphy Oil Corporation | 1.33 | -0.96 | 29.82 | 78,360.53 | 0.2793 | -0.1006 | |||
| CR / Crane Company | 0.16 | 9.90 | 29.48 | 140,266.67 | 0.0738 | -0.1426 | |||
| AME / AMETEK, Inc. | 0.15 | -2.06 | 26.40 | 105,484.00 | 0.2473 | -0.0090 | |||
| DHI / D.R. Horton, Inc. | 0.20 | 148.13 | 26.33 | 263,190.00 | 0.0659 | -0.0387 | |||
| FLS / Flowserve Corporation | 0.50 | 34.34 | 26.23 | 145,638.89 | 0.0657 | -0.1165 | |||
| RSG / Republic Services, Inc. | 0.10 | -60.29 | 25.85 | 40,926.98 | 0.0647 | -0.5743 | |||
| XPO / XPO, Inc. | 0.20 | -31.05 | 25.80 | 83,109.68 | 0.2417 | -0.0769 | |||
| COKE / Coca-Cola Consolidated, Inc. | 0.23 | 547.97 | 25.33 | 53,800.00 | 0.0634 | -0.4092 | |||
| GE / General Electric Company | 0.09 | 22.90 | 0.2145 | 0.2145 | |||||
| FTI / TechnipFMC plc | 0.66 | -37.91 | 22.74 | 68,821.21 | 0.0569 | -0.2801 | |||
| AEO / American Eagle Outfitters, Inc. | 2.31 | 41.66 | 22.20 | 123,211.11 | 0.0556 | -0.1337 | |||
| RRC / Range Resources Corporation | 0.54 | -53.44 | 21.83 | 47,365.22 | 0.0546 | -0.4057 | |||
| HLIO / Helios Technologies, Inc. | 0.61 | -23.36 | 20.20 | 80,704.00 | 0.0506 | -0.2029 | |||
| EXR / Extra Space Storage Inc. | 0.13 | -33.69 | 19.41 | 66,824.14 | 0.0486 | -0.2461 | |||
| ALLE / Allegion plc | 0.13 | -2.28 | 19.17 | 112,676.47 | 0.1796 | 0.0021 | |||
| A / Agilent Technologies, Inc. | 0.15 | -2.19 | 17.16 | 100,823.53 | 0.0429 | -0.1309 | |||
| ARES / Ares Management Corporation | 0.09 | 192.91 | 16.34 | 408,400.00 | 0.0409 | -0.0063 | |||
| TREX / Trex Company, Inc. | 0.28 | 15.06 | 0.1411 | 0.1411 | |||||
| LNW / Light & Wonder, Inc. | 0.14 | 13.75 | 0.1289 | 0.1289 | |||||
| CCL / Carnival Corporation & plc | 0.42 | -2.24 | 11.90 | 148,625.00 | 0.0298 | -0.0547 | |||
| SSNC / SS&C Technologies Holdings, Inc. | 0.14 | -0.89 | 11.64 | 105,681.82 | 0.0291 | -0.0893 | |||
| RCL / Royal Caribbean Cruises Ltd. | 0.04 | -16.49 | 11.25 | 140,575.00 | 0.0282 | -0.0602 | |||
| CDW / CDW Corporation | 0.06 | -66.74 | 10.14 | 37,470.37 | 0.0254 | -0.2482 | |||
| VNSE / Natixis ETF Trust II - Natixis Vaughan Nelson Select ETF | 0.24 | 1.55 | 8.52 | 121,657.14 | 0.0213 | -0.0539 | |||
| NU / Nu Holdings Ltd. | 0.62 | 2,221.21 | 8.45 | 0.0211 | 0.0184 | ||||
| KOS / Kosmos Energy Ltd. | 4.01 | 0.00 | 6.89 | 76,500.00 | 0.0173 | -0.0741 | |||
| MELI / MercadoLibre, Inc. | 0.00 | 8.51 | 5.90 | 147,350.00 | 0.0553 | 0.0147 | |||
| YPF / YPF Sociedad Anónima - Depositary Receipt (Common Stock) | 0.17 | 12.79 | 5.45 | 108,860.00 | 0.0136 | -0.0402 | |||
| IBM / International Business Machines Corporation | 0.01 | 0.00 | 4.39 | 146,300.00 | 0.0110 | -0.0260 | |||
| AJG / Arthur J. Gallagher & Co. | 0.01 | -85.40 | 3.97 | 13,579.31 | 0.0372 | -0.2560 | |||
| ABBV / AbbVie Inc. | 0.02 | 0.00 | 3.92 | 97,975.00 | 0.0098 | -0.0345 | |||
| MS / Morgan Stanley | 0.03 | 0.00 | 3.77 | 125,666.67 | 0.0094 | -0.0218 | |||
| CSCO / Cisco Systems, Inc. | 0.05 | 0.00 | 3.69 | 122,966.67 | 0.0346 | 0.0018 | |||
| WFC / Wells Fargo & Company | 0.04 | 0.00 | 3.55 | 118,200.00 | 0.0333 | 0.0015 | |||
| KO / The Coca-Cola Company | 0.05 | 0.00 | 3.32 | 110,500.00 | 0.0083 | -0.0253 | |||
| BRO / Brown & Brown, Inc. | 0.03 | -52.19 | 3.23 | 46,042.86 | 0.0303 | -0.0455 | |||
| NVT / nVent Electric plc | 0.04 | 31.68 | 3.23 | 322,600.00 | 0.0081 | -0.0095 | |||
| DUK / Duke Energy Corporation | 0.03 | 0.00 | 3.05 | 101,566.67 | 0.0286 | -0.0029 | |||
| JNJ / Johnson & Johnson | 0.02 | 0.00 | 3.01 | 100,133.33 | 0.0075 | -0.0251 | |||
| CMI / Cummins Inc. | 0.01 | 0.00 | 2.83 | 141,200.00 | 0.0071 | -0.0200 | |||
| HD / The Home Depot, Inc. | 0.01 | 0.00 | 2.71 | 135,600.00 | 0.0068 | -0.0203 | |||
| EFX / Equifax Inc. | 0.01 | 18.52 | 2.66 | 133,050.00 | 0.0250 | 0.0038 | |||
| MRK / Merck & Co., Inc. | 0.03 | 0.00 | 2.39 | 119,600.00 | 0.0060 | -0.0212 | |||
| CVS / CVS Health Corporation | 0.03 | 0.00 | 2.36 | 118,100.00 | 0.0059 | -0.0173 | |||
| EOG / EOG Resources, Inc. | 0.02 | 7.88 | 2.18 | 108,800.00 | 0.0055 | -0.0162 | |||
| PFE / Pfizer Inc. | 0.09 | 0.00 | 2.15 | 107,350.00 | 0.0054 | -0.0171 | |||
| EMR / Emerson Electric Co. | 0.02 | 0.00 | 2.09 | 209,200.00 | 0.0052 | -0.0120 | |||
| VZ / Verizon Communications Inc. | 0.05 | 0.00 | 2.09 | 104,500.00 | 0.0052 | -0.0167 | |||
| KDP / Keurig Dr Pepper Inc. | 0.06 | -47.48 | 2.08 | 51,800.00 | 0.0052 | -0.0357 | |||
| EPD / Enterprise Products Partners L.P. - Limited Partnership | 0.06 | 0.00 | 1.73 | 172,800.00 | 0.0043 | -0.0147 | |||
| UPS / United Parcel Service, Inc. | 0.02 | 0.00 | 1.71 | 170,800.00 | 0.0043 | -0.0143 | |||
| SKY / Champion Homes, Inc. | 0.03 | -94.47 | 1.64 | 3,629.55 | 0.0041 | -0.4449 | |||
| OKE / ONEOK, Inc. | 0.02 | 0.00 | 1.42 | 141,700.00 | 0.0036 | -0.0137 | |||
| CVX / Chevron Corporation | 0.01 | 0.00 | 1.21 | 120,900.00 | 0.0030 | -0.0111 | |||
| BLDR / Builders FirstSource, Inc. | 0.01 | 28.75 | 1.03 | 0.0026 | -0.0060 | ||||
| COP / ConocoPhillips | 0.01 | 0.00 | 0.95 | 94,800.00 | 0.0024 | -0.0087 | |||
| HIG / The Hartford Insurance Group, Inc. | 0.01 | 27.42 | 0.90 | 0.0023 | -0.0046 | ||||
| BIV / Vanguard Bond Index Funds - Vanguard Intermediate-Term Bond ETF | 0.01 | 0.00 | 0.89 | 0.0022 | -0.0066 | ||||
| SUB / iShares Trust - iShares Short-Term National Muni Bond ETF | 0.01 | -0.93 | 0.74 | 0.0019 | -0.0056 | ||||
| KSA / iShares Trust - iShares MSCI Saudi Arabia ETF | 0.02 | 0.64 | 0.0060 | 0.0060 | |||||
| IGIB / iShares Trust - iShares 5-10 Year Investment Grade Corporate Bond ETF | 0.01 | 0.00 | 0.63 | 0.0016 | -0.0046 | ||||
| VCSH / Vanguard Scottsdale Funds - Vanguard Short-Term Corporate Bond ETF | 0.01 | 0.00 | 0.47 | 0.0012 | -0.0035 | ||||
| BSV / Vanguard Bond Index Funds - Vanguard Short-Term Bond ETF | 0.01 | 0.00 | 0.47 | 0.0012 | -0.0035 | ||||
| AUB / Atlantic Union Bankshares Corporation | 0.01 | 27.49 | 0.46 | 0.0011 | -0.0024 | ||||
| VCIT / Vanguard Scottsdale Funds - Vanguard Intermediate-Term Corporate Bond ETF | 0.01 | 0.00 | 0.42 | 0.0010 | -0.0031 | ||||
| MUB / iShares Trust - iShares National Muni Bond ETF | 0.00 | -0.38 | 0.41 | 0.0010 | -0.0031 | ||||
| AAXJ / iShares Trust - iShares MSCI All Country Asia ex Japan ETF | 0.00 | 0.00 | 0.37 | 0.0009 | -0.0024 | ||||
| ARCC / Ares Capital Corporation | 0.02 | 0.00 | 0.35 | 0.0009 | -0.0027 | ||||
| D / Dominion Energy, Inc. | 0.00 | 0.00 | 0.26 | 0.0007 | -0.0019 | ||||
| IVV / iShares Trust - iShares Core S&P 500 ETF | 0.00 | 0.00 | 0.25 | 0.0006 | -0.0016 | ||||
| RTX / RTX Corporation | 0.00 | 0.00 | 0.16 | 0.0004 | -0.0011 | ||||
| MAIN / Main Street Capital Corporation | 0.00 | 0.00 | 0.16 | 0.0004 | -0.0011 | ||||
| TSLX / Sixth Street Specialty Lending, Inc. | 0.01 | 0.00 | 0.13 | 0.0003 | -0.0009 | ||||
| AB / AllianceBernstein Holding L.P. - Limited Partnership | 0.00 | 0.00 | 0.11 | 0.0003 | -0.0007 | ||||
| INTC / Intel Corporation | 0.00 | 0.00 | 0.09 | 0.0009 | -0.0001 | ||||
| CLX / The Clorox Company | 0.00 | 0.00 | 0.08 | 0.0002 | -0.0008 | ||||
| CCI / Crown Castle Inc. | 0.00 | 0.00 | 0.08 | 0.0002 | -0.0006 | ||||
| BSM / Black Stone Minerals, L.P. - Limited Partnership | 0.01 | 0.00 | 0.07 | 0.0002 | -0.0007 | ||||
| ILF / iShares Trust - iShares Latin America 40 ETF | 0.00 | 0.00 | 0.07 | 0.0002 | -0.0004 | ||||
| IWS / iShares Trust - iShares Russell Mid-Cap Value ETF | 0.00 | -70.32 | 0.06 | 0.0002 | -0.0018 | ||||
| VGSH / Vanguard Scottsdale Funds - Vanguard Short-Term Treasury ETF | 0.00 | 0.00 | 0.05 | 0.0001 | -0.0004 | ||||
| MGC / Vanguard World Fund - Vanguard Mega Cap ETF | 0.00 | 0.00 | 0.05 | 0.0001 | -0.0003 | ||||
| IWR / iShares Trust - iShares Russell Mid-Cap ETF | 0.00 | 0.04 | 0.0004 | 0.0004 | |||||
| SCHD / Schwab Strategic Trust - Schwab U.S. Dividend Equity ETF | 0.00 | 0.04 | 0.0004 | 0.0004 | |||||
| VO / Vanguard Index Funds - Vanguard Mid-Cap ETF | 0.00 | 0.00 | 0.02 | 0.0001 | -0.0002 | ||||
| AMLP / ALPS ETF Trust - Alerian MLP ETF | 0.00 | 0.00 | 0.01 | 0.0000 | -0.0001 | ||||
| AAON / AAON, Inc. | 0.00 | -100.00 | 0.00 | 0.0000 | |||||
| AZEK / The AZEK Company Inc. | 0.00 | -100.00 | 0.00 | 0.0000 | |||||
| KMPR / Kemper Corporation | 0.00 | -100.00 | 0.00 | 0.0000 | |||||
| SITE / SiteOne Landscape Supply, Inc. | 0.00 | -100.00 | 0.00 | 0.0000 | |||||
| UTHR / United Therapeutics Corporation | 0.00 | -100.00 | 0.00 | 0.0000 | |||||
| MTRN / Materion Corporation | 0.00 | -100.00 | 0.00 | 0.0000 | |||||
| HQY / HealthEquity, Inc. | 0.00 | -100.00 | 0.00 | 0.0000 | |||||
| MSCI / MSCI Inc. | 0.00 | -100.00 | 0.00 | 0.0000 | |||||
| CHD / Church & Dwight Co., Inc. | 0.00 | -100.00 | 0.00 | 0.0000 | |||||
| FAF / First American Financial Corporation | 0.00 | -100.00 | 0.00 | 0.0000 | |||||
| RXO / RXO, Inc. | 0.00 | -100.00 | 0.00 | 0.0000 | |||||
| SAIA / Saia, Inc. | 0.00 | -100.00 | 0.00 | 0.0000 | |||||
| MAN / ManpowerGroup Inc. | 0.00 | -100.00 | 0.00 | 0.0000 | |||||
| ALL / The Allstate Corporation | 0.00 | -100.00 | 0.00 | 0.0000 | |||||
| NSIT / Insight Enterprises, Inc. | 0.00 | -100.00 | 0.00 | 0.0000 | |||||
| POR / Portland General Electric Company | 0.00 | -100.00 | 0.00 | 0.0000 | |||||
| RMBS / Rambus Inc. | 0.00 | -100.00 | 0.00 | 0.0000 | |||||
| ISRG / Intuitive Surgical, Inc. | 0.00 | -100.00 | 0.00 | 0.0000 | |||||
| BDX / Becton, Dickinson and Company | 0.00 | -100.00 | 0.00 | 0.0000 | |||||
| AGNC / AGNC Investment Corp. | 0.00 | -100.00 | 0.00 | 0.0000 | |||||
| DKS / DICK'S Sporting Goods, Inc. | 0.00 | -100.00 | 0.00 | 0.0000 | |||||
| YUMC / Yum China Holdings, Inc. | 0.00 | -100.00 | 0.00 | 0.0000 | |||||
| BECN / Beacon Roofing Supply, Inc. | 0.00 | -100.00 | 0.00 | 0.0000 | |||||
| ONTO / Onto Innovation Inc. | 0.00 | -100.00 | 0.00 | -100.00 | -0.3117 | ||||
| BILI / Bilibili Inc. - Depositary Receipt (Common Stock) | 0.00 | -100.00 | 0.00 | 0.0000 | -0.0035 | ||||
| FANG / Diamondback Energy, Inc. | 0.00 | -100.00 | 0.00 | 0.0000 | |||||
| MFA / MFA Financial, Inc. | 0.00 | -100.00 | 0.00 | 0.0000 | |||||
| SKX / Skechers U.S.A., Inc. | 0.00 | -100.00 | 0.00 | -100.00 | -0.0961 | ||||
| ITGR / Integer Holdings Corporation | 0.00 | -100.00 | 0.00 | 0.0000 | |||||
| CMCO / Columbus McKinnon Corporation | 0.00 | -100.00 | 0.00 | -100.00 | -0.1651 | ||||
| STE / STERIS plc | 0.00 | -100.00 | 0.00 | 0.0000 | |||||
| TME / Tencent Music Entertainment Group - Depositary Receipt (Common Stock) | 0.00 | -100.00 | 0.00 | 0.0000 | |||||
| CPRI / Capri Holdings Limited | 0.00 | -100.00 | 0.00 | 0.0000 | |||||
| AXTA / Axalta Coating Systems Ltd. | 0.00 | -100.00 | 0.00 | 0.0000 | |||||
| AU / AngloGold Ashanti plc | 0.00 | -100.00 | 0.00 | 0.0000 |