Mga Batayang Estadistika
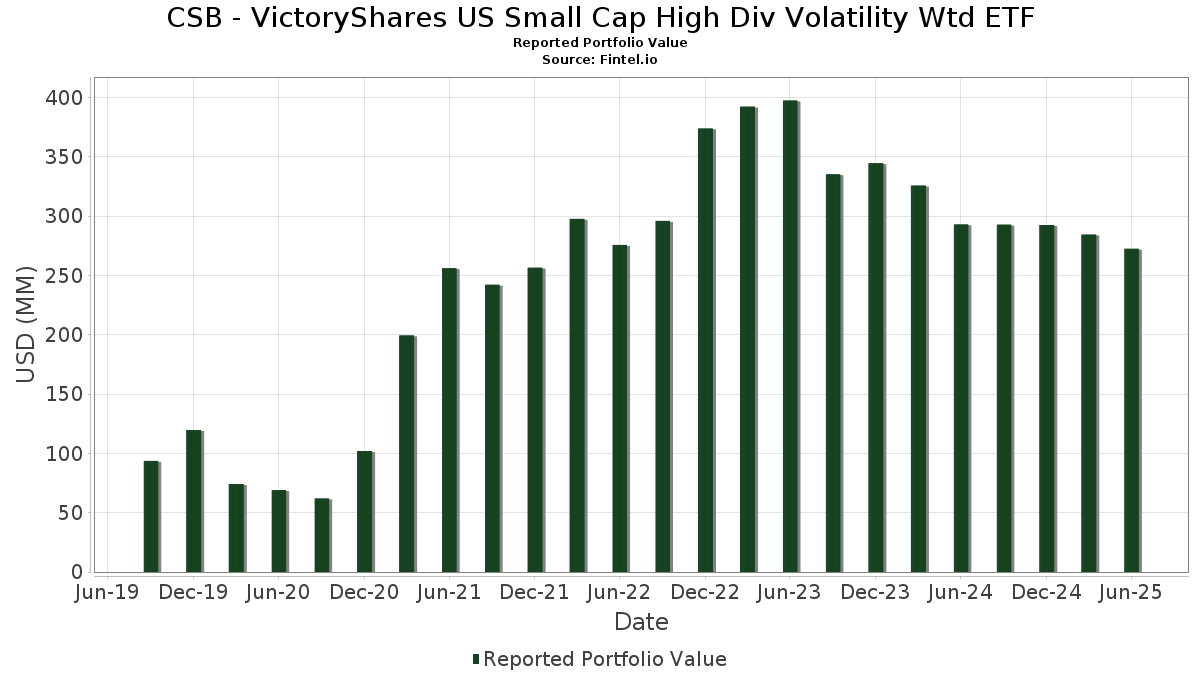
| Nilai Portofolio | $ 272,386,830 |
| Posisi Saat Ini | 105 |
Kepemilikan Terbaru, Kinerja, AUM (dari 13F, 13D)
CSB - VictoryShares US Small Cap High Div Volatility Wtd ETF telah mengungkapkan total kepemilikan 105 dalam pengajuan SEC terbaru mereka. Nilai portofolio terbaru dihitung sebesar $ 272,386,830 USD. Aset yang Dikelola (AUM) sebenarnya adalah nilai ini ditambah kas (yang tidak diungkapkan). Aset-aset utama CSB - VictoryShares US Small Cap High Div Volatility Wtd ETF adalah IDACORP, Inc. (US:IDA) , Sensient Technologies Corporation (US:SXT) , TXNM Energy, Inc. (US:TXNM) , Portland General Electric Company (US:POR) , and New Jersey Resources Corporation (US:NJR) .
Peningkatan Tertinggi Kuartal Ini
Kami menggunakan perubahan dalam alokasi portofolio karena ini adalah metrik yang paling bermakna. Perubahan dapat disebabkan oleh perdagangan atau perubahan harga saham.
| Keamanan | Saham (MM) |
Nilai (Juta Dolar AS) |
Portfolio % | ΔPorsyento ng Portfolio |
|---|---|---|---|---|
| 0.05 | 4.98 | 1.8357 | 0.4964 | |
| 0.05 | 3.47 | 1.2797 | 0.2340 | |
| 0.07 | 3.17 | 1.1669 | 0.2146 | |
| 0.07 | 3.19 | 1.1751 | 0.1741 | |
| 0.14 | 2.54 | 0.9371 | 0.1740 | |
| 0.05 | 2.67 | 0.9833 | 0.1689 | |
| 0.07 | 3.65 | 1.3430 | 0.1679 | |
| 0.07 | 3.20 | 1.1798 | 0.1523 | |
| 0.09 | 4.90 | 1.8052 | 0.1497 | |
| 0.09 | 3.28 | 1.2084 | 0.1487 |
Penurunan Tertinggi Kuartal Ini
Kami menggunakan perubahan dalam alokasi portofolio karena ini adalah metrik yang paling bermakna. Perubahan dapat disebabkan oleh perdagangan atau perubahan harga saham.
| Keamanan | Saham (MM) |
Nilai (Juta Dolar AS) |
Portfolio % | ΔPorsyento ng Portfolio |
|---|---|---|---|---|
| 0.11 | 2.29 | 0.8432 | -0.3654 | |
| 0.05 | 2.08 | 0.7659 | -0.2938 | |
| 0.08 | 1.14 | 0.4196 | -0.2786 | |
| 0.15 | 1.49 | 0.5478 | -0.2660 | |
| 0.02 | 1.50 | 0.5534 | -0.2398 | |
| 0.34 | 2.83 | 1.0427 | -0.2226 | |
| 0.25 | 3.97 | 1.4616 | -0.2176 | |
| 0.20 | 2.26 | 0.8336 | -0.1978 | |
| 0.11 | 2.38 | 0.8756 | -0.1918 | |
| 0.03 | 1.60 | 0.5908 | -0.1730 |
Pengajuan 13F dan Dana
Formulir ini diajukan pada 2025-08-28 untuk periode pelaporan 2025-06-30. Klik ikon tautan untuk melihat riwayat transaksi selengkapnya.
Tingkatkan ke versi premium untuk membuka data premium dan ekspor ke Excel. ![]() .
.
| Keamanan | Ketik | Harga Saham Rata-rata | Saham (MM) |
ΔSaham (%) |
ΔSaham (%) |
Nilai ($MM) |
Portpolyo (%) |
ΔPortofolio (%) |
|
|---|---|---|---|---|---|---|---|---|---|
| IDA / IDACORP, Inc. | 0.04 | 0.00 | 5.04 | -0.65 | 1.8555 | 0.0516 | |||
| SXT / Sensient Technologies Corporation | 0.05 | 0.00 | 4.98 | 32.38 | 1.8357 | 0.4964 | |||
| TXNM / TXNM Energy, Inc. | 0.09 | 0.00 | 4.90 | 5.31 | 1.8052 | 0.1497 | |||
| POR / Portland General Electric Company | 0.11 | 0.00 | 4.49 | -8.92 | 1.6550 | -0.0995 | |||
| NJR / New Jersey Resources Corporation | 0.10 | 0.00 | 4.34 | -8.64 | 1.5999 | -0.0914 | |||
| BKH / Black Hills Corporation | 0.08 | 0.00 | 4.30 | -7.50 | 1.5853 | -0.0699 | |||
| NWN / Northwest Natural Holding Company | 0.11 | 0.00 | 4.17 | -7.02 | 1.5367 | -0.0595 | |||
| AWR / American States Water Company | 0.05 | 0.00 | 4.16 | -2.58 | 1.5320 | 0.0135 | |||
| OGS / ONE Gas, Inc. | 0.06 | 0.00 | 4.11 | -4.94 | 1.5153 | -0.0241 | |||
| AVA / Avista Corporation | 0.10 | 0.00 | 3.98 | -9.37 | 1.4641 | -0.0959 | |||
| FLO / Flowers Foods, Inc. | 0.25 | 0.00 | 3.97 | -15.95 | 1.4616 | -0.2176 | |||
| NWE / NorthWestern Energy Group, Inc. | 0.08 | 0.00 | 3.93 | -11.35 | 1.4471 | -0.1294 | |||
| CWT / California Water Service Group | 0.09 | 0.00 | 3.92 | -6.16 | 1.4427 | -0.0419 | |||
| SON / Sonoco Products Company | 0.09 | 0.00 | 3.88 | -7.79 | 1.4294 | -0.0677 | |||
| FAF / First American Financial Corporation | 0.06 | 0.00 | 3.84 | -6.45 | 1.4153 | -0.0459 | |||
| SR / Spire Inc. | 0.05 | 0.00 | 3.83 | -6.72 | 1.4109 | -0.0499 | |||
| SWX / Southwest Gas Holdings, Inc. | 0.05 | 0.00 | 3.81 | 3.62 | 1.4013 | 0.0951 | |||
| AVT / Avnet, Inc. | 0.07 | 0.00 | 3.65 | 10.38 | 1.3430 | 0.1679 | |||
| GEF / Greif, Inc. | 0.05 | 0.00 | 3.47 | 18.16 | 1.2797 | 0.2340 | |||
| HTO / H2O America | 0.07 | 0.00 | 3.38 | -4.98 | 1.2449 | -0.0203 | |||
| REYN / Reynolds Consumer Products Inc. | 0.16 | 0.00 | 3.36 | -10.25 | 1.2393 | -0.0939 | |||
| CWEN / Clearway Energy, Inc. | 0.10 | 0.00 | 3.33 | 5.72 | 1.2257 | 0.1060 | |||
| UGI / UGI Corporation | 0.09 | 0.00 | 3.28 | 10.14 | 1.2084 | 0.1487 | |||
| WLY / John Wiley & Sons, Inc. | 0.07 | 0.00 | 3.21 | 0.16 | 1.1836 | 0.0423 | |||
| HNI / HNI Corporation | 0.07 | 0.00 | 3.20 | 10.91 | 1.1798 | 0.1523 | |||
| APAM / Artisan Partners Asset Management Inc. | 0.07 | 0.00 | 3.19 | 13.36 | 1.1751 | 0.1741 | |||
| BKE / The Buckle, Inc. | 0.07 | 0.00 | 3.17 | 18.34 | 1.1669 | 0.2146 | |||
| MDU / MDU Resources Group, Inc. | 0.18 | 0.00 | 3.00 | -1.41 | 1.1055 | 0.0225 | |||
| OTTR / Otter Tail Corporation | 0.04 | 0.00 | 2.97 | -4.07 | 1.0940 | -0.0075 | |||
| SEE / Sealed Air Corporation | 0.10 | 0.00 | 2.97 | 7.35 | 1.0926 | 0.1098 | |||
| MSM / MSC Industrial Direct Co., Inc. | 0.03 | 0.00 | 2.95 | 9.46 | 1.0871 | 0.1280 | |||
| NWBI / Northwest Bancshares, Inc. | 0.23 | 0.00 | 2.95 | 6.35 | 1.0854 | 0.0995 | |||
| UBSI / United Bankshares, Inc. | 0.08 | 0.00 | 2.88 | 5.08 | 1.0599 | 0.0857 | |||
| WU / The Western Union Company | 0.34 | 0.00 | 2.83 | -20.41 | 1.0427 | -0.2226 | |||
| CALM / Cal-Maine Foods, Inc. | 0.03 | 0.00 | 2.83 | 9.57 | 1.0422 | 0.1239 | |||
| FBP / First BanCorp. | 0.14 | 0.00 | 2.83 | 8.65 | 1.0407 | 0.1157 | |||
| FHB / First Hawaiian, Inc. | 0.11 | 0.00 | 2.81 | 2.15 | 1.0338 | 0.0562 | |||
| KMT / Kennametal Inc. | 0.12 | 0.00 | 2.79 | 7.81 | 1.0273 | 0.1069 | |||
| MGY / Magnolia Oil & Gas Corporation | 0.12 | 0.00 | 2.78 | -11.00 | 1.0248 | -0.0873 | |||
| NXST / Nexstar Media Group, Inc. | 0.02 | 0.00 | 2.76 | -3.50 | 1.0162 | -0.0008 | |||
| STR / Sitio Royalties Corp. | 0.15 | 0.00 | 2.73 | -7.50 | 1.0044 | -0.0442 | |||
| TNL / Travel + Leisure Co. | 0.05 | 0.00 | 2.72 | 11.49 | 1.0003 | 0.1338 | |||
| OMF / OneMain Holdings, Inc. | 0.05 | 0.00 | 2.67 | 16.60 | 0.9833 | 0.1689 | |||
| WAFD / WaFd, Inc | 0.09 | 0.00 | 2.65 | 2.43 | 0.9774 | 0.0560 | |||
| BOH / Bank of Hawaii Corporation | 0.04 | 0.00 | 2.61 | -2.10 | 0.9596 | 0.0131 | |||
| SFNC / Simmons First National Corporation | 0.14 | 0.00 | 2.57 | -7.66 | 0.9464 | -0.0433 | |||
| INSW / International Seaways, Inc. | 0.07 | 0.00 | 2.57 | 9.88 | 0.9458 | 0.1145 | |||
| STRA / Strategic Education, Inc. | 0.03 | 0.00 | 2.54 | 1.39 | 0.9372 | 0.0445 | |||
| LEVI / Levi Strauss & Co. | 0.14 | 0.00 | 2.54 | 18.60 | 0.9371 | 0.1740 | |||
| CRC / California Resources Corporation | 0.05 | 0.00 | 2.50 | 3.90 | 0.9222 | 0.0647 | |||
| TGNA / TEGNA Inc. | 0.15 | 0.00 | 2.48 | -7.98 | 0.9130 | -0.0455 | |||
| WSBC / WesBanco, Inc. | 0.08 | 0.00 | 2.46 | 2.16 | 0.9048 | 0.0495 | |||
| HOG / Harley-Davidson, Inc. | 0.10 | 0.00 | 2.45 | -6.52 | 0.9024 | -0.0300 | |||
| ASB / Associated Banc-Corp | 0.10 | 0.00 | 2.44 | 8.29 | 0.8997 | 0.0971 | |||
| OZK / Bank OZK | 0.05 | 0.00 | 2.43 | 8.34 | 0.8950 | 0.0969 | |||
| MUR / Murphy Oil Corporation | 0.11 | 0.00 | 2.38 | -20.77 | 0.8756 | -0.1918 | |||
| PFS / Provident Financial Services, Inc. | 0.13 | 0.00 | 2.36 | 2.12 | 0.8674 | 0.0469 | |||
| BC / Brunswick Corporation | 0.04 | 0.00 | 2.35 | 2.57 | 0.8660 | 0.0507 | |||
| FIBK / First Interstate BancSystem, Inc. | 0.08 | 0.00 | 2.35 | 0.60 | 0.8660 | 0.0346 | |||
| CVBF / CVB Financial Corp. | 0.12 | 0.00 | 2.35 | 7.21 | 0.8649 | 0.0857 | |||
| KTB / Kontoor Brands, Inc. | 0.04 | 0.00 | 2.35 | 2.85 | 0.8642 | 0.0529 | |||
| FFBC / First Financial Bancorp. | 0.10 | 0.00 | 2.32 | -2.89 | 0.8550 | 0.0048 | |||
| ENR / Energizer Holdings, Inc. | 0.11 | 0.00 | 2.29 | -32.64 | 0.8432 | -0.3654 | |||
| FULT / Fulton Financial Corporation | 0.13 | 0.00 | 2.28 | -0.31 | 0.8389 | 0.0265 | |||
| WEN / The Wendy's Company | 0.20 | 0.00 | 2.26 | -21.94 | 0.8336 | -0.1978 | |||
| AUB / Atlantic Union Bankshares Corporation | 0.07 | 0.00 | 2.22 | 0.41 | 0.8165 | 0.0315 | |||
| LNC / Lincoln National Corporation | 0.06 | 0.00 | 2.21 | -3.62 | 0.8133 | -0.0019 | |||
| CNXC / Concentrix Corporation | 0.04 | 0.00 | 2.20 | -5.02 | 0.8086 | -0.0135 | |||
| VNOM / Viper Energy, Inc. | 0.06 | 0.00 | 2.19 | -15.56 | 0.8077 | -0.1160 | |||
| INDB / Independent Bank Corp. | 0.03 | 0.00 | 2.18 | 0.37 | 0.8043 | 0.0304 | |||
| SHOO / Steven Madden, Ltd. | 0.09 | 0.00 | 2.18 | -9.96 | 0.8026 | -0.0585 | |||
| NOG / Northern Oil and Gas, Inc. | 0.08 | 0.00 | 2.17 | -6.23 | 0.7986 | -0.0238 | |||
| HASI / HA Sustainable Infrastructure Capital, Inc. | 0.08 | 0.00 | 2.14 | -8.15 | 0.7884 | -0.0405 | |||
| TRN / Trinity Industries, Inc. | 0.08 | 0.00 | 2.14 | -3.74 | 0.7863 | -0.0026 | |||
| LCII / LCI Industries | 0.02 | 0.00 | 2.10 | 4.27 | 0.7740 | 0.0573 | |||
| VLY / Valley National Bancorp | 0.23 | 0.00 | 2.09 | 0.48 | 0.7698 | 0.0297 | |||
| AVNT / Avient Corporation | 0.06 | 0.00 | 2.08 | -13.06 | 0.7677 | -0.0850 | |||
| MAN / ManpowerGroup Inc. | 0.05 | 0.00 | 2.08 | -30.21 | 0.7659 | -0.2938 | |||
| VAC / Marriott Vacations Worldwide Corporation | 0.03 | 0.00 | 2.06 | 12.54 | 0.7604 | 0.1080 | |||
| COLB / Columbia Banking System, Inc. | 0.09 | 0.00 | 2.06 | -6.27 | 0.7604 | -0.0230 | |||
| LAZ / Lazard, Inc. | 0.04 | 0.00 | 2.04 | 10.79 | 0.7527 | 0.0967 | |||
| KNTK / Kinetik Holdings Inc. | 0.05 | 0.00 | 2.02 | -15.21 | 0.7435 | -0.1032 | |||
| MC / Moelis & Company | 0.03 | 0.00 | 2.02 | 6.77 | 0.7434 | 0.0711 | |||
| AROC / Archrock, Inc. | 0.08 | 0.00 | 2.01 | -5.36 | 0.7408 | -0.0153 | |||
| SEM / Select Medical Holdings Corporation | 0.13 | 0.00 | 1.95 | -9.07 | 0.7196 | -0.0450 | |||
| PPBI / Pacific Premier Bancorp, Inc. | 0.09 | 0.00 | 1.95 | -1.07 | 0.7168 | 0.0170 | |||
| PII / Polaris Inc. | 0.05 | 0.00 | 1.94 | -0.72 | 0.7133 | 0.0195 | |||
| OLN / Olin Corporation | 0.10 | 0.00 | 1.92 | -17.14 | 0.7056 | -0.1166 | |||
| KGS / Kodiak Gas Services, Inc. | 0.05 | 0.00 | 1.64 | -8.11 | 0.6052 | -0.0310 | |||
| SLVM / Sylvamo Corporation | 0.03 | 0.00 | 1.60 | -25.29 | 0.5908 | -0.1730 | |||
| M / Macy's, Inc. | 0.14 | 0.00 | 1.60 | -7.21 | 0.5885 | -0.0237 | |||
| SM / SM Energy Company | 0.06 | 0.00 | 1.57 | -17.47 | 0.5776 | -0.0985 | |||
| AEO / American Eagle Outfitters, Inc. | 0.16 | 0.00 | 1.54 | -17.24 | 0.5660 | -0.0943 | |||
| KLG / WK Kellogg Co | 0.09 | 0.00 | 1.51 | -20.03 | 0.5546 | -0.1151 | |||
| NSP / Insperity, Inc. | 0.02 | 0.00 | 1.50 | -32.65 | 0.5534 | -0.2398 | |||
| OGN / Organon & Co. | 0.15 | 0.00 | 1.49 | -34.98 | 0.5478 | -0.2660 | |||
| UWMC / UWM Holdings Corporation | 0.35 | 0.00 | 1.43 | -24.19 | 0.5266 | -0.1441 | |||
| AESI / Atlas Energy Solutions Inc. | 0.11 | 0.00 | 1.42 | -25.08 | 0.5229 | -0.1509 | |||
| CC / The Chemours Company | 0.12 | 0.00 | 1.35 | -15.38 | 0.4966 | -0.0701 | |||
| HP / Helmerich & Payne, Inc. | 0.08 | 0.00 | 1.14 | -41.95 | 0.4196 | -0.2786 | |||
| US40428X1072 / HSBC U.S. Government Money Market Fund | 0.67 | -37.35 | 0.67 | -37.42 | 0.2485 | -0.1346 | |||
| US61747C7074 / Morgan Stanley Institutional Liquidity Funds Government Portfolio, Institutional Class | 0.67 | -37.35 | 0.67 | -37.42 | 0.2485 | -0.1346 | |||
| GSAXX / Goldman Sachs Trust - Goldman Sachs Financial Square Government Fund | 0.67 | -37.35 | 0.67 | -37.42 | 0.2485 | -0.1346 | |||
| US8252528851 / Invesco Government & Agency Portfolio, Institutional Class | 0.67 | -37.35 | 0.67 | -37.42 | 0.2485 | -0.1346 | |||
| RUSSELL 2000 MINI INDEX FUTURE SEP25 / DE (N/A) | 0.04 | 0.0152 | 0.0152 |