Dycom Industries, Inc.
| Security | DY / Dycom Industries, Inc. |
| Insider | Peter T Jr Pruitt |
This page shows the track record and history of Pruitt Peter T Jr
insider trades in Dycom Industries, Inc.. The SEC defines Insiders as officers, directors, or significant investors (greater than 10% ownership) in a company.
It is illegal for insiders to make trades in their companies based on material, non-public information ("MNPI"). This does not mean
it is illegal for them to make any
trades in their own companies. However, they must report all trades to the SEC via a Form 4.
Insider Purchases - Short Term Profit Analysis
In this section, we analyze the profitability of every unplanned, open-market insider purchase made by Peter T Jr Pruitt in DY / Dycom Industries, Inc.. This analysis helps to understand if the insider consistently generates abnormal returns, and is worth following. This analysis is for one-year following each trade, and the results are theoretical.
The following table shows the most recent open market purchases that were not part of an automatic trading plan.
| Trade Date | Reported Shares |
Reported Price |
Adjusted Shares |
Adjusted Price |
Cost Basis | Days to Max |
Price at Max |
Max Profit ($) |
Max Return (%) |
|---|---|---|---|---|---|---|---|
| There are no known unplanned open-market trades for this insider |
Adjusted Price is the split-adjusted price. Adjusted Shares is the split-adjusted shares.
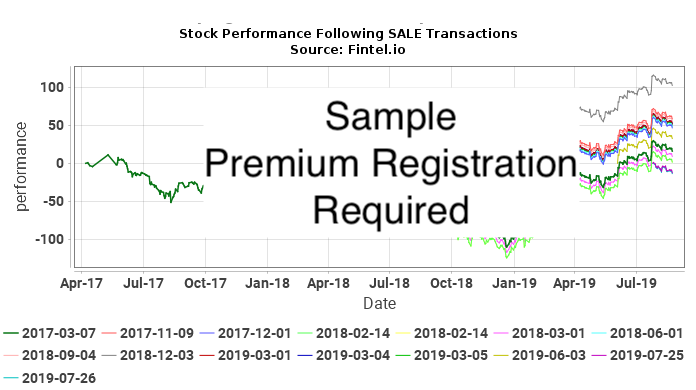
Insider Sales - Short Term Loss Analysis
In this section, we analyze the short-term loss avoidance of every unplanned, open-market insider sale made by Peter T Jr Pruitt in DY / Dycom Industries, Inc.. A consistent pattern of loss avoidance may suggest that future sale transactions may predict declines in price. This analysis is for one-year following each trade, and the results are theoretical.
The following table shows the most recent open market purchases that were not part of an automatic trading plan.
| Trade Date | Reported Shares |
Reported Price |
Adjusted Shares |
Adjusted Price |
Cost Basis | Days to Min |
Price at Min |
Max Loss Avoided ($) |
Max Loss Avoided (%) |
|---|---|---|---|---|---|---|---|---|---|
| 2025-01-10 | 2,900 | 175.0800 | 2,900 | 175.0800 | 507,732 | 59 | 136.7500 | -111,157 | -21.89 |
Adjusted Price is the split-adjusted price. Adjusted Shares is the split-adjusted shares.
Insider Transaction History
| File Date |
Trade Date |
Form | Insider | Ticker | Security Title | Code | Direct | Exercise Price |
Unit Price |
Units Changed |
Value Changed (1K) |
Remaining Options |
Remaining Shares |
|
|---|---|---|---|---|---|---|---|---|---|---|---|---|---|---|
| 2025-05-22 | 2025-05-22 | 4 | Pruitt Peter T Jr | DY | Restricted Stock Units | D | 781 | 15,314 | ||||||
| 2025-01-10 | 2025-01-10 | 4 | Pruitt Peter T Jr | DY | Common Stock | D | 175.0800 | -2,900 | -508 | 14,533 | ||||
| 2024-05-24 | 2024-05-23 | 4 | Pruitt Peter T Jr | DY | Restricted Stock Units | D | 1,014 | 17,433 | ||||||
| 2023-05-25 | 2023-05-25 | 4 | Pruitt Peter T Jr | DY | Restricted Stock Units | D | 1,747 | 16,419 | ||||||
| 2022-05-26 | 2022-05-26 | 4 | Pruitt Peter T Jr | DY | Restricted Stock Units | D | 1,679 | 14,672 | ||||||
| 2021-05-25 | 2021-05-25 | 4 | Pruitt Peter T Jr | DY | Restricted Stock Units | D | 1,905 | 12,993 | ||||||
| 2020-05-20 | 2020-05-19 | 4 | Pruitt Peter T Jr | DY | Restricted Stock Units | D | 4,087 | 11,088 | ||||||
| 2019-05-21 | 2019-05-21 | 4 | Pruitt Peter T Jr | DY | Restricted Stock Units | D | 2,575 | 7,001 | ||||||
| 2019-04-30 | 2019-04-29 | 4 | Pruitt Peter T Jr | DY | Common Stock | D | 49.2700 | 198 | 10 | 4,426 | ||||
| 2019-01-30 | 2019-01-28 | 4 | Pruitt Peter T Jr | DY | Common Stock | D | 60.0400 | 287 | 17 | 4,228 | ||||
| 2018-11-20 | 2018-11-19 | 4 | Pruitt Peter T Jr | DY | Restricted Stock Units | D | 1,041 | 3,941 | ||||||
| 2018-11-20 | 3 | Pruitt Peter T Jr | DY | Common Stock | D | 5,800 | ||||||||
| 2018-11-20 | 3 | Pruitt Peter T Jr | DY | Common Stock | D | 5,800 | ||||||||
| 2018-11-20 | 3 | Pruitt Peter T Jr | DY | Common Stock | D | 5,800 |
P
Pembelian sekuritas non-derivatif atau derivatif di pasar terbuka atau secara pribadi.
S
Penjualan terbuka atau penjualan pribadi atas sekuritas non-derivatif atau derivatif.
A
Hibah, penghargaan, atau perolehan sekuritas lainnya dari perusahaan (seperti opsi)
C
Konversi turunan
D
Penjualan atau pengalihan sekuritas kembali ke perusahaan.
F
Pembayaran harga pelaksanaan atau kewajiban pajak menggunakan sebagian sekuritas yang diterima dari perusahaan.
G
Pemberian sekuritas oleh atau kepada orang dalam.
K
Swap ekuitas dan transaksi lindung nilai serupa
M
Pelaksanaan atau konversi sekuritas derivatif yang diterima dari perusahaan (seperti opsi)
V
Transaksi yang dilaporkan secara sukarela pada Formulir 4.
J
Lainnya (disertai dengan catatan kaki yang menjelaskan transaksi tersebut)