Mga Batayang Estadistika
| Nilai Portofolio | $ 492,357,562 |
| Posisi Saat Ini | 87 |
Kepemilikan Terbaru, Kinerja, AUM (dari 13F, 13D)
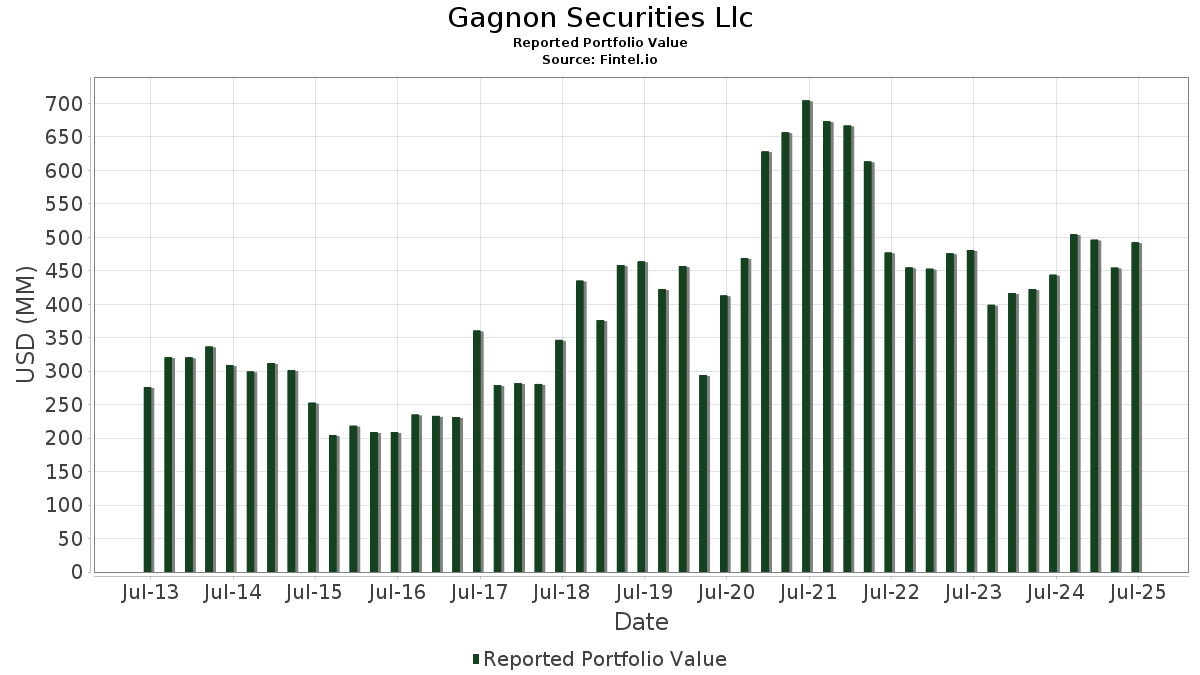
Gagnon Securities Llc telah mengungkapkan total kepemilikan 87 dalam pengajuan SEC terbaru mereka. Nilai portofolio terbaru dihitung sebesar $ 492,357,562 USD. Aset yang Dikelola (AUM) sebenarnya adalah nilai ini ditambah kas (yang tidak diungkapkan). Aset-aset utama Gagnon Securities Llc adalah Air Lease Corporation (US:AL) , The Ensign Group, Inc. (US:ENSG) , CareDx, Inc (US:CDNA) , Intuitive Surgical, Inc. (US:ISRG) , and GeneDx Holdings Corp. (US:WGS) . Industri unggulan Gagnon Securities Llc adalah "Communications" (sic 48) , "Engineering, Accounting, Research, Management, And Related Services" (sic 87) , and "Metal Mining" (sic 10) .
Peningkatan Tertinggi Kuartal Ini
Kami menggunakan perubahan dalam alokasi portofolio karena ini adalah metrik yang paling bermakna. Perubahan dapat disebabkan oleh perdagangan atau perubahan harga saham.
| Keamanan | Saham (MM) |
Nilai (Juta Dolar AS) |
Portfolio % | ΔPorsyento ng Portfolio |
|---|---|---|---|---|
| 1.90 | 11.24 | 2.2834 | 2.2834 | |
| 0.34 | 22.10 | 4.4877 | 1.5662 | |
| 0.74 | 43.07 | 8.7486 | 0.9783 | |
| 0.36 | 5.46 | 1.1098 | 0.8279 | |
| 1.55 | 30.27 | 6.1471 | 0.5953 | |
| 0.26 | 16.06 | 3.2625 | 0.5077 | |
| 0.28 | 14.81 | 3.0090 | 0.4312 | |
| 0.02 | 13.83 | 2.8099 | 0.3721 | |
| 0.21 | 32.24 | 6.5480 | 0.3097 | |
| 0.25 | 14.28 | 2.9007 | 0.2297 |
Penurunan Tertinggi Kuartal Ini
Kami menggunakan perubahan dalam alokasi portofolio karena ini adalah metrik yang paling bermakna. Perubahan dapat disebabkan oleh perdagangan atau perubahan harga saham.
| Keamanan | Saham (MM) |
Nilai (Juta Dolar AS) |
Portfolio % | ΔPorsyento ng Portfolio |
|---|---|---|---|---|
| 0.49 | 15.12 | 3.0710 | -0.5935 | |
| 0.04 | 1.03 | 0.2087 | -0.5457 | |
| 0.00 | 0.00 | -0.5407 | ||
| 2.25 | 13.23 | 2.6872 | -0.5366 | |
| 0.16 | 10.98 | 2.2307 | -0.4667 | |
| 0.27 | 25.04 | 5.0852 | -0.4662 | |
| 0.54 | 11.63 | 2.3620 | -0.3563 | |
| 0.03 | 4.78 | 0.9708 | -0.3174 | |
| 0.07 | 2.10 | 0.4266 | -0.2746 | |
| 0.05 | 29.25 | 5.9405 | -0.2382 |
Pengajuan 13D/G
Ini adalah daftar pengajuan 13D dan 13G yang dibuat dalam setahun terakhir (jika ada). Klik ikon tautan untuk melihat riwayat transaksi lengkap. Baris berwarna hijau menunjukkan posisi baru. Baris berwarna merah menunjukkan posisi yang sudah ditutup.
| Tanggal File | Formulir | Keamanan | Sebelumnya Saham |
Saat ini Saham |
ΔPersentase Saham | % Kepemilikan |
% ΔKepemilikan | |
|---|---|---|---|---|---|---|---|---|
| 2025-07-24 | CDNA / CareDx, Inc | 2,549,578 | 2,894,541 | 13.53 | 5.20 | 8.33 | ||
| 2025-05-15 | TMCI / Treace Medical Concepts, Inc. | 3,979,454 | 6.30 | |||||
| 2025-01-23 | PROF / Profound Medical Corp. | 2,905,406 | 3,346,743 | 15.19 | 11.20 | -5.08 | ||
| 2025-01-23 | PSIX / Power Solutions International, Inc. | 972,006 | 1,678,849 | 72.72 | 7.30 | -17.98 |
Pengajuan 13F dan Dana
Formulir ini diajukan pada 2025-07-23 untuk periode pelaporan 2025-06-30. Klik ikon tautan untuk melihat riwayat transaksi selengkapnya.
Tingkatkan ke versi premium untuk membuka data premium dan ekspor ke Excel. ![]() .
.
| Keamanan | Ketik | Harga Saham Rata-rata | Saham (MM) |
ΔSaham (%) |
ΔSaham (%) |
Nilai ($MM) |
Portpolyo (%) |
ΔPortofolio (%) |
|
|---|---|---|---|---|---|---|---|---|---|
| AL / Air Lease Corporation | 0.74 | 0.73 | 43.07 | 21.96 | 8.7486 | 0.9783 | |||
| ENSG / The Ensign Group, Inc. | 0.21 | -4.62 | 32.24 | 13.70 | 6.5480 | 0.3097 | |||
| CDNA / CareDx, Inc | 1.55 | 8.95 | 30.27 | 19.94 | 6.1471 | 0.5953 | |||
| ISRG / Intuitive Surgical, Inc. | 0.05 | -5.08 | 29.25 | 4.14 | 5.9405 | -0.2382 | |||
| WGS / GeneDx Holdings Corp. | 0.27 | -4.80 | 25.04 | -0.78 | 5.0852 | -0.4662 | |||
| PSIX / Power Solutions International, Inc. | 0.34 | -34.97 | 22.10 | 66.39 | 4.4877 | 1.5662 | |||
| CAKE / The Cheesecake Factory Incorporated | 0.26 | -0.38 | 16.06 | 28.29 | 3.2625 | 0.5077 | |||
| EPD / Enterprise Products Partners L.P. - Limited Partnership | 0.49 | -0.06 | 15.12 | -9.22 | 3.0710 | -0.5935 | |||
| EXAS / Exact Sciences Corporation | 0.28 | 3.00 | 14.81 | 26.43 | 3.0090 | 0.4312 | |||
| BL / BlackLine, Inc. | 0.25 | 0.60 | 14.28 | 17.64 | 2.9007 | 0.2297 | |||
| EQIX / Equinix, Inc. | 0.02 | 27.98 | 13.83 | 24.86 | 2.8099 | 0.3721 | |||
| FRSH / Freshworks Inc. | 0.92 | 5.44 | 13.79 | 11.42 | 2.7999 | 0.0778 | |||
| TMCI / Treace Medical Concepts, Inc. | 2.25 | 28.83 | 13.23 | -9.71 | 2.6872 | -0.5366 | |||
| AMRC / Ameresco, Inc. | 0.87 | -10.15 | 13.22 | 12.99 | 2.6848 | 0.1108 | |||
| NVGS / Navigator Holdings Ltd. | 0.87 | 2.27 | 12.32 | 8.73 | 2.5032 | 0.0094 | |||
| BLFS / BioLife Solutions, Inc. | 0.54 | -0.20 | 11.63 | -5.88 | 2.3620 | -0.3563 | |||
| ASPN / Aspen Aerogels, Inc. | 1.90 | 11.24 | 2.2834 | 2.2834 | |||||
| KMX / CarMax, Inc. | 0.16 | 3.86 | 10.98 | -10.42 | 2.2307 | -0.4667 | |||
| CARG / CarGurus, Inc. | 0.32 | -0.46 | 10.88 | 14.37 | 2.2088 | 0.1167 | |||
| FIVN / Five9, Inc. | 0.41 | 7.49 | 10.79 | 4.84 | 2.1914 | -0.0728 | |||
| PROF / Profound Medical Corp. | 1.75 | 3.08 | 10.32 | 4.49 | 2.0969 | -0.0768 | |||
| GNRC / Generac Holdings Inc. | 0.07 | 6.00 | 9.77 | 19.86 | 1.9834 | 0.1909 | |||
| VERX / Vertex, Inc. | 0.27 | 0.46 | 9.54 | 1.39 | 1.9366 | -0.1324 | |||
| PCRX / Pacira BioSciences, Inc. | 0.37 | 19.47 | 8.80 | 14.89 | 1.7881 | 0.1024 | |||
| CMG / Chipotle Mexican Grill, Inc. | 0.15 | 0.50 | 8.23 | 12.39 | 1.6713 | 0.0604 | |||
| AOSL / Alpha and Omega Semiconductor Limited | 0.22 | 0.57 | 5.54 | 3.82 | 1.1256 | -0.0490 | |||
| DV / DoubleVerify Holdings, Inc. | 0.36 | 280.88 | 5.46 | 326.54 | 1.1098 | 0.8279 | |||
| OSUR / OraSure Technologies, Inc. | 1.60 | 49.39 | 4.81 | 33.00 | 0.9774 | 0.1813 | |||
| SAM / The Boston Beer Company, Inc. | 0.03 | 2.18 | 4.78 | -18.38 | 0.9708 | -0.3174 | |||
| CTRE / CareTrust REIT, Inc. | 0.15 | -3.36 | 4.61 | 3.46 | 0.9357 | -0.0439 | |||
| PRLB / Proto Labs, Inc. | 0.11 | 17.36 | 4.59 | 34.12 | 0.9318 | 0.1792 | |||
| PNTG / The Pennant Group, Inc. | 0.15 | -0.40 | 4.52 | 18.20 | 0.9184 | 0.0768 | |||
| KLTR / Kaltura, Inc. | 2.18 | 0.15 | 4.37 | 7.07 | 0.8885 | -0.0103 | |||
| ICUI / ICU Medical, Inc. | 0.03 | 0.86 | 4.27 | -4.00 | 0.8673 | -0.1114 | |||
| NVDA / NVIDIA Corporation | 0.02 | 0.46 | 3.30 | 46.49 | 0.6695 | 0.1743 | |||
| SPGYF / Whitecap Resources Inc. | 0.49 | 35.76 | 3.27 | 41.50 | 0.6643 | 0.1558 | |||
| QDEL / QuidelOrtho Corporation | 0.07 | -20.03 | 2.10 | -34.09 | 0.4266 | -0.2746 | |||
| TPR / Tapestry, Inc. | 0.02 | -11.91 | 2.06 | 9.83 | 0.4177 | 0.0058 | |||
| MCHP / Microchip Technology Incorporated | 0.03 | 20.34 | 1.93 | 74.98 | 0.3921 | 0.1493 | |||
| NTDOY / Nintendo Co., Ltd. - Depositary Receipt (Common Stock) | 0.07 | -1.97 | 1.73 | 37.20 | 0.3506 | 0.0737 | |||
| SLG / SL Green Realty Corp. | 0.03 | 0.00 | 1.62 | 7.29 | 0.3289 | -0.0032 | |||
| CNF / CNFinance Holdings Limited - Depositary Receipt (Common Stock) | 1.94 | -7.93 | 1.26 | -23.29 | 0.2556 | -0.1053 | |||
| FLG / Flagstar Financial, Inc. | 0.12 | 12.55 | 1.25 | 2.71 | 0.2538 | -0.0140 | |||
| GNTX / Gentex Corporation | 0.06 | -1.18 | 1.24 | -6.69 | 0.2521 | -0.0407 | |||
| PTEN / Patterson-UTI Energy, Inc. | 0.20 | 27.20 | 1.21 | -8.18 | 0.2462 | -0.0444 | |||
| PFE / Pfizer Inc. | 0.04 | 8.63 | 1.05 | 3.87 | 0.2128 | -0.0090 | |||
| NCNO / nCino, Inc. | 0.04 | -70.57 | 1.03 | -70.04 | 0.2087 | -0.5457 | |||
| T / AT&T Inc. | 0.03 | -28.19 | 0.82 | -26.52 | 0.1667 | -0.0790 | |||
| GNL / Global Net Lease, Inc. | 0.11 | 0.00 | 0.80 | -6.13 | 0.1619 | -0.0248 | |||
| XOM / Exxon Mobil Corporation | 0.01 | 0.00 | 0.78 | -9.42 | 0.1584 | -0.0309 | |||
| CELC / Celcuity Inc. | 0.05 | -0.59 | 0.72 | 31.15 | 0.1464 | 0.0256 | |||
| SHOP / Shopify Inc. | 0.01 | 4.68 | 0.66 | 26.54 | 0.1337 | 0.0192 | |||
| DVN / Devon Energy Corporation | 0.02 | -51.43 | 0.65 | -58.70 | 0.1312 | -0.2129 | |||
| META / Meta Platforms, Inc. | 0.00 | 0.00 | 0.62 | 28.16 | 0.1258 | 0.0194 | |||
| SBUX / Starbucks Corporation | 0.01 | 15.80 | 0.52 | 8.18 | 0.1050 | -0.0001 | |||
| CVLT / Commvault Systems, Inc. | 0.00 | -1.81 | 0.50 | 8.44 | 0.1019 | 0.0002 | |||
| HIMX / Himax Technologies, Inc. - Depositary Receipt (Common Stock) | 0.05 | 0.00 | 0.49 | 21.45 | 0.0990 | 0.0107 | |||
| PYPL / PayPal Holdings, Inc. | 0.01 | -1.15 | 0.48 | 12.56 | 0.0984 | 0.0037 | |||
| APPS / Digital Turbine, Inc. | 0.08 | -15.95 | 0.48 | 82.58 | 0.0981 | 0.0399 | |||
| TECH / Bio-Techne Corporation | 0.01 | 3.66 | 0.48 | -9.16 | 0.0969 | -0.0185 | |||
| MRVL / Marvell Technology, Inc. | 0.01 | -44.83 | 0.47 | -30.74 | 0.0958 | -0.0538 | |||
| TTD / The Trade Desk, Inc. | 0.01 | -1.32 | 0.47 | 29.64 | 0.0952 | 0.0158 | |||
| GOOGL / Alphabet Inc. | 0.00 | 0.00 | 0.45 | 13.92 | 0.0915 | 0.0045 | |||
| SHOO / Steven Madden, Ltd. | 0.02 | 235.36 | 0.42 | 202.88 | 0.0856 | 0.0549 | |||
| LTH / Life Time Group Holdings, Inc. | 0.01 | 0.00 | 0.41 | 0.49 | 0.0838 | -0.0066 | |||
| WEAV / Weave Communications, Inc. | 0.05 | 7.67 | 0.38 | -19.14 | 0.0764 | -0.0261 | |||
| MU / Micron Technology, Inc. | 0.00 | -4.27 | 0.37 | 36.03 | 0.0752 | 0.0152 | |||
| MSFT / Microsoft Corporation | 0.00 | -1.70 | 0.34 | 30.30 | 0.0699 | 0.0118 | |||
| MRK / Merck & Co., Inc. | 0.00 | 0.00 | 0.32 | -11.88 | 0.0650 | -0.0148 | |||
| ATNM / Actinium Pharmaceuticals, Inc. | 0.23 | 0.00 | 0.32 | -12.91 | 0.0644 | -0.0158 | |||
| CGNX / Cognex Corporation | 0.01 | -1.69 | 0.31 | 4.41 | 0.0626 | -0.0023 | |||
| BLZE / Backblaze, Inc. | 0.06 | -1.15 | 0.30 | 12.64 | 0.0616 | 0.0023 | |||
| GAMB / Gambling.com Group Limited | 0.02 | -1.45 | 0.27 | -7.32 | 0.0542 | -0.0090 | |||
| DRRX / DURECT Corporation | 0.40 | 0.00 | 0.26 | -20.74 | 0.0521 | -0.0192 | |||
| ETSY / Etsy, Inc. | 0.00 | 0.00 | 0.25 | 6.38 | 0.0508 | -0.0010 | |||
| MBLY / Mobileye Global Inc. | 0.01 | 0.00 | 0.25 | 25.13 | 0.0507 | 0.0067 | |||
| VIAV / Viavi Solutions Inc. | 0.02 | -1.72 | 0.24 | -11.44 | 0.0488 | -0.0110 | |||
| WBA / Walgreens Boots Alliance, Inc. | 0.02 | 0.00 | 0.23 | 2.67 | 0.0471 | -0.0025 | |||
| RNG / RingCentral, Inc. | 0.01 | -1.77 | 0.23 | 12.94 | 0.0461 | 0.0017 | |||
| CEU / CES Energy Solutions Corp. | 0.05 | 0.00 | 0.22 | -5.49 | 0.0456 | -0.0067 | |||
| GDRX / GoodRx Holdings, Inc. | 0.04 | -53.03 | 0.22 | -47.07 | 0.0443 | -0.0461 | |||
| AKAM / Akamai Technologies, Inc. | 0.00 | -63.43 | 0.20 | -63.80 | 0.0411 | -0.0817 | |||
| DHX / DHI Group, Inc. | 0.06 | -1.47 | 0.17 | 111.39 | 0.0340 | 0.0165 | |||
| WBD / Warner Bros. Discovery, Inc. | 0.01 | 0.00 | 0.17 | 7.05 | 0.0339 | -0.0005 | |||
| YEXT / Yext, Inc. | 0.01 | 0.05 | 0.11 | 39.24 | 0.0223 | 0.0048 | |||
| RNTX / Rein Therapeutics Inc. | 0.07 | 0.00 | 0.10 | -20.63 | 0.0204 | -0.0075 | |||
| PETS / PetMed Express, Inc. | 0.02 | 0.00 | 0.08 | -21.00 | 0.0161 | -0.0059 | |||
| ONTO / Onto Innovation Inc. | 0.00 | -100.00 | 0.00 | 0.0000 | |||||
| IONQ / IonQ, Inc. | 0.00 | -100.00 | 0.00 | -100.00 | -0.5407 | ||||
| ETWO / E2open Parent Holdings, Inc. | 0.00 | -100.00 | 0.00 | 0.0000 | |||||
| VCEL / Vericel Corporation | 0.00 | -100.00 | 0.00 | 0.0000 | |||||
| BX / Blackstone Inc. | 0.00 | -100.00 | 0.00 | 0.0000 | |||||
| VRN / Veren Inc. | 0.00 | -100.00 | 0.00 | 0.0000 | |||||
| WFC / Wells Fargo & Company | 0.00 | -100.00 | 0.00 | 0.0000 | |||||
| MXCT / MaxCyte, Inc. | 0.00 | -100.00 | 0.00 | 0.0000 | |||||
| GAP / The Gap, Inc. | 0.00 | -100.00 | 0.00 | 0.0000 | |||||
| QSR / Restaurant Brands International Inc. | 0.00 | -100.00 | 0.00 | 0.0000 | |||||
| LAB / Standard BioTools Inc. | 0.00 | -100.00 | 0.00 | 0.0000 | |||||
| EOG / EOG Resources, Inc. | 0.00 | -100.00 | 0.00 | 0.0000 |