Mga Batayang Estadistika
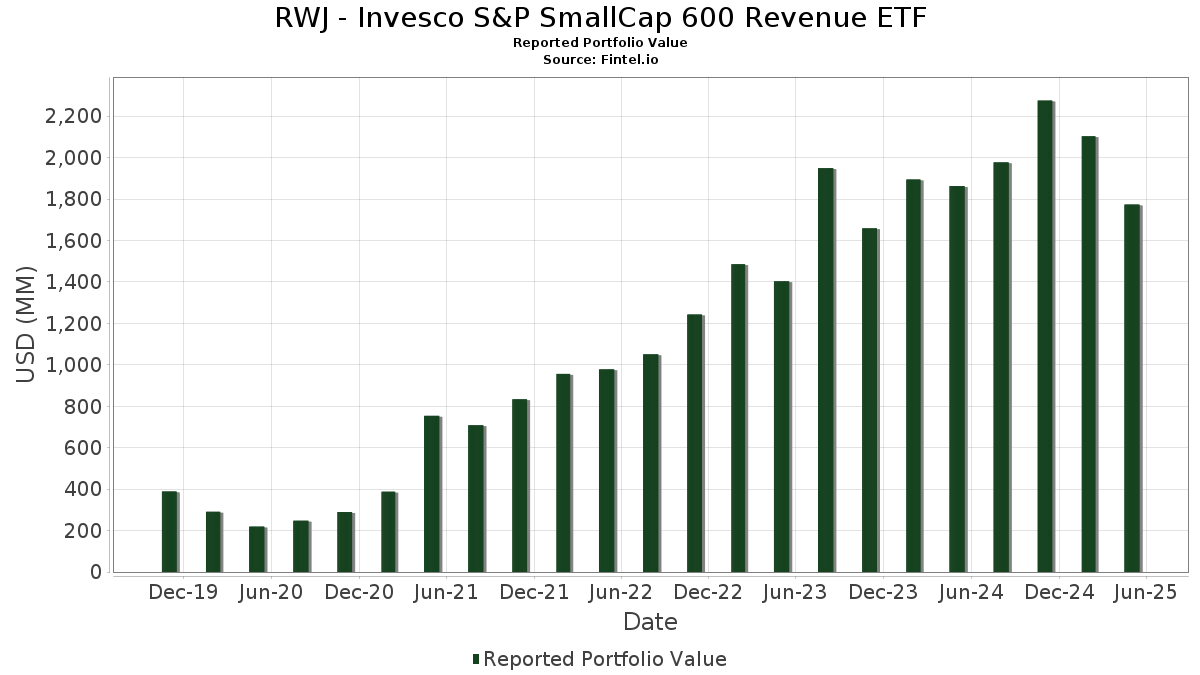
| Nilai Portofolio | $ 1,773,516,438 |
| Posisi Saat Ini | 602 |
Kepemilikan Terbaru, Kinerja, AUM (dari 13F, 13D)
RWJ - Invesco S&P SmallCap 600 Revenue ETF telah mengungkapkan total kepemilikan 602 dalam pengajuan SEC terbaru mereka. Nilai portofolio terbaru dihitung sebesar $ 1,773,516,438 USD. Aset yang Dikelola (AUM) sebenarnya adalah nilai ini ditambah kas (yang tidak diungkapkan). Aset-aset utama RWJ - Invesco S&P SmallCap 600 Revenue ETF adalah World Kinect Corporation (US:WKC) , United Natural Foods, Inc. (US:UNFI) , Group 1 Automotive, Inc. (US:GPI) , Lincoln National Corporation (US:LNC) , and BorgWarner Inc. (US:BWA) . Posisi baru RWJ - Invesco S&P SmallCap 600 Revenue ETF meliputi: BorgWarner Inc. (US:BWA) , Celanese Corporation (US:CE) , Sandisk Corporation (US:SNDK) , Millrose Properties, Inc. (US:MRP) , and FMC Corporation (US:FMC) .
Peningkatan Tertinggi Kuartal Ini
Kami menggunakan perubahan dalam alokasi portofolio karena ini adalah metrik yang paling bermakna. Perubahan dapat disebabkan oleh perdagangan atau perubahan harga saham.
| Keamanan | Saham (MM) |
Nilai (Juta Dolar AS) |
Portfolio % | ΔPorsyento ng Portfolio |
|---|---|---|---|---|
| 222.75 | 222.75 | 15.1759 | 15.1759 | |
| 83.82 | 83.82 | 5.7109 | 5.7109 | |
| 0.54 | 17.75 | 1.2094 | 1.2094 | |
| 0.21 | 11.12 | 0.7579 | 0.7579 | |
| 2.59 | 16.94 | 1.1542 | 0.4457 | |
| 0.57 | 11.84 | 0.8069 | 0.4321 | |
| 0.67 | 14.47 | 0.9856 | 0.3982 | |
| 0.15 | 5.80 | 0.3953 | 0.3953 | |
| 0.56 | 13.28 | 0.9049 | 0.3779 | |
| 0.15 | 10.23 | 0.6969 | 0.3492 |
Penurunan Tertinggi Kuartal Ini
Kami menggunakan perubahan dalam alokasi portofolio karena ini adalah metrik yang paling bermakna. Perubahan dapat disebabkan oleh perdagangan atau perubahan harga saham.
| Keamanan | Saham (MM) |
Nilai (Juta Dolar AS) |
Portfolio % | ΔPorsyento ng Portfolio |
|---|---|---|---|---|
| 1.65 | 45.14 | 3.0756 | -0.7176 | |
| 0.00 | 0.00 | -0.5787 | ||
| 0.00 | 0.00 | -0.5366 | ||
| 1.25 | 38.34 | 2.6122 | -0.2890 | |
| 0.08 | 17.52 | 1.1936 | -0.2263 | |
| 0.75 | 4.16 | 0.2837 | -0.2254 | |
| 0.05 | 21.38 | 1.4564 | -0.2171 | |
| 0.47 | 4.32 | 0.2941 | -0.2087 | |
| 0.30 | 10.53 | 0.7176 | -0.1386 | |
| 0.44 | 6.49 | 0.4421 | -0.1337 |
Pengajuan 13F dan Dana
Formulir ini diajukan pada 2025-07-28 untuk periode pelaporan 2025-05-31. Klik ikon tautan untuk melihat riwayat transaksi selengkapnya.
Tingkatkan ke versi premium untuk membuka data premium dan ekspor ke Excel. ![]() .
.
| Keamanan | Ketik | Harga Saham Rata-rata | Saham (MM) |
ΔSaham (%) |
ΔSaham (%) |
Nilai ($MM) |
Portpolyo (%) |
ΔPortofolio (%) |
|
|---|---|---|---|---|---|---|---|---|---|
| Invesco Private Prime Fund / STIV (N/A) | 222.75 | 222.75 | 15.1759 | 15.1759 | |||||
| Invesco Private Government Fund / STIV (N/A) | 83.82 | 83.82 | 5.7109 | 5.7109 | |||||
| WKC / World Kinect Corporation | 1.65 | -24.95 | 45.14 | -31.34 | 3.0756 | -0.7176 | |||
| UNFI / United Natural Foods, Inc. | 1.25 | -20.72 | 38.34 | -23.76 | 2.6122 | -0.2890 | |||
| GPI / Group 1 Automotive, Inc. | 0.05 | -20.11 | 21.38 | -26.31 | 1.4564 | -0.2171 | |||
| LNC / Lincoln National Corporation | 0.64 | 1.85 | 21.28 | -13.45 | 1.4501 | 0.0313 | |||
| BWA / BorgWarner Inc. | 0.54 | 17.75 | 1.2094 | 1.2094 | |||||
| ADNT / Adient plc | 1.13 | 5.47 | 17.63 | 3.87 | 1.2010 | 0.2219 | |||
| ABG / Asbury Automotive Group, Inc. | 0.08 | -16.18 | 17.52 | -28.82 | 1.1936 | -0.2263 | |||
| HTZ / Hertz Global Holdings, Inc. | 2.59 | -12.17 | 16.94 | 37.95 | 1.1542 | 0.4457 | |||
| SAH / Sonic Automotive, Inc. | 0.24 | -17.88 | 16.84 | -15.74 | 1.1475 | -0.0057 | |||
| KSS / Kohl's Corporation | 2.05 | 27.26 | 16.67 | -9.32 | 1.1360 | 0.0752 | |||
| PARR / Par Pacific Holdings, Inc. | 0.67 | -5.44 | 14.47 | 42.07 | 0.9856 | 0.3982 | |||
| AAP / Advance Auto Parts, Inc. | 0.29 | -11.75 | 14.11 | 14.63 | 0.9612 | 0.2512 | |||
| FL / Foot Locker, Inc. | 0.56 | 5.98 | 13.28 | 45.40 | 0.9049 | 0.3779 | |||
| DAN / Dana Incorporated | 0.79 | -30.84 | 13.13 | -22.65 | 0.8946 | -0.0847 | |||
| DXC / DXC Technology Company | 0.83 | -4.30 | 12.69 | -20.82 | 0.8644 | -0.0599 | |||
| AMTM / Amentum Holdings, Inc. | 0.57 | 73.32 | 11.84 | 82.31 | 0.8069 | 0.4321 | |||
| LUMN / Lumen Technologies, Inc. | 2.85 | -2.07 | 11.16 | -18.67 | 0.7603 | -0.0312 | |||
| CE / Celanese Corporation | 0.21 | 11.12 | 0.7579 | 0.7579 | |||||
| CVI / CVR Energy, Inc. | 0.46 | -17.76 | 10.82 | 4.43 | 0.7369 | 0.1394 | |||
| ANDE / The Andersons, Inc. | 0.30 | -14.50 | 10.53 | -29.03 | 0.7176 | -0.1386 | |||
| ABM / ABM Industries Incorporated | 0.20 | -3.84 | 10.50 | -6.81 | 0.7156 | 0.0654 | |||
| SIG / Signet Jewelers Limited | 0.15 | 33.40 | 10.23 | 69.75 | 0.6969 | 0.3492 | |||
| SPTN / SpartanNash Company | 0.52 | -25.40 | 10.11 | -28.09 | 0.6887 | -0.1223 | |||
| SANM / Sanmina Corporation | 0.11 | -16.50 | 9.51 | -13.67 | 0.6478 | 0.0124 | |||
| JBLU / JetBlue Airways Corporation | 1.83 | 4.61 | 9.27 | -18.98 | 0.6312 | -0.0285 | |||
| CWK / Cushman & Wakefield plc | 0.92 | 5.27 | 9.20 | -11.20 | 0.6271 | 0.0291 | |||
| REZI / Resideo Technologies, Inc. | 0.43 | 23.70 | 8.85 | 33.29 | 0.6031 | 0.2200 | |||
| GNW / Genworth Financial, Inc. | 1.21 | -9.14 | 8.55 | -7.84 | 0.5822 | 0.0473 | |||
| VSCO / Victoria's Secret & Co. | 0.40 | 111.21 | 8.42 | 67.60 | 0.5738 | 0.2839 | |||
| NSIT / Insight Enterprises, Inc. | 0.06 | -19.17 | 8.15 | -31.51 | 0.5556 | -0.1313 | |||
| OMI / Owens & Minor, Inc. | 1.23 | 17.33 | 8.11 | -19.17 | 0.5523 | -0.0263 | |||
| URBN / Urban Outfitters, Inc. | 0.12 | -23.27 | 8.04 | -7.83 | 0.5479 | 0.0445 | |||
| OI / O-I Glass, Inc. | 0.61 | -24.02 | 8.04 | -13.16 | 0.5478 | 0.0137 | |||
| DY / Dycom Industries, Inc. | 0.03 | -5.64 | 7.92 | 32.40 | 0.5399 | 0.1946 | |||
| RUSHA / Rush Enterprises, Inc. | 0.16 | -13.15 | 7.84 | -26.06 | 0.5343 | -0.0776 | |||
| PSMT / PriceSmart, Inc. | 0.07 | -9.70 | 7.09 | 9.09 | 0.4831 | 0.1081 | |||
| MCY / Mercury General Corporation | 0.11 | 1.36 | 7.05 | 21.20 | 0.4804 | 0.1447 | |||
| NWL / Newell Brands Inc. | 1.26 | 31.10 | 6.70 | 8.23 | 0.4562 | 0.0993 | |||
| SEM / Select Medical Holdings Corporation | 0.43 | -14.79 | 6.59 | -28.37 | 0.4493 | -0.0818 | |||
| GMS / GMS Inc. | 0.09 | 2.60 | 6.59 | -2.40 | 0.4490 | 0.0595 | |||
| AXL / American Axle & Manufacturing Holdings, Inc. | 1.49 | 15.96 | 6.56 | 2.63 | 0.4470 | 0.0782 | |||
| PENN / PENN Entertainment, Inc. | 0.44 | -5.70 | 6.49 | -34.99 | 0.4421 | -0.1337 | |||
| BCC / Boise Cascade Company | 0.07 | 9.55 | 6.47 | -8.20 | 0.4411 | 0.0343 | |||
| SEE / Sealed Air Corporation | 0.20 | -8.02 | 6.34 | -13.35 | 0.4319 | 0.0098 | |||
| EAT / Brinker International, Inc. | 0.04 | -27.14 | 6.27 | -23.69 | 0.4272 | -0.0468 | |||
| MTH / Meritage Homes Corporation | 0.10 | -5.21 | 6.18 | -16.80 | 0.4208 | -0.0075 | |||
| ASO / Academy Sports and Outdoors, Inc. | 0.15 | -7.07 | 6.04 | -23.34 | 0.4116 | -0.0430 | |||
| SNDK / Sandisk Corporation | 0.15 | 5.80 | 0.3953 | 0.3953 | |||||
| SNDR / Schneider National, Inc. | 0.24 | 0.30 | 5.62 | -11.89 | 0.3830 | 0.0149 | |||
| AEO / American Eagle Outfitters, Inc. | 0.51 | 16.58 | 5.59 | -2.39 | 0.3809 | 0.0505 | |||
| ADS / Bread Financial Holdings Inc | 0.11 | 3.30 | 5.57 | -1.97 | 0.3797 | 0.0517 | |||
| XRX / Xerox Holdings Corporation | 1.13 | 10.15 | 5.54 | -18.76 | 0.3771 | -0.0160 | |||
| FDP / Fresh Del Monte Produce Inc. | 0.16 | -11.86 | 5.51 | 2.11 | 0.3756 | 0.0641 | |||
| RHI / Robert Half Inc. | 0.12 | 6.43 | 5.47 | -17.53 | 0.3729 | -0.0099 | |||
| GVA / Granite Construction Incorporated | 0.06 | 4.95 | 5.39 | 13.70 | 0.3674 | 0.0937 | |||
| TDS / Telephone and Data Systems, Inc. | 0.16 | -25.95 | 5.37 | -29.52 | 0.3661 | -0.0737 | |||
| LEG / Leggett & Platt, Incorporated | 0.59 | 9.96 | 5.35 | 8.66 | 0.3644 | 0.0804 | |||
| GO / Grocery Outlet Holding Corp. | 0.39 | 22.67 | 5.30 | 40.33 | 0.3611 | 0.1432 | |||
| MYRG / MYR Group Inc. | 0.03 | 9.35 | 5.08 | 39.74 | 0.3462 | 0.1364 | |||
| NATL / NCR Atleos Corporation | 0.19 | 6.59 | 5.03 | -0.65 | 0.3425 | 0.0506 | |||
| CHEF / The Chefs' Warehouse, Inc. | 0.08 | -28.28 | 4.99 | -26.92 | 0.3402 | -0.0539 | |||
| MRP / Millrose Properties, Inc. | 0.18 | 4.99 | 0.3399 | 0.3399 | |||||
| CBRL / Cracker Barrel Old Country Store, Inc. | 0.09 | -8.44 | 4.95 | 16.11 | 0.3374 | 0.0914 | |||
| MODG / Topgolf Callaway Brands Corp. | 0.76 | 5.68 | 4.81 | 2.60 | 0.3275 | 0.0572 | |||
| BTU / Peabody Energy Corporation | 0.36 | 34.31 | 4.79 | 28.18 | 0.3261 | 0.1107 | |||
| NAVI / Navient Corporation | 0.36 | -18.15 | 4.77 | -23.13 | 0.3252 | -0.0330 | |||
| CNK / Cinemark Holdings, Inc. | 0.14 | 15.06 | 4.76 | 51.75 | 0.3240 | 0.1432 | |||
| SKYW / SkyWest, Inc. | 0.05 | 9.32 | 4.75 | 12.13 | 0.3238 | 0.0793 | |||
| FMC / FMC Corporation | 0.11 | 4.65 | 0.3171 | 0.3171 | |||||
| PLXS / Plexus Corp. | 0.04 | 5.35 | 4.63 | 4.02 | 0.3155 | 0.0587 | |||
| VSAT / Viasat, Inc. | 0.53 | -21.96 | 4.62 | -22.05 | 0.3146 | -0.0271 | |||
| CC / The Chemours Company | 0.45 | 4.60 | 0.3137 | 0.3137 | |||||
| ECG / Everus Construction Group, Inc. | 0.08 | 35.49 | 4.59 | 88.65 | 0.3125 | 0.1722 | |||
| TPH / Tri Pointe Homes, Inc. | 0.16 | -0.64 | 4.58 | -7.48 | 0.3120 | 0.0264 | |||
| CAKE / The Cheesecake Factory Incorporated | 0.08 | -18.32 | 4.57 | -16.61 | 0.3114 | -0.0048 | |||
| QRVO / Qorvo, Inc. | 0.06 | -26.66 | 4.57 | -23.29 | 0.3112 | -0.0323 | |||
| MHO / M/I Homes, Inc. | 0.04 | 10.17 | 4.51 | 0.27 | 0.3073 | 0.0478 | |||
| UPBD / Upbound Group, Inc. | 0.20 | 10.00 | 4.49 | -2.27 | 0.3057 | 0.0408 | |||
| EXPI / eXp World Holdings, Inc. | 0.53 | 7.88 | 4.47 | -9.10 | 0.3049 | 0.0209 | |||
| MDU / MDU Resources Group, Inc. | 0.25 | -24.26 | 4.36 | -24.53 | 0.2972 | -0.0362 | |||
| OGN / Organon & Co. | 0.47 | -19.91 | 4.32 | -50.48 | 0.2941 | -0.2087 | |||
| MOGA / Moog, Inc. - Class A | 0.02 | -6.63 | 4.24 | 1.48 | 0.2889 | 0.0478 | |||
| RXO / RXO, Inc. | 0.27 | 44.01 | 4.21 | 9.27 | 0.2867 | 0.0645 | |||
| DFH / Dream Finders Homes, Inc. | 0.20 | 6.35 | 4.19 | -7.22 | 0.2855 | 0.0249 | |||
| PTEN / Patterson-UTI Energy, Inc. | 0.75 | -28.97 | 4.16 | -52.82 | 0.2837 | -0.2254 | |||
| GTES / Gates Industrial Corporation plc | 0.20 | -10.49 | 4.13 | -12.53 | 0.2812 | 0.0090 | |||
| PATK / Patrick Industries, Inc. | 0.05 | -17.72 | 4.03 | -22.02 | 0.2744 | -0.0236 | |||
| FUL / H.B. Fuller Company | 0.07 | 6.05 | 3.98 | 4.33 | 0.2709 | 0.0510 | |||
| UVV / Universal Corporation | 0.06 | -16.46 | 3.96 | 1.90 | 0.2700 | 0.0456 | |||
| BLMN / Bloomin' Brands, Inc. | 0.52 | 0.92 | 3.94 | -17.92 | 0.2687 | -0.0084 | |||
| SPNT / SiriusPoint Ltd. | 0.20 | -15.30 | 3.91 | 8.14 | 0.2661 | 0.0578 | |||
| NCR / NCR Corp. | 0.35 | 8.98 | 3.89 | 7.13 | 0.2654 | 0.0556 | |||
| ARCB / ArcBest Corporation | 0.06 | 14.15 | 3.88 | -9.14 | 0.2640 | 0.0179 | |||
| HUBG / Hub Group, Inc. | 0.11 | 2.86 | 3.86 | -15.64 | 0.2631 | -0.0010 | |||
| LCII / LCI Industries | 0.04 | -1.99 | 3.86 | -17.74 | 0.2629 | -0.0077 | |||
| SBH / Sally Beauty Holdings, Inc. | 0.44 | 7.32 | 3.84 | 3.64 | 0.2618 | 0.0479 | |||
| GIII / G-III Apparel Group, Ltd. | 0.13 | 6.26 | 3.83 | 14.05 | 0.2611 | 0.0672 | |||
| CALM / Cal-Maine Foods, Inc. | 0.04 | 11.61 | 3.78 | 18.43 | 0.2574 | 0.0734 | |||
| US71880K1016 / Phinia Inc | 0.09 | -4.04 | 3.78 | -15.55 | 0.2572 | -0.0007 | |||
| LBRT / Liberty Energy Inc. | 0.32 | -2.98 | 3.73 | -34.90 | 0.2541 | -0.0764 | |||
| ETSY / Etsy, Inc. | 0.07 | -1.57 | 3.72 | 6.41 | 0.2535 | 0.0518 | |||
| AL / Air Lease Corporation | 0.06 | -10.16 | 3.72 | 8.02 | 0.2534 | 0.0547 | |||
| SCSC / ScanSource, Inc. | 0.09 | 8.87 | 3.68 | 20.08 | 0.2506 | 0.0739 | |||
| HBI / Hanesbrands Inc. | 0.74 | 3.70 | 3.66 | -14.87 | 0.2492 | 0.0013 | |||
| KALU / Kaiser Aluminum Corporation | 0.05 | -5.87 | 3.62 | -3.41 | 0.2468 | 0.0304 | |||
| JXN / Jackson Financial Inc. | 0.04 | -28.43 | 3.59 | -36.03 | 0.2444 | -0.0791 | |||
| TTMI / TTM Technologies, Inc. | 0.12 | -9.12 | 3.56 | 12.56 | 0.2424 | 0.0601 | |||
| CCS / Century Communities, Inc. | 0.07 | -4.62 | 3.55 | -28.75 | 0.2417 | -0.0455 | |||
| WS / Worthington Steel, Inc. | 0.14 | 27.68 | 3.40 | 19.19 | 0.2319 | 0.0672 | |||
| EYE / National Vision Holdings, Inc. | 0.17 | -26.38 | 3.37 | 14.76 | 0.2293 | 0.0601 | |||
| IAC / IAC Inc. | 0.09 | -22.45 | 3.36 | -39.66 | 0.2286 | -0.0922 | |||
| SLVM / Sylvamo Corporation | 0.06 | 6.03 | 3.33 | -21.00 | 0.2271 | -0.0163 | |||
| MLKN / MillerKnoll, Inc. | 0.20 | -2.02 | 3.33 | -23.12 | 0.2270 | -0.0230 | |||
| VIRT / Virtu Financial, Inc. | 0.08 | -11.08 | 3.33 | -2.26 | 0.2266 | 0.0303 | |||
| GES / Guess?, Inc. | 0.32 | 19.14 | 3.31 | 22.92 | 0.2258 | 0.0702 | |||
| AHCO / AdaptHealth Corp. | 0.37 | -22.16 | 3.30 | -38.59 | 0.2251 | -0.0852 | |||
| CRC / California Resources Corporation | 0.07 | 14.13 | 3.29 | 12.96 | 0.2245 | 0.0562 | |||
| HSC / Enviri Corp | 0.40 | -7.31 | 3.23 | 16.25 | 0.2199 | 0.0597 | |||
| CNXN / PC Connection, Inc. | 0.05 | -7.44 | 3.22 | -5.12 | 0.2197 | 0.0236 | |||
| GBX / The Greenbrier Companies, Inc. | 0.07 | -3.76 | 3.19 | -22.80 | 0.2173 | -0.0211 | |||
| TGNA / TEGNA Inc. | 0.19 | -15.35 | 3.15 | -22.25 | 0.2148 | -0.0191 | |||
| KTB / Kontoor Brands, Inc. | 0.05 | 13.11 | 3.15 | 19.31 | 0.2147 | 0.0623 | |||
| COOP / Mr. Cooper Group Inc. | 0.02 | -9.63 | 3.14 | 4.17 | 0.2142 | 0.0401 | |||
| MATX / Matson, Inc. | 0.03 | -14.26 | 3.14 | -32.84 | 0.2140 | -0.0558 | |||
| BOOT / Boot Barn Holdings, Inc. | 0.02 | 15.63 | 3.13 | 51.40 | 0.2134 | 0.0940 | |||
| PBI / Pitney Bowes Inc. | 0.30 | -43.96 | 3.12 | -46.72 | 0.2126 | -0.1252 | |||
| ACA / Arcosa, Inc. | 0.04 | 9.93 | 3.07 | 13.04 | 0.2091 | 0.0525 | |||
| LRN / Stride, Inc. | 0.02 | -27.79 | 3.06 | -20.09 | 0.2081 | -0.0124 | |||
| 0ADI / Teleflex Incorporated | 0.02 | 3.05 | 0.2078 | 0.2078 | |||||
| KFY / Korn Ferry | 0.04 | -18.11 | 3.02 | -15.18 | 0.2056 | 0.0004 | |||
| IBP / Installed Building Products, Inc. | 0.02 | -5.64 | 2.96 | -12.21 | 0.2014 | 0.0072 | |||
| ITRI / Itron, Inc. | 0.03 | -14.44 | 2.95 | -9.18 | 0.2008 | 0.0136 | |||
| ENVA / Enova International, Inc. | 0.03 | -6.14 | 2.95 | -15.83 | 0.2007 | -0.0012 | |||
| TRN / Trinity Industries, Inc. | 0.11 | -5.24 | 2.94 | -21.56 | 0.2003 | -0.0159 | |||
| WGO / Winnebago Industries, Inc. | 0.09 | 14.51 | 2.92 | -3.86 | 0.1987 | 0.0237 | |||
| HNI / HNI Corporation | 0.06 | -6.74 | 2.88 | -6.86 | 0.1961 | 0.0178 | |||
| THS / TreeHouse Foods, Inc. | 0.13 | -9.39 | 2.84 | -35.36 | 0.1935 | -0.0599 | |||
| WERN / Werner Enterprises, Inc. | 0.11 | 0.44 | 2.83 | -19.96 | 0.1929 | -0.0112 | |||
| AMR / Alpha Metallurgical Resources, Inc. | 0.03 | 24.11 | 2.83 | 1.15 | 0.1925 | 0.0313 | |||
| PRG / PROG Holdings, Inc. | 0.10 | 38.36 | 2.82 | 40.60 | 0.1921 | 0.0764 | |||
| OII / Oceaneering International, Inc. | 0.15 | 9.71 | 2.82 | -5.28 | 0.1920 | 0.0203 | |||
| FTDR / Frontdoor, Inc. | 0.05 | 16.73 | 2.81 | 41.21 | 0.1917 | 0.0767 | |||
| GFF / Griffon Corporation | 0.04 | -11.69 | 2.81 | -16.08 | 0.1913 | -0.0017 | |||
| FUN / Six Flags Entertainment Corporation | 0.08 | 12.83 | 2.76 | -13.87 | 0.1883 | 0.0031 | |||
| ALGT / Allegiant Travel Company | 0.05 | 21.71 | 2.74 | -7.97 | 0.1865 | 0.0149 | |||
| GEO / The GEO Group, Inc. | 0.10 | -17.90 | 2.73 | -18.56 | 0.1862 | -0.0074 | |||
| GOLF / Acushnet Holdings Corp. | 0.04 | 2.72 | 0.1852 | 0.1852 | |||||
| BHE / Benchmark Electronics, Inc. | 0.07 | -5.00 | 2.70 | -13.18 | 0.1840 | 0.0046 | |||
| AMN / AMN Healthcare Services, Inc. | 0.13 | -20.37 | 2.69 | -33.60 | 0.1835 | -0.0505 | |||
| PLAY / Dave & Buster's Entertainment, Inc. | 0.12 | 16.53 | 2.69 | 22.50 | 0.1833 | 0.0566 | |||
| VSH / Vishay Intertechnology, Inc. | 0.19 | -19.06 | 2.67 | -33.56 | 0.1821 | -0.0500 | |||
| BGC / BGC Group, Inc. | 0.29 | -15.86 | 2.65 | -21.13 | 0.1803 | -0.0133 | |||
| CAL / Caleres, Inc. | 0.19 | 29.03 | 2.60 | 7.38 | 0.1774 | 0.0375 | |||
| SABR / Sabre Corporation | 1.02 | -2.59 | 2.57 | -40.59 | 0.1753 | -0.0744 | |||
| AIR / AAR Corp. | 0.04 | -17.98 | 2.56 | -22.54 | 0.1742 | -0.0162 | |||
| PLUS / ePlus inc. | 0.04 | -3.08 | 2.54 | 7.48 | 0.1733 | 0.0367 | |||
| FWRD / Forward Air Corporation | 0.15 | 66.02 | 2.53 | 24.00 | 0.1725 | 0.0547 | |||
| RHP / Ryman Hospitality Properties, Inc. | 0.03 | 2.53 | 0.1725 | 0.1725 | |||||
| ATGE / Adtalem Global Education Inc. | 0.02 | -26.03 | 2.53 | -4.56 | 0.1724 | 0.0195 | |||
| UNF / UniFirst Corporation | 0.01 | -23.43 | 2.51 | -32.83 | 0.1709 | -0.0445 | |||
| HI / Hillenbrand, Inc. | 0.13 | -4.65 | 2.50 | -37.70 | 0.1704 | -0.0612 | |||
| RUN / Sunrun Inc. | 0.33 | 22.20 | 2.50 | 26.24 | 0.1701 | 0.0560 | |||
| QDEL / QuidelOrtho Corporation | 0.08 | -14.99 | 2.49 | -34.81 | 0.1693 | -0.0506 | |||
| KLG / WK Kellogg Co | 0.15 | -20.52 | 2.48 | -32.15 | 0.1690 | -0.0419 | |||
| DNOW / DNOW Inc. | 0.17 | -22.90 | 2.47 | -30.42 | 0.1682 | -0.0365 | |||
| CRGY / Crescent Energy Company | 0.29 | 13.85 | 2.47 | -24.30 | 0.1681 | -0.0200 | |||
| ENR / Energizer Holdings, Inc. | 0.11 | -4.39 | 2.46 | -27.53 | 0.1677 | -0.0283 | |||
| ICUI / ICU Medical, Inc. | 0.02 | -8.57 | 2.44 | -15.75 | 0.1662 | -0.0008 | |||
| SNEX / StoneX Group Inc. | 0.03 | 10.18 | 2.43 | -22.71 | 0.1658 | -0.0158 | |||
| SPXC / SPX Technologies, Inc. | 0.02 | -4.60 | 2.43 | -0.41 | 0.1657 | 0.0249 | |||
| HCSG / Healthcare Services Group, Inc. | 0.17 | -9.23 | 2.40 | 21.92 | 0.1638 | 0.0500 | |||
| WWW / Wolverine World Wide, Inc. | 0.14 | 35.29 | 2.39 | 56.06 | 0.1631 | 0.0746 | |||
| FSS / Federal Signal Corporation | 0.03 | -5.98 | 2.39 | 8.84 | 0.1628 | 0.0361 | |||
| RDNT / RadNet, Inc. | 0.04 | 34.18 | 2.39 | 39.08 | 0.1627 | 0.0636 | |||
| LZB / La-Z-Boy Incorporated | 0.06 | -12.57 | 2.37 | -19.04 | 0.1614 | -0.0074 | |||
| AX / Axos Financial, Inc. | 0.03 | 0.83 | 2.35 | 4.97 | 0.1598 | 0.0309 | |||
| KOP / Koppers Holdings Inc. | 0.08 | -11.95 | 2.34 | -7.07 | 0.1594 | 0.0141 | |||
| SHOO / Steven Madden, Ltd. | 0.09 | 33.37 | 2.33 | 0.26 | 0.1590 | 0.0247 | |||
| CNR / Core Natural Resources, Inc. | 0.03 | 23.43 | 2.33 | 15.20 | 0.1585 | 0.0420 | |||
| WSC / WillScot Holdings Corporation | 0.09 | 2.32 | 0.1582 | 0.1582 | |||||
| CRI / Carter's, Inc. | 0.07 | 0.29 | 2.31 | -23.76 | 0.1572 | -0.0174 | |||
| CXW / CoreCivic, Inc. | 0.10 | -17.52 | 2.30 | -3.48 | 0.1568 | 0.0193 | |||
| HZO / MarineMax, Inc. | 0.11 | -1.66 | 2.30 | -17.77 | 0.1565 | -0.0046 | |||
| PZZA / Papa John's International, Inc. | 0.05 | -19.78 | 2.28 | -19.96 | 0.1554 | -0.0090 | |||
| SM / SM Energy Company | 0.10 | 13.69 | 2.28 | -18.59 | 0.1552 | -0.0062 | |||
| STC / Stewart Information Services Corporation | 0.04 | -18.38 | 2.27 | -30.85 | 0.1546 | -0.0346 | |||
| ESI / Element Solutions Inc | 0.11 | 2.25 | 0.1530 | 0.1530 | |||||
| KMT / Kennametal Inc. | 0.10 | -2.20 | 2.22 | -4.84 | 0.1515 | 0.0167 | |||
| BKU / BankUnited, Inc. | 0.07 | -5.65 | 2.22 | -14.68 | 0.1513 | 0.0011 | |||
| OSIS / OSI Systems, Inc. | 0.01 | -15.95 | 2.22 | -10.70 | 0.1513 | 0.0078 | |||
| SCL / Stepan Company | 0.04 | 0.31 | 2.22 | -11.81 | 0.1511 | 0.0060 | |||
| GRBK / Green Brick Partners, Inc. | 0.04 | -9.34 | 2.21 | -11.30 | 0.1508 | 0.0069 | |||
| MBC / MasterBrand, Inc. | 0.22 | -6.51 | 2.20 | -31.85 | 0.1499 | -0.0363 | |||
| MD / Pediatrix Medical Group, Inc. | 0.16 | -21.87 | 2.20 | -25.16 | 0.1498 | -0.0197 | |||
| DORM / Dorman Products, Inc. | 0.02 | -13.39 | 2.19 | -14.80 | 0.1494 | 0.0009 | |||
| SXT / Sensient Technologies Corporation | 0.02 | -17.41 | 2.18 | 12.48 | 0.1487 | 0.0368 | |||
| EPC / Edgewell Personal Care Company | 0.08 | -12.99 | 2.16 | -23.62 | 0.1474 | -0.0160 | |||
| NOG / Northern Oil and Gas, Inc. | 0.08 | 22.89 | 2.14 | 3.68 | 0.1461 | 0.0268 | |||
| CON / Concentra Group Holdings Parent, Inc. | 0.10 | -25.95 | 2.14 | -29.05 | 0.1459 | -0.0283 | |||
| DLX / Deluxe Corporation | 0.15 | 15.81 | 2.08 | 0.39 | 0.1419 | 0.0222 | |||
| KAR / OPENLANE, Inc. | 0.09 | -21.48 | 2.08 | -19.25 | 0.1415 | -0.0069 | |||
| AVA / Avista Corporation | 0.05 | -27.23 | 2.07 | -29.87 | 0.1409 | -0.0293 | |||
| TRIP / Tripadvisor, Inc. | 0.14 | -22.01 | 2.05 | -24.95 | 0.1393 | -0.0179 | |||
| TALO / Talos Energy Inc. | 0.25 | -1.13 | 2.04 | -11.67 | 0.1393 | 0.0058 | |||
| BANC / Banc of California, Inc. | 0.15 | 19.02 | 2.03 | 9.83 | 0.1385 | 0.0317 | |||
| SHAK / Shake Shack Inc. | 0.02 | 26.55 | 2.02 | 51.27 | 0.1377 | 0.0606 | |||
| OUT / OUTFRONT Media Inc. | 0.12 | -12.85 | 2.00 | -22.60 | 0.1361 | -0.0128 | |||
| ENOV / Enovis Corporation | 0.06 | 1.95 | 0.1325 | 0.1325 | |||||
| CENX / Century Aluminum Company | 0.12 | -8.95 | 1.93 | -25.59 | 0.1316 | -0.0181 | |||
| BJRI / BJ's Restaurants, Inc. | 0.04 | -16.49 | 1.93 | -2.28 | 0.1312 | 0.0175 | |||
| TRUP / Trupanion, Inc. | 0.04 | 23.08 | 1.92 | 68.27 | 0.1308 | 0.0649 | |||
| MTX / Minerals Technologies Inc. | 0.03 | -11.73 | 1.92 | -27.12 | 0.1308 | -0.0211 | |||
| FULT / Fulton Financial Corporation | 0.11 | -6.35 | 1.91 | -18.53 | 0.1304 | -0.0051 | |||
| PRA / ProAssurance Corporation | 0.08 | -16.11 | 1.89 | 24.42 | 0.1288 | 0.0411 | |||
| FELE / Franklin Electric Co., Inc. | 0.02 | -18.90 | 1.89 | -31.41 | 0.1286 | -0.0301 | |||
| DXPE / DXP Enterprises, Inc. | 0.02 | -24.90 | 1.88 | -31.36 | 0.1281 | -0.0299 | |||
| ALG / Alamo Group Inc. | 0.01 | -22.09 | 1.88 | -11.80 | 0.1278 | 0.0051 | |||
| ITGR / Integer Holdings Corporation | 0.02 | -7.70 | 1.87 | -11.01 | 0.1272 | 0.0062 | |||
| SXC / SunCoke Energy, Inc. | 0.23 | 0.82 | 1.86 | -9.51 | 0.1270 | 0.0081 | |||
| ZWS / Zurn Elkay Water Solutions Corporation | 0.05 | -5.17 | 1.86 | -3.17 | 0.1269 | 0.0160 | |||
| ABCB / Ameris Bancorp | 0.03 | -6.92 | 1.86 | -11.41 | 0.1265 | 0.0056 | |||
| TDC / Teradata Corporation | 0.08 | 1.85 | 0.1262 | 0.1262 | |||||
| HMN / Horace Mann Educators Corporation | 0.04 | -21.13 | 1.84 | -19.07 | 0.1255 | -0.0058 | |||
| AMWD / American Woodmark Corporation | 0.03 | 10.78 | 1.83 | 0.55 | 0.1247 | 0.0197 | |||
| WOR / Worthington Enterprises, Inc. | 0.03 | -54.48 | 1.83 | -36.14 | 0.1245 | -0.0406 | |||
| ASTH / Astrana Health, Inc. | 0.07 | 17.04 | 1.83 | 14.34 | 0.1244 | 0.0323 | |||
| SMP / Standard Motor Products, Inc. | 0.06 | 3.58 | 1.82 | 10.02 | 0.1241 | 0.0286 | |||
| SKY / Champion Homes, Inc. | 0.03 | -8.59 | 1.81 | -41.66 | 0.1233 | -0.0557 | |||
| CVCO / Cavco Industries, Inc. | 0.00 | -20.54 | 1.80 | -34.30 | 0.1223 | -0.0354 | |||
| HP / Helmerich & Payne, Inc. | 0.12 | 4.19 | 1.79 | -40.07 | 0.1219 | -0.0503 | |||
| UCTT / Ultra Clean Holdings, Inc. | 0.09 | 23.85 | 1.78 | -2.53 | 0.1210 | 0.0159 | |||
| AZZ / AZZ Inc. | 0.02 | -16.19 | 1.77 | -20.96 | 0.1206 | -0.0085 | |||
| MATW / Matthews International Corporation | 0.08 | -0.79 | 1.77 | -14.62 | 0.1206 | 0.0010 | |||
| PRVA / Privia Health Group, Inc. | 0.08 | -33.11 | 1.77 | -39.05 | 0.1204 | -0.0468 | |||
| TWI / Titan International, Inc. | 0.24 | -25.41 | 1.76 | -36.62 | 0.1197 | -0.0402 | |||
| BXMT / Blackstone Mortgage Trust, Inc. | 0.09 | -32.23 | 1.75 | -38.41 | 0.1194 | -0.0447 | |||
| AEIS / Advanced Energy Industries, Inc. | 0.02 | -13.98 | 1.74 | -14.29 | 0.1185 | 0.0015 | |||
| CENTA / Central Garden & Pet Company | 0.05 | -15.73 | 1.74 | -14.40 | 0.1183 | 0.0013 | |||
| AWI / Armstrong World Industries, Inc. | 0.01 | -10.53 | 1.73 | -9.42 | 0.1180 | 0.0077 | |||
| CENT / Central Garden & Pet Company | 0.05 | -13.49 | 1.73 | -11.61 | 0.1178 | 0.0050 | |||
| IOSP / Innospec Inc. | 0.02 | -10.46 | 1.72 | -26.37 | 0.1172 | -0.0175 | |||
| JBTM / JBT Marel Corporation | 0.01 | -21.52 | 1.72 | -31.76 | 0.1172 | -0.0282 | |||
| PJT / PJT Partners Inc. | 0.01 | -0.93 | 1.72 | -6.28 | 0.1170 | 0.0113 | |||
| VSTS / Vestis Corporation | 0.27 | 13.78 | 1.68 | -40.87 | 0.1144 | -0.0494 | |||
| IPAR / Interparfums, Inc. | 0.01 | -15.35 | 1.67 | -17.00 | 0.1138 | -0.0023 | |||
| MTRN / Materion Corporation | 0.02 | 0.89 | 1.67 | -14.51 | 0.1137 | 0.0011 | |||
| CRK / Comstock Resources, Inc. | 0.07 | -33.68 | 1.67 | -14.09 | 0.1135 | 0.0017 | |||
| YELP / Yelp Inc. | 0.04 | -9.56 | 1.66 | 0.60 | 0.1134 | 0.0180 | |||
| KWR / Quaker Chemical Corporation | 0.02 | -10.31 | 1.66 | -30.03 | 0.1129 | -0.0237 | |||
| LGIH / LGI Homes, Inc. | 0.03 | 8.76 | 1.65 | -25.80 | 0.1127 | -0.0159 | |||
| WAFD / WaFd, Inc | 0.06 | 3.28 | 1.65 | -0.78 | 0.1122 | 0.0164 | |||
| ECPG / Encore Capital Group, Inc. | 0.04 | 9.26 | 1.63 | 9.78 | 0.1109 | 0.0254 | |||
| JW.A / John Wiley & Sons Inc. - Class A | 0.04 | -22.14 | 1.62 | -23.60 | 0.1105 | -0.0120 | |||
| ASIX / AdvanSix Inc. | 0.07 | -2.56 | 1.62 | -17.94 | 0.1103 | -0.0035 | |||
| UCB / United Community Banks, Inc. | 0.06 | -5.19 | 1.61 | -15.46 | 0.1099 | -0.0002 | |||
| PINC / Premier, Inc. | 0.07 | -15.12 | 1.61 | 7.27 | 0.1097 | 0.0231 | |||
| PIPR / Piper Sandler Companies | 0.01 | -4.06 | 1.61 | -16.72 | 0.1096 | -0.0018 | |||
| WSFS / WSFS Financial Corporation | 0.03 | -12.14 | 1.59 | -14.41 | 0.1085 | 0.0012 | |||
| HTH / Hilltop Holdings Inc. | 0.05 | -20.45 | 1.59 | -25.85 | 0.1081 | -0.0153 | |||
| ASTE / Astec Industries, Inc. | 0.04 | -16.01 | 1.56 | -7.26 | 0.1063 | 0.0092 | |||
| HCC / Warrior Met Coal, Inc. | 0.03 | -2.91 | 1.55 | -8.32 | 0.1058 | 0.0081 | |||
| BKE / The Buckle, Inc. | 0.04 | 12.12 | 1.55 | 19.29 | 0.1058 | 0.0307 | |||
| OXM / Oxford Industries, Inc. | 0.03 | 12.56 | 1.55 | -2.58 | 0.1056 | 0.0138 | |||
| SCHL / Scholastic Corporation | 0.09 | 3.86 | 1.54 | -18.07 | 0.1051 | -0.0035 | |||
| ACIW / ACI Worldwide, Inc. | 0.03 | -18.30 | 1.54 | -34.12 | 0.1050 | -0.0299 | |||
| NHC / National HealthCare Corporation | 0.01 | 6.61 | 1.54 | 19.18 | 0.1050 | 0.0304 | |||
| ALKS / Alkermes plc | 0.05 | -26.77 | 1.54 | -34.71 | 0.1046 | -0.0310 | |||
| BRC / Brady Corporation | 0.02 | -14.80 | 1.53 | -17.94 | 0.1044 | -0.0034 | |||
| CUBI / Customers Bancorp, Inc. | 0.03 | -19.00 | 1.53 | -23.56 | 0.1044 | -0.0112 | |||
| RDN / Radian Group Inc. | 0.04 | -17.31 | 1.53 | -14.25 | 0.1042 | 0.0014 | |||
| FOXF / Fox Factory Holding Corp. | 0.06 | 0.87 | 1.52 | -6.73 | 0.1039 | 0.0096 | |||
| KTOS / Kratos Defense & Security Solutions, Inc. | 0.04 | 1.52 | 0.1035 | 0.1035 | |||||
| TILE / Interface, Inc. | 0.08 | 8.18 | 1.51 | 7.39 | 0.1030 | 0.0218 | |||
| CATY / Cathay General Bancorp | 0.04 | -7.93 | 1.51 | -15.96 | 0.1030 | -0.0008 | |||
| FBP / First BanCorp. | 0.08 | -11.48 | 1.50 | -9.19 | 0.1024 | 0.0069 | |||
| STRA / Strategic Education, Inc. | 0.02 | -4.84 | 1.49 | 7.84 | 0.1012 | 0.0217 | |||
| ADUS / Addus HomeCare Corporation | 0.01 | 0.75 | 1.47 | 16.67 | 0.1002 | 0.0275 | |||
| SFNC / Simmons First National Corporation | 0.08 | -6.15 | 1.47 | -19.86 | 0.1001 | -0.0057 | |||
| VTLE / Vital Energy, Inc. | 0.10 | 16.79 | 1.45 | -34.95 | 0.0987 | -0.0298 | |||
| JJSF / J&J Snack Foods Corp. | 0.01 | -3.80 | 1.45 | -15.73 | 0.0986 | -0.0005 | |||
| SMPL / The Simply Good Foods Company | 0.04 | -13.73 | 1.44 | -21.13 | 0.0982 | -0.0072 | |||
| TDW / Tidewater Inc. | 0.04 | -3.29 | 1.43 | -15.84 | 0.0974 | -0.0006 | |||
| BOX / Box, Inc. | 0.04 | -19.32 | 1.43 | -6.67 | 0.0973 | 0.0090 | |||
| FIZZ / National Beverage Corp. | 0.03 | -14.58 | 1.41 | -2.96 | 0.0962 | 0.0122 | |||
| MMSI / Merit Medical Systems, Inc. | 0.01 | -14.77 | 1.41 | -20.58 | 0.0962 | -0.0064 | |||
| PENG / Penguin Solutions, Inc. | 0.08 | -5.55 | 1.41 | -15.82 | 0.0961 | -0.0006 | |||
| VTOL / Bristow Group Inc. | 0.05 | -14.49 | 1.41 | -32.47 | 0.0958 | -0.0243 | |||
| CSGS / CSG Systems International, Inc. | 0.02 | -30.39 | 1.40 | -28.53 | 0.0953 | -0.0175 | |||
| NGVT / Ingevity Corporation | 0.03 | -23.82 | 1.39 | -33.90 | 0.0950 | -0.0267 | |||
| NX / Quanex Building Products Corporation | 0.08 | 64.77 | 1.39 | 42.95 | 0.0946 | 0.0386 | |||
| THRM / Gentherm Incorporated | 0.05 | 6.63 | 1.38 | -11.85 | 0.0944 | 0.0038 | |||
| STEP / StepStone Group Inc. | 0.02 | 32.68 | 1.38 | 27.55 | 0.0937 | 0.0315 | |||
| SONO / Sonos, Inc. | 0.13 | -8.82 | 1.38 | -29.12 | 0.0937 | -0.0182 | |||
| OTTR / Otter Tail Corporation | 0.02 | -29.46 | 1.37 | -31.72 | 0.0934 | -0.0224 | |||
| UFCS / United Fire Group, Inc. | 0.05 | -13.09 | 1.36 | -11.95 | 0.0929 | 0.0036 | |||
| TGI / Triumph Group, Inc. | 0.05 | -41.31 | 1.36 | -40.39 | 0.0929 | -0.0390 | |||
| AUB / Atlantic Union Bankshares Corporation | 0.05 | 4.55 | 1.35 | -12.02 | 0.0923 | 0.0035 | |||
| MWA / Mueller Water Products, Inc. | 0.05 | 1.35 | 0.0918 | 0.0918 | |||||
| PGNY / Progyny, Inc. | 0.06 | -39.89 | 1.34 | -42.64 | 0.0916 | -0.0436 | |||
| CNMD / CONMED Corporation | 0.02 | -4.26 | 1.34 | -8.24 | 0.0912 | 0.0071 | |||
| APAM / Artisan Partners Asset Management Inc. | 0.03 | -5.55 | 1.33 | -9.80 | 0.0909 | 0.0055 | |||
| DIOD / Diodes Incorporated | 0.03 | 6.53 | 1.33 | -4.18 | 0.0906 | 0.0105 | |||
| ACAD / ACADIA Pharmaceuticals Inc. | 0.06 | 1.33 | 0.0904 | 0.0904 | |||||
| MGY / Magnolia Oil & Gas Corporation | 0.06 | -12.86 | 1.32 | -19.96 | 0.0899 | -0.0052 | |||
| PAHC / Phibro Animal Health Corporation | 0.05 | -17.70 | 1.32 | -11.66 | 0.0899 | 0.0038 | |||
| ESE / ESCO Technologies Inc. | 0.01 | -27.93 | 1.31 | -20.81 | 0.0895 | -0.0062 | |||
| APLE / Apple Hospitality REIT, Inc. | 0.11 | -10.70 | 1.31 | -30.12 | 0.0890 | -0.0188 | |||
| FFBC / First Financial Bancorp. | 0.05 | -5.88 | 1.30 | -17.05 | 0.0885 | -0.0018 | |||
| SAFT / Safety Insurance Group, Inc. | 0.02 | -12.29 | 1.30 | -5.40 | 0.0884 | 0.0093 | |||
| NVEE / NV5 Global, Inc. | 0.06 | -6.43 | 1.30 | 14.60 | 0.0882 | 0.0230 | |||
| HWKN / Hawkins, Inc. | 0.01 | -4.14 | 1.29 | 21.89 | 0.0881 | 0.0269 | |||
| ROCK / Gibraltar Industries, Inc. | 0.02 | -17.87 | 1.29 | -26.81 | 0.0880 | -0.0138 | |||
| PEB / Pebblebrook Hotel Trust | 0.14 | 1.84 | 1.29 | -24.32 | 0.0878 | -0.0104 | |||
| EZPW / EZCORP, Inc. | 0.10 | -28.49 | 1.28 | -30.09 | 0.0871 | -0.0184 | |||
| RES / RPC, Inc. | 0.29 | -12.83 | 1.27 | -30.61 | 0.0868 | -0.0192 | |||
| AROC / Archrock, Inc. | 0.05 | -11.36 | 1.27 | -18.58 | 0.0866 | -0.0035 | |||
| CALX / Calix, Inc. | 0.03 | -27.23 | 1.27 | -9.16 | 0.0866 | 0.0059 | |||
| FTRE / Fortrea Holdings Inc. | 0.29 | 45.64 | 1.26 | -54.80 | 0.0856 | -0.0747 | |||
| PMT / PennyMac Mortgage Investment Trust | 0.10 | -46.67 | 1.25 | -55.30 | 0.0850 | -0.0760 | |||
| PBH / Prestige Consumer Healthcare Inc. | 0.01 | -24.54 | 1.25 | -23.71 | 0.0849 | -0.0093 | |||
| TNC / Tennant Company | 0.02 | -20.60 | 1.24 | -31.76 | 0.0845 | -0.0203 | |||
| NWN / Northwest Natural Holding Company | 0.03 | -24.59 | 1.24 | -24.45 | 0.0843 | -0.0101 | |||
| PFS / Provident Financial Services, Inc. | 0.07 | 9.21 | 1.23 | -0.08 | 0.0839 | 0.0128 | |||
| MNRO / Monro, Inc. | 0.08 | 28.51 | 1.23 | 10.61 | 0.0838 | 0.0197 | |||
| FHB / First Hawaiian, Inc. | 0.05 | -16.50 | 1.23 | -25.92 | 0.0838 | -0.0120 | |||
| MC / Moelis & Company | 0.02 | 15.54 | 1.22 | -6.65 | 0.0832 | 0.0078 | |||
| NPO / Enpro Inc. | 0.01 | -14.45 | 1.22 | -13.02 | 0.0829 | 0.0022 | |||
| RNST / Renasant Corporation | 0.03 | -19.40 | 1.22 | -22.00 | 0.0829 | -0.0070 | |||
| ZD / Ziff Davis, Inc. | 0.04 | 14.50 | 1.22 | -9.52 | 0.0829 | 0.0053 | |||
| PUMP / ProPetro Holding Corp. | 0.22 | 4.65 | 1.21 | -33.04 | 0.0824 | -0.0218 | |||
| ABR / Arbor Realty Trust, Inc. | 0.13 | -15.07 | 1.21 | -34.04 | 0.0822 | -0.0234 | |||
| APOG / Apogee Enterprises, Inc. | 0.03 | 29.10 | 1.21 | 4.06 | 0.0822 | 0.0153 | |||
| AIN / Albany International Corp. | 0.02 | -16.48 | 1.20 | -27.92 | 0.0820 | -0.0143 | |||
| HSII / Heidrick & Struggles International, Inc. | 0.03 | -18.11 | 1.20 | -12.73 | 0.0818 | 0.0024 | |||
| EXTR / Extreme Networks, Inc. | 0.08 | -6.65 | 1.20 | -5.30 | 0.0815 | 0.0086 | |||
| BGS / B&G Foods, Inc. | 0.28 | -21.54 | 1.19 | -50.56 | 0.0810 | -0.0577 | |||
| SCVL / Shoe Carnival, Inc. | 0.06 | 26.82 | 1.17 | 10.14 | 0.0799 | 0.0185 | |||
| DRH / DiamondRock Hospitality Company | 0.15 | -8.12 | 1.17 | -14.68 | 0.0796 | 0.0006 | |||
| AVAV / AeroVironment, Inc. | 0.01 | -6.32 | 1.16 | 11.53 | 0.0791 | 0.0190 | |||
| POWL / Powell Industries, Inc. | 0.01 | 29.46 | 1.15 | 29.33 | 0.0785 | 0.0271 | |||
| CRSR / Corsair Gaming, Inc. | 0.13 | -46.33 | 1.15 | -59.82 | 0.0780 | -0.0864 | |||
| INSW / International Seaways, Inc. | 0.03 | 1.14 | 0.0777 | 0.0777 | |||||
| MSGS / Madison Square Garden Sports Corp. | 0.01 | -8.02 | 1.14 | -14.30 | 0.0776 | 0.0010 | |||
| BMI / Badger Meter, Inc. | 0.00 | -2.92 | 1.14 | 14.59 | 0.0776 | 0.0203 | |||
| HLX / Helix Energy Solutions Group, Inc. | 0.18 | -3.48 | 1.14 | -30.69 | 0.0775 | -0.0172 | |||
| VRRM / Verra Mobility Corporation | 0.05 | -6.70 | 1.13 | -3.66 | 0.0773 | 0.0094 | |||
| CWT / California Water Service Group | 0.02 | -19.21 | 1.13 | -16.01 | 0.0772 | -0.0006 | |||
| SEDG / SolarEdge Technologies, Inc. | 0.06 | -41.49 | 1.13 | -36.62 | 0.0766 | -0.0258 | |||
| HAYW / Hayward Holdings, Inc. | 0.08 | -7.14 | 1.12 | -10.59 | 0.0765 | 0.0040 | |||
| MRCY / Mercury Systems, Inc. | 0.02 | -26.33 | 1.12 | -18.26 | 0.0762 | -0.0028 | |||
| MTUS / Metallus Inc. | 0.09 | -12.05 | 1.10 | -23.08 | 0.0752 | -0.0076 | |||
| BOH / Bank of Hawaii Corporation | 0.02 | -13.29 | 1.10 | -20.14 | 0.0751 | -0.0045 | |||
| WHD / Cactus, Inc. | 0.03 | 4.35 | 1.10 | -18.57 | 0.0750 | -0.0030 | |||
| BANF / BancFirst Corporation | 0.01 | -6.63 | 1.10 | -3.17 | 0.0748 | 0.0094 | |||
| OMCL / Omnicell, Inc. | 0.04 | 12.19 | 1.09 | -10.43 | 0.0743 | 0.0040 | |||
| HELE / Helen of Troy Limited | 0.04 | 4.06 | 1.08 | -49.18 | 0.0736 | -0.0490 | |||
| HTLD / Heartland Express, Inc. | 0.12 | -5.02 | 1.07 | -17.64 | 0.0732 | -0.0020 | |||
| PRSU / Pursuit Attractions and Hospitality, Inc. | 0.04 | -12.23 | 1.07 | -38.35 | 0.0732 | -0.0273 | |||
| TNDM / Tandem Diabetes Care, Inc. | 0.05 | 54.88 | 1.07 | 38.65 | 0.0728 | 0.0284 | |||
| XHR / Xenia Hotels & Resorts, Inc. | 0.09 | -2.38 | 1.07 | -11.15 | 0.0728 | 0.0034 | |||
| SNCY / Sun Country Airlines Holdings, Inc. | 0.09 | -2.71 | 1.07 | -30.05 | 0.0726 | -0.0153 | |||
| HOPE / Hope Bancorp, Inc. | 0.11 | -5.48 | 1.06 | -13.16 | 0.0724 | 0.0019 | |||
| TRMK / Trustmark Corporation | 0.03 | -11.52 | 1.06 | -16.61 | 0.0722 | -0.0012 | |||
| DFIN / Donnelley Financial Solutions, Inc. | 0.02 | 4.83 | 1.06 | 15.30 | 0.0719 | 0.0191 | |||
| JBSS / John B. Sanfilippo & Son, Inc. | 0.02 | -2.13 | 1.05 | -13.93 | 0.0715 | 0.0012 | |||
| UNIT / Unity Group LLC | 0.24 | -9.18 | 1.05 | -32.02 | 0.0715 | -0.0175 | |||
| INDB / Independent Bank Corp. | 0.02 | -10.72 | 1.05 | -19.94 | 0.0715 | -0.0041 | |||
| ACLS / Axcelis Technologies, Inc. | 0.02 | -7.28 | 1.04 | -4.67 | 0.0710 | 0.0079 | |||
| PRDO / Perdoceo Education Corporation | 0.03 | -9.34 | 1.03 | 20.54 | 0.0700 | 0.0208 | |||
| KAI / Kadant Inc. | 0.00 | 1.02 | 0.0698 | 0.0698 | |||||
| CORT / Corcept Therapeutics Incorporated | 0.01 | -11.08 | 1.02 | 13.77 | 0.0693 | 0.0177 | |||
| BCPC / Balchem Corporation | 0.01 | -19.02 | 1.01 | -22.45 | 0.0685 | -0.0063 | |||
| SMTC / Semtech Corporation | 0.03 | 43.95 | 1.01 | 40.76 | 0.0685 | 0.0273 | |||
| CBU / Community Financial System, Inc. | 0.02 | -8.87 | 1.00 | -19.04 | 0.0678 | -0.0031 | |||
| PAYO / Payoneer Global Inc. | 0.15 | 13.88 | 0.99 | -9.34 | 0.0675 | 0.0045 | |||
| CRVL / CorVel Corporation | 0.01 | -11.26 | 0.99 | -10.52 | 0.0673 | 0.0037 | |||
| IART / Integra LifeSciences Holdings Corporation | 0.08 | -14.62 | 0.99 | -53.43 | 0.0671 | -0.0549 | |||
| ALRM / Alarm.com Holdings, Inc. | 0.02 | -10.19 | 0.98 | -11.28 | 0.0670 | 0.0031 | |||
| FRPT / Freshpet, Inc. | 0.01 | 0.98 | 0.0668 | 0.0668 | |||||
| MCW / Mister Car Wash, Inc. | 0.14 | -21.94 | 0.97 | -34.92 | 0.0663 | -0.0199 | |||
| IDCC / InterDigital, Inc. | 0.00 | -13.75 | 0.97 | -12.26 | 0.0663 | 0.0023 | |||
| SLG / SL Green Realty Corp. | 0.02 | -1.19 | 0.97 | -13.06 | 0.0662 | 0.0017 | |||
| MRTN / Marten Transport, Ltd. | 0.07 | -13.49 | 0.97 | -23.42 | 0.0662 | -0.0069 | |||
| OFG / OFG Bancorp | 0.02 | -14.05 | 0.97 | -16.84 | 0.0660 | -0.0012 | |||
| RAMP / LiveRamp Holdings, Inc. | 0.03 | -3.90 | 0.96 | 4.79 | 0.0657 | 0.0126 | |||
| CARG / CarGurus, Inc. | 0.03 | -6.34 | 0.96 | -8.89 | 0.0657 | 0.0047 | |||
| NTCT / NetScout Systems, Inc. | 0.04 | -18.70 | 0.96 | -17.41 | 0.0656 | -0.0017 | |||
| CSW / CSW Industrials, Inc. | 0.00 | 5.35 | 0.96 | 5.27 | 0.0653 | 0.0128 | |||
| HCI / HCI Group, Inc. | 0.01 | -43.51 | 0.96 | -27.58 | 0.0651 | -0.0110 | |||
| SFBS / ServisFirst Bancshares, Inc. | 0.01 | -10.49 | 0.95 | -27.14 | 0.0650 | -0.0105 | |||
| MAC / The Macerich Company | 0.06 | 0.80 | 0.95 | -9.58 | 0.0650 | 0.0041 | |||
| PPBI / Pacific Premier Bancorp, Inc. | 0.04 | 32.66 | 0.95 | 17.68 | 0.0649 | 0.0182 | |||
| EIG / Employers Holdings, Inc. | 0.02 | -16.47 | 0.95 | -21.55 | 0.0648 | -0.0051 | |||
| WD / Walker & Dunlop, Inc. | 0.01 | -1.49 | 0.95 | -21.24 | 0.0647 | -0.0049 | |||
| JACK / Jack in the Box Inc. | 0.05 | 7.30 | 0.95 | -47.07 | 0.0646 | -0.0387 | |||
| CABO / Cable One, Inc. | 0.01 | 8.07 | 0.94 | -39.21 | 0.0641 | -0.0252 | |||
| RWT / Redwood Trust, Inc. | 0.17 | -3.44 | 0.94 | -21.27 | 0.0641 | -0.0048 | |||
| SSTK / Shutterstock, Inc. | 0.05 | 30.35 | 0.94 | 11.90 | 0.0641 | 0.0156 | |||
| DEI / Douglas Emmett, Inc. | 0.07 | -7.89 | 0.94 | -24.23 | 0.0639 | -0.0075 | |||
| VRTS / Virtus Investment Partners, Inc. | 0.01 | 7.83 | 0.93 | -2.00 | 0.0634 | 0.0086 | |||
| EVTC / EVERTEC, Inc. | 0.03 | -20.39 | 0.93 | -22.80 | 0.0633 | -0.0061 | |||
| EMBC / Embecta Corp. | 0.09 | 11.15 | 0.93 | -13.27 | 0.0632 | 0.0015 | |||
| HIW / Highwoods Properties, Inc. | 0.03 | -18.16 | 0.93 | -16.58 | 0.0631 | -0.0009 | |||
| VIAV / Viavi Solutions Inc. | 0.10 | -23.93 | 0.92 | -38.01 | 0.0626 | -0.0229 | |||
| PRGS / Progress Software Corporation | 0.01 | 2.43 | 0.92 | 15.47 | 0.0626 | 0.0167 | |||
| PRAA / PRA Group, Inc. | 0.06 | -7.97 | 0.91 | -37.62 | 0.0622 | -0.0222 | |||
| CASH / Pathward Financial, Inc. | 0.01 | -11.83 | 0.91 | -11.23 | 0.0620 | 0.0029 | |||
| TMDX / TransMedics Group, Inc. | 0.01 | -15.38 | 0.90 | 40.91 | 0.0613 | 0.0245 | |||
| AGO / Assured Guaranty Ltd. | 0.01 | -20.44 | 0.89 | -23.02 | 0.0604 | -0.0060 | |||
| TR / Tootsie Roll Industries, Inc. | 0.02 | -22.85 | 0.88 | -11.18 | 0.0601 | 0.0028 | |||
| PCRX / Pacira BioSciences, Inc. | 0.03 | -29.08 | 0.88 | -23.88 | 0.0600 | -0.0067 | |||
| QNST / QuinStreet, Inc. | 0.06 | 16.76 | 0.88 | -8.90 | 0.0600 | 0.0042 | |||
| BANR / Banner Corporation | 0.01 | -8.52 | 0.88 | -18.22 | 0.0600 | -0.0021 | |||
| SHO / Sunstone Hotel Investors, Inc. | 0.10 | -6.33 | 0.88 | -19.87 | 0.0599 | -0.0034 | |||
| SBCF / Seacoast Banking Corporation of Florida | 0.03 | -9.27 | 0.88 | -17.11 | 0.0598 | -0.0013 | |||
| RC / Ready Capital Corporation | 0.19 | -7.70 | 0.86 | -40.45 | 0.0589 | -0.0249 | |||
| GNL / Global Net Lease, Inc. | 0.11 | -31.19 | 0.86 | -33.28 | 0.0585 | -0.0157 | |||
| VBTX / Veritex Holdings, Inc. | 0.04 | -6.09 | 0.86 | -13.72 | 0.0583 | 0.0011 | |||
| CWENA / Clearway Energy Inc - Class A | 0.03 | -25.47 | 0.84 | -18.77 | 0.0576 | -0.0024 | |||
| USNA / USANA Health Sciences, Inc. | 0.03 | -12.00 | 0.84 | -11.16 | 0.0575 | 0.0027 | |||
| NWBI / Northwest Bancshares, Inc. | 0.07 | -0.20 | 0.84 | -2.88 | 0.0575 | 0.0074 | |||
| CWEN / Clearway Energy, Inc. | 0.03 | -25.67 | 0.84 | -18.37 | 0.0573 | -0.0021 | |||
| REX / REX American Resources Corporation | 0.02 | -13.03 | 0.84 | -5.10 | 0.0571 | 0.0062 | |||
| NBTB / NBT Bancorp Inc. | 0.02 | -8.89 | 0.83 | -20.21 | 0.0563 | -0.0034 | |||
| YOU / Clear Secure, Inc. | 0.03 | -12.08 | 0.82 | -8.26 | 0.0561 | 0.0043 | |||
| MPW / Medical Properties Trust, Inc. | 0.18 | -18.31 | 0.82 | -36.76 | 0.0558 | -0.0189 | |||
| BL / BlackLine, Inc. | 0.01 | 4.77 | 0.82 | 21.40 | 0.0557 | 0.0168 | |||
| CPK / Chesapeake Utilities Corporation | 0.01 | -19.65 | 0.82 | -22.63 | 0.0557 | -0.0053 | |||
| ROG / Rogers Corporation | 0.01 | 1.91 | 0.81 | -15.14 | 0.0550 | 0.0001 | |||
| HTO / H2O America | 0.02 | -19.69 | 0.81 | -19.98 | 0.0549 | -0.0032 | |||
| NMIH / NMI Holdings, Inc. | 0.02 | -13.21 | 0.80 | -5.44 | 0.0546 | 0.0057 | |||
| PLMR / Palomar Holdings, Inc. | 0.00 | -35.68 | 0.80 | -14.27 | 0.0544 | 0.0007 | |||
| FORM / FormFactor, Inc. | 0.03 | 9.74 | 0.80 | -1.61 | 0.0542 | 0.0075 | |||
| HRMY / Harmony Biosciences Holdings, Inc. | 0.02 | -22.56 | 0.79 | -21.15 | 0.0541 | -0.0039 | |||
| WRLD / World Acceptance Corporation | 0.01 | -28.46 | 0.79 | -18.05 | 0.0539 | -0.0018 | |||
| AESI / Atlas Energy Solutions Inc. | 0.06 | 13.37 | 0.79 | -28.91 | 0.0536 | -0.0103 | |||
| FBK / FB Financial Corporation | 0.02 | -3.56 | 0.78 | -16.67 | 0.0531 | -0.0009 | |||
| AMPH / Amphastar Pharmaceuticals, Inc. | 0.03 | 28.86 | 0.77 | 16.57 | 0.0527 | 0.0144 | |||
| GDEN / Golden Entertainment, Inc. | 0.03 | -16.93 | 0.77 | -23.74 | 0.0525 | -0.0058 | |||
| CXM / Sprinklr, Inc. | 0.09 | -27.28 | 0.77 | -27.53 | 0.0522 | -0.0088 | |||
| IIIN / Insteel Industries, Inc. | 0.02 | -13.56 | 0.76 | 7.61 | 0.0521 | 0.0111 | |||
| MARA / MARA Holdings, Inc. | 0.05 | 49.03 | 0.76 | 51.29 | 0.0519 | 0.0228 | |||
| FCF / First Commonwealth Financial Corporation | 0.05 | -6.23 | 0.76 | -10.92 | 0.0517 | 0.0026 | |||
| TBBK / The Bancorp, Inc. | 0.01 | -11.52 | 0.76 | -19.00 | 0.0517 | -0.0023 | |||
| PRK / Park National Corporation | 0.00 | 4.00 | 0.76 | 1.61 | 0.0516 | 0.0086 | |||
| ARI / Apollo Commercial Real Estate Finance, Inc. | 0.08 | -33.73 | 0.75 | -35.73 | 0.0511 | -0.0162 | |||
| SPSC / SPS Commerce, Inc. | 0.01 | 22.13 | 0.75 | 29.14 | 0.0511 | 0.0176 | |||
| KN / Knowles Corporation | 0.05 | -16.46 | 0.75 | -17.41 | 0.0508 | -0.0013 | |||
| THRY / Thryv Holdings, Inc. | 0.06 | -25.27 | 0.74 | -42.41 | 0.0508 | -0.0238 | |||
| CVBF / CVB Financial Corp. | 0.04 | -6.08 | 0.74 | -12.69 | 0.0506 | 0.0015 | |||
| PLAB / Photronics, Inc. | 0.04 | 2.17 | 0.74 | -18.01 | 0.0506 | -0.0017 | |||
| LNN / Lindsay Corporation | 0.01 | -20.49 | 0.74 | -16.21 | 0.0504 | -0.0005 | |||
| ARLO / Arlo Technologies, Inc. | 0.05 | -6.55 | 0.74 | -6.93 | 0.0504 | 0.0045 | |||
| INSP / Inspire Medical Systems, Inc. | 0.01 | -2.79 | 0.74 | -27.66 | 0.0501 | -0.0085 | |||
| CCOI / Cogent Communications Holdings, Inc. | 0.02 | -21.83 | 0.73 | -51.10 | 0.0498 | -0.0364 | |||
| MGEE / MGE Energy, Inc. | 0.01 | -12.55 | 0.73 | -13.90 | 0.0498 | 0.0008 | |||
| MGPI / MGP Ingredients, Inc. | 0.02 | 7.92 | 0.73 | -3.06 | 0.0497 | 0.0063 | |||
| PECO / Phillips Edison & Company, Inc. | 0.02 | -12.55 | 0.73 | -16.67 | 0.0494 | -0.0008 | |||
| SUPN / Supernus Pharmaceuticals, Inc. | 0.02 | -12.41 | 0.72 | -13.41 | 0.0493 | 0.0011 | |||
| TWO / Two Harbors Investment Corp. | 0.07 | -14.15 | 0.72 | -35.89 | 0.0491 | -0.0157 | |||
| VECO / Veeco Instruments Inc. | 0.04 | 3.28 | 0.70 | -10.30 | 0.0475 | 0.0026 | |||
| AAMI / Acadian Asset Management Inc. | 0.02 | -4.27 | 0.70 | 16.97 | 0.0475 | 0.0131 | |||
| JBGS / JBG SMITH Properties | 0.04 | -17.03 | 0.69 | -7.48 | 0.0472 | 0.0040 | |||
| USPH / U.S. Physical Therapy, Inc. | 0.01 | -2.13 | 0.69 | -9.34 | 0.0470 | 0.0031 | |||
| CARS / Cars.com Inc. | 0.07 | 28.74 | 0.68 | 0.00 | 0.0465 | 0.0071 | |||
| KLIC / Kulicke and Soffa Industries, Inc. | 0.02 | 4.82 | 0.67 | -12.01 | 0.0460 | 0.0018 | |||
| COLL / Collegium Pharmaceutical, Inc. | 0.02 | -16.70 | 0.67 | -16.42 | 0.0458 | -0.0006 | |||
| BRKL / Brookline Bancorp, Inc. | 0.06 | -9.52 | 0.67 | -20.73 | 0.0456 | -0.0031 | |||
| STEL / Stellar Bancorp, Inc. | 0.02 | -18.10 | 0.66 | -24.20 | 0.0452 | -0.0053 | |||
| GOGO / Gogo Inc. | 0.06 | -12.09 | 0.66 | 27.26 | 0.0452 | 0.0151 | |||
| TOU / Tourmaline Oil Corp. | 0.05 | 6.69 | 0.66 | 5.41 | 0.0452 | 0.0089 | |||
| AWR / American States Water Company | 0.01 | -15.14 | 0.66 | -12.58 | 0.0450 | 0.0014 | |||
| BHLB / Berkshire Hills Bancorp, Inc. | 0.03 | -7.91 | 0.66 | -20.02 | 0.0450 | -0.0026 | |||
| DOCN / DigitalOcean Holdings, Inc. | 0.02 | -16.59 | 0.65 | -44.90 | 0.0446 | -0.0239 | |||
| SXI / Standex International Corporation | 0.00 | -8.65 | 0.65 | -25.82 | 0.0444 | -0.0063 | |||
| HLIT / Harmonic Inc. | 0.07 | 8.87 | 0.65 | -4.69 | 0.0443 | 0.0049 | |||
| EGBN / Eagle Bancorp, Inc. | 0.04 | 9.32 | 0.65 | -17.22 | 0.0442 | -0.0010 | |||
| ETD / Ethan Allen Interiors Inc. | 0.02 | -15.65 | 0.65 | -22.67 | 0.0442 | -0.0042 | |||
| DCOM / Dime Community Bancshares, Inc. | 0.03 | -7.90 | 0.65 | -23.73 | 0.0440 | -0.0049 | |||
| AVNS / Avanos Medical, Inc. | 0.05 | -1.02 | 0.64 | -17.36 | 0.0435 | -0.0011 | |||
| WDFC / WD-40 Company | 0.00 | -11.48 | 0.63 | -9.57 | 0.0431 | 0.0027 | |||
| CPRX / Catalyst Pharmaceuticals, Inc. | 0.02 | -23.43 | 0.62 | -16.49 | 0.0424 | -0.0006 | |||
| EPAC / Enerpac Tool Group Corp. | 0.01 | -21.49 | 0.62 | -27.28 | 0.0424 | -0.0069 | |||
| MMI / Marcus & Millichap, Inc. | 0.02 | -7.28 | 0.62 | -30.60 | 0.0421 | -0.0092 | |||
| FBNC / First Bancorp | 0.01 | -12.31 | 0.61 | -13.54 | 0.0418 | 0.0009 | |||
| ANIP / ANI Pharmaceuticals, Inc. | 0.01 | -20.30 | 0.61 | -24.35 | 0.0417 | -0.0050 | |||
| AHH / Armada Hoffler Properties, Inc. | 0.09 | -10.85 | 0.61 | -32.41 | 0.0415 | -0.0105 | |||
| NEOG / Neogen Corporation | 0.10 | 7,398.12 | 0.61 | 479.05 | 0.0414 | -0.0049 | |||
| NBHC / National Bank Holdings Corporation | 0.02 | -10.28 | 0.60 | -22.48 | 0.0409 | -0.0038 | |||
| INN / Summit Hotel Properties, Inc. | 0.14 | -7.67 | 0.60 | -37.57 | 0.0406 | -0.0144 | |||
| STBA / S&T Bancorp, Inc. | 0.02 | -21.03 | 0.59 | -28.01 | 0.0403 | -0.0071 | |||
| UFPT / UFP Technologies, Inc. | 0.00 | 11.62 | 0.59 | 14.93 | 0.0399 | 0.0105 | |||
| AOSL / Alpha and Omega Semiconductor Limited | 0.03 | 43.66 | 0.58 | 0.70 | 0.0394 | 0.0063 | |||
| PFBC / Preferred Bank | 0.01 | -16.53 | 0.58 | -21.34 | 0.0392 | -0.0030 | |||
| ICHR / Ichor Holdings, Ltd. | 0.04 | 2.91 | 0.57 | -44.58 | 0.0391 | -0.0206 | |||
| US8252528851 / Invesco Government & Agency Portfolio, Institutional Class | 0.57 | 32.12 | 0.57 | 32.09 | 0.0388 | 0.0139 | |||
| CNS / Cohen & Steers, Inc. | 0.01 | 5.44 | 0.55 | -7.23 | 0.0376 | 0.0033 | |||
| MCRI / Monarch Casino & Resort, Inc. | 0.01 | -23.60 | 0.55 | -30.13 | 0.0376 | -0.0080 | |||
| NYMT / New York Mortgage Trust, Inc. | 0.08 | -16.09 | 0.55 | -21.86 | 0.0373 | -0.0031 | |||
| NABL / N-able, Inc. | 0.07 | 12.59 | 0.55 | -12.66 | 0.0372 | 0.0012 | |||
| PRLB / Proto Labs, Inc. | 0.01 | -9.10 | 0.54 | -15.70 | 0.0366 | -0.0002 | |||
| CLSK / CleanSpark, Inc. | 0.06 | 0.54 | 0.0365 | 0.0365 | |||||
| XPEL / XPEL, Inc. | 0.01 | -0.89 | 0.53 | 6.80 | 0.0364 | 0.0075 | |||
| INVX / Innovex International, Inc. | 0.04 | -16.68 | 0.53 | -37.22 | 0.0364 | -0.0127 | |||
| UTL / Unitil Corporation | 0.01 | -20.14 | 0.53 | -22.06 | 0.0362 | -0.0031 | |||
| RGR / Sturm, Ruger & Company, Inc. | 0.01 | -26.38 | 0.53 | -32.40 | 0.0361 | -0.0092 | |||
| CTS / CTS Corporation | 0.01 | 1.81 | 0.53 | -7.23 | 0.0359 | 0.0031 | |||
| CRY / Artivion Inc | 0.02 | -7.11 | 0.53 | 8.23 | 0.0359 | 0.0078 | |||
| KREF / KKR Real Estate Finance Trust Inc. | 0.06 | -24.43 | 0.52 | -39.12 | 0.0357 | -0.0140 | |||
| EPRT / Essential Properties Realty Trust, Inc. | 0.02 | -13.32 | 0.52 | -13.88 | 0.0351 | 0.0006 | |||
| SKT / Tanger Inc. | 0.02 | -13.60 | 0.51 | -27.40 | 0.0351 | -0.0058 | |||
| TFIN / Triumph Financial, Inc. | 0.01 | 30.83 | 0.51 | 9.64 | 0.0349 | 0.0080 | |||
| BDN / Brandywine Realty Trust | 0.12 | -2.03 | 0.51 | -17.99 | 0.0345 | -0.0011 | |||
| WETF / Wisdomtree Investments Inc | 0.05 | 3.70 | 0.51 | 7.45 | 0.0344 | 0.0073 | |||
| NEO / NeoGenomics, Inc. | 0.07 | 40.86 | 0.50 | 2.65 | 0.0344 | 0.0060 | |||
| DGII / Digi International Inc. | 0.02 | -11.91 | 0.50 | -6.49 | 0.0343 | 0.0032 | |||
| PI / Impinj, Inc. | 0.00 | 42.16 | 0.50 | 67.68 | 0.0340 | 0.0168 | |||
| FBRT / Franklin BSP Realty Trust, Inc. | 0.05 | -24.45 | 0.50 | -38.54 | 0.0339 | -0.0128 | |||
| ADMA / ADMA Biologics, Inc. | 0.02 | -9.64 | 0.49 | 9.35 | 0.0335 | 0.0076 | |||
| AZTA / Azenta, Inc. | 0.02 | -8.75 | 0.49 | -44.06 | 0.0334 | -0.0172 | |||
| HAFC / Hanmi Financial Corporation | 0.02 | -6.03 | 0.49 | -10.28 | 0.0334 | 0.0019 | |||
| AAT / American Assets Trust, Inc. | 0.02 | -6.87 | 0.48 | -17.44 | 0.0330 | -0.0008 | |||
| SBSI / Southside Bancshares, Inc. | 0.02 | 3.25 | 0.48 | -5.37 | 0.0325 | 0.0034 | |||
| UE / Urban Edge Properties | 0.03 | -2.44 | 0.46 | -13.97 | 0.0315 | 0.0005 | |||
| LPG / Dorian LPG Ltd. | 0.02 | -25.48 | 0.46 | -21.56 | 0.0315 | -0.0025 | |||
| TMP / Tompkins Financial Corporation | 0.01 | -3.74 | 0.45 | -14.18 | 0.0310 | 0.0004 | |||
| LKFN / Lakeland Financial Corporation | 0.01 | -8.58 | 0.45 | -17.64 | 0.0309 | -0.0008 | |||
| INVA / Innoviva, Inc. | 0.02 | -15.63 | 0.45 | -7.96 | 0.0308 | 0.0025 | |||
| COHU / Cohu, Inc. | 0.03 | 2.01 | 0.45 | -11.33 | 0.0304 | 0.0013 | |||
| CFFN / Capitol Federal Financial, Inc. | 0.08 | -9.15 | 0.44 | -12.52 | 0.0300 | 0.0010 | |||
| JOE / The St. Joe Company | 0.01 | -15.97 | 0.43 | -21.72 | 0.0293 | -0.0024 | |||
| CERT / Certara, Inc. | 0.04 | -31.04 | 0.42 | -34.62 | 0.0289 | -0.0085 | |||
| CHCO / City Holding Company | 0.00 | -8.61 | 0.42 | -9.48 | 0.0286 | 0.0019 | |||
| EFC / Ellington Financial Inc. | 0.03 | -16.82 | 0.41 | -27.16 | 0.0276 | -0.0045 | |||
| AGYS / Agilysys, Inc. | 0.00 | 22.20 | 0.41 | 60.08 | 0.0276 | 0.0130 | |||
| CLB / Core Laboratories Inc. | 0.04 | -3.78 | 0.40 | -29.33 | 0.0273 | -0.0054 | |||
| SITC / SITE Centers Corp. | 0.03 | 0.10 | 0.40 | -14.96 | 0.0272 | 0.0002 | |||
| KW / Kennedy-Wilson Holdings, Inc. | 0.06 | -16.20 | 0.40 | -45.03 | 0.0272 | -0.0147 | |||
| PTGX / Protagonist Therapeutics, Inc. | 0.01 | -29.71 | 0.39 | -11.24 | 0.0264 | 0.0012 | |||
| GKOS / Glaukos Corporation | 0.00 | 14.66 | 0.38 | -9.79 | 0.0258 | 0.0015 | |||
| NPK / National Presto Industries, Inc. | 0.00 | -23.04 | 0.37 | -35.26 | 0.0252 | -0.0077 | |||
| ADEA / Adeia Inc. | 0.03 | -25.34 | 0.37 | -39.01 | 0.0252 | -0.0098 | |||
| SHEN / Shenandoah Telecommunications Company | 0.03 | -10.39 | 0.37 | 4.27 | 0.0250 | 0.0047 | |||
| CPF / Central Pacific Financial Corp. | 0.01 | -15.05 | 0.37 | -22.01 | 0.0249 | -0.0021 | |||
| MYGN / Myriad Genetics, Inc. | 0.09 | 8.60 | 0.36 | -57.59 | 0.0247 | -0.0247 | |||
| HASI / HA Sustainable Infrastructure Capital, Inc. | 0.01 | -14.86 | 0.36 | -25.82 | 0.0247 | -0.0035 | |||
| LXP / LXP Industrial Trust | 0.04 | -20.65 | 0.36 | -24.05 | 0.0246 | -0.0028 | |||
| LQDT / Liquidity Services, Inc. | 0.02 | -21.72 | 0.35 | -45.43 | 0.0240 | -0.0132 | |||
| MXL / MaxLinear, Inc. | 0.03 | 1.67 | 0.35 | -20.69 | 0.0235 | -0.0016 | |||
| AKR / Acadia Realty Trust | 0.02 | -11.15 | 0.34 | -25.76 | 0.0234 | -0.0033 | |||
| HFWA / Heritage Financial Corporation | 0.01 | -18.74 | 0.34 | -24.78 | 0.0234 | -0.0030 | |||
| TRNO / Terreno Realty Corporation | 0.01 | -25.43 | 0.34 | -37.93 | 0.0233 | -0.0085 | |||
| CTRE / CareTrust REIT, Inc. | 0.01 | -10.47 | 0.34 | -0.58 | 0.0232 | 0.0035 | |||
| STAA / STAAR Surgical Company | 0.02 | -1.46 | 0.33 | 0.30 | 0.0228 | 0.0035 | |||
| TGTX / TG Therapeutics, Inc. | 0.01 | -20.66 | 0.33 | -7.63 | 0.0223 | 0.0019 | |||
| WABC / Westamerica Bancorporation | 0.01 | -19.71 | 0.32 | -25.99 | 0.0218 | -0.0031 | |||
| SAFE / Safehold Inc. | 0.02 | -20.02 | 0.32 | -35.38 | 0.0215 | -0.0067 | |||
| VICR / Vicor Corporation | 0.01 | -22.12 | 0.31 | -46.42 | 0.0215 | -0.0124 | |||
| AMSF / AMERISAFE, Inc. | 0.01 | -18.95 | 0.31 | -25.24 | 0.0212 | -0.0028 | |||
| GSHD / Goosehead Insurance, Inc | 0.00 | -29.45 | 0.30 | -38.04 | 0.0207 | -0.0076 | |||
| TRST / TrustCo Bank Corp NY | 0.01 | -7.54 | 0.29 | -13.11 | 0.0195 | 0.0005 | |||
| FCPT / Four Corners Property Trust, Inc. | 0.01 | -35.16 | 0.29 | -37.77 | 0.0194 | -0.0070 | |||
| CSR / Centerspace | 0.00 | -31.99 | 0.28 | -34.56 | 0.0194 | -0.0057 | |||
| GDYN / Grid Dynamics Holdings, Inc. | 0.02 | 0.28 | 0.0192 | 0.0192 | |||||
| SITM / SiTime Corporation | 0.00 | 53.54 | 0.28 | 94.44 | 0.0191 | 0.0108 | |||
| CLI / Mack-Cali Realty Corp. | 0.02 | -9.11 | 0.27 | -18.45 | 0.0187 | -0.0007 | |||
| BFS / Saul Centers, Inc. | 0.01 | -28.67 | 0.27 | -36.02 | 0.0185 | -0.0059 | |||
| HSTM / HealthStream, Inc. | 0.01 | -23.58 | 0.27 | -36.62 | 0.0184 | -0.0062 | |||
| DEA / Easterly Government Properties, Inc. | 0.01 | 0.27 | 0.0183 | 0.0183 | |||||
| IIPR / Innovative Industrial Properties, Inc. | 0.00 | 14.23 | 0.26 | -12.29 | 0.0180 | 0.0006 | |||
| RCUS / Arcus Biosciences, Inc. | 0.03 | 60.21 | 0.25 | 31.61 | 0.0173 | 0.0062 | |||
| ALEX / Alexander & Baldwin, Inc. | 0.01 | -31.84 | 0.25 | -32.80 | 0.0172 | -0.0044 | |||
| ATEN / A10 Networks, Inc. | 0.01 | -26.45 | 0.25 | -39.01 | 0.0169 | -0.0065 | |||
| ELME / Elme Communities | 0.02 | -39.43 | 0.25 | -44.19 | 0.0167 | -0.0086 | |||
| NXRT / NexPoint Residential Trust, Inc. | 0.01 | -7.30 | 0.24 | -26.09 | 0.0163 | -0.0023 | |||
| LMAT / LeMaitre Vascular, Inc. | 0.00 | -6.15 | 0.23 | -16.30 | 0.0158 | -0.0001 | |||
| LTC / LTC Properties, Inc. | 0.01 | -8.72 | 0.22 | -7.44 | 0.0153 | 0.0013 | |||
| ARR / ARMOUR Residential REIT, Inc. | 0.01 | 3.31 | 0.22 | -12.20 | 0.0152 | 0.0006 | |||
| VCEL / Vericel Corporation | 0.01 | -11.98 | 0.22 | -29.07 | 0.0152 | -0.0030 | |||
| KRYS / Krystal Biotech, Inc. | 0.00 | -0.79 | 0.22 | -30.28 | 0.0151 | -0.0032 | |||
| DVAX / Dynavax Technologies Corporation | 0.02 | -24.29 | 0.21 | -46.31 | 0.0144 | -0.0083 | |||
| SDGR / Schrödinger, Inc. | 0.01 | -21.77 | 0.21 | -24.36 | 0.0142 | -0.0017 | |||
| GTY / Getty Realty Corp. | 0.01 | -8.63 | 0.21 | -14.75 | 0.0142 | 0.0001 | |||
| MSEX / Middlesex Water Company | 0.00 | -3.81 | 0.19 | 10.86 | 0.0133 | 0.0032 | |||
| MP / MP Materials Corp. | 0.01 | -44.83 | 0.19 | -50.00 | 0.0132 | -0.0091 | |||
| MLAB / Mesa Laboratories, Inc. | 0.00 | -20.04 | 0.19 | -42.34 | 0.0131 | -0.0061 | |||
| US9778521024 / COMMON STOCK | 0.16 | 16.73 | 0.19 | -76.05 | 0.0129 | -0.0326 | |||
| LGND / Ligand Pharmaceuticals Incorporated | 0.00 | 17.06 | 0.18 | -2.16 | 0.0124 | 0.0017 | |||
| PDFS / PDF Solutions, Inc. | 0.01 | 21.56 | 0.16 | -4.27 | 0.0107 | 0.0012 | |||
| TTGT / TechTarget, Inc. | 0.02 | -1.24 | 0.15 | -45.69 | 0.0099 | -0.0055 | |||
| WSR / Whitestone REIT | 0.01 | -19.01 | 0.14 | -26.53 | 0.0098 | -0.0015 | |||
| CTKB / Cytek Biosciences, Inc. | 0.05 | -0.08 | 0.14 | -38.53 | 0.0097 | -0.0036 | |||
| CURB / Curbline Properties Corp. | 0.01 | -14.33 | 0.13 | -21.25 | 0.0086 | -0.0006 | |||
| BLFS / BioLife Solutions, Inc. | 0.00 | -27.71 | 0.10 | -33.97 | 0.0070 | -0.0020 | |||
| UHT / Universal Health Realty Income Trust | 0.00 | -10.42 | 0.10 | -10.81 | 0.0068 | 0.0003 | |||
| SLP / Simulations Plus, Inc. | 0.00 | 4.84 | 0.09 | 15.19 | 0.0062 | 0.0016 | |||
| CEVA / CEVA, Inc. | 0.00 | -24.12 | 0.07 | -58.48 | 0.0048 | -0.0050 | |||
| XNCR / Xencor, Inc. | 0.01 | 87.94 | 0.07 | -1.39 | 0.0048 | 0.0007 | |||
| VIR / Vir Biotechnology, Inc. | 0.01 | -12.51 | 0.05 | -49.04 | 0.0037 | -0.0024 | |||
| ARWR / Arrowhead Pharmaceuticals, Inc. | 0.00 | 0.01 | 0.0010 | 0.0010 | |||||
| BBWI / Bath & Body Works, Inc. | 0.00 | -100.00 | 0.00 | -100.00 | -0.5787 | ||||
| US68218J2024 / OmniAb, Inc. | 0.00 | 0.00 | 0.00 | 0.0000 | 0.0000 | ||||
| PDCO / Patterson Companies, Inc. | 0.00 | -100.00 | 0.00 | -100.00 | -0.5366 | ||||
| US68218J3014 / OmniAb, Inc. | 0.00 | 0.00 | 0.00 | 0.0000 | 0.0000 |