Mga Batayang Estadistika
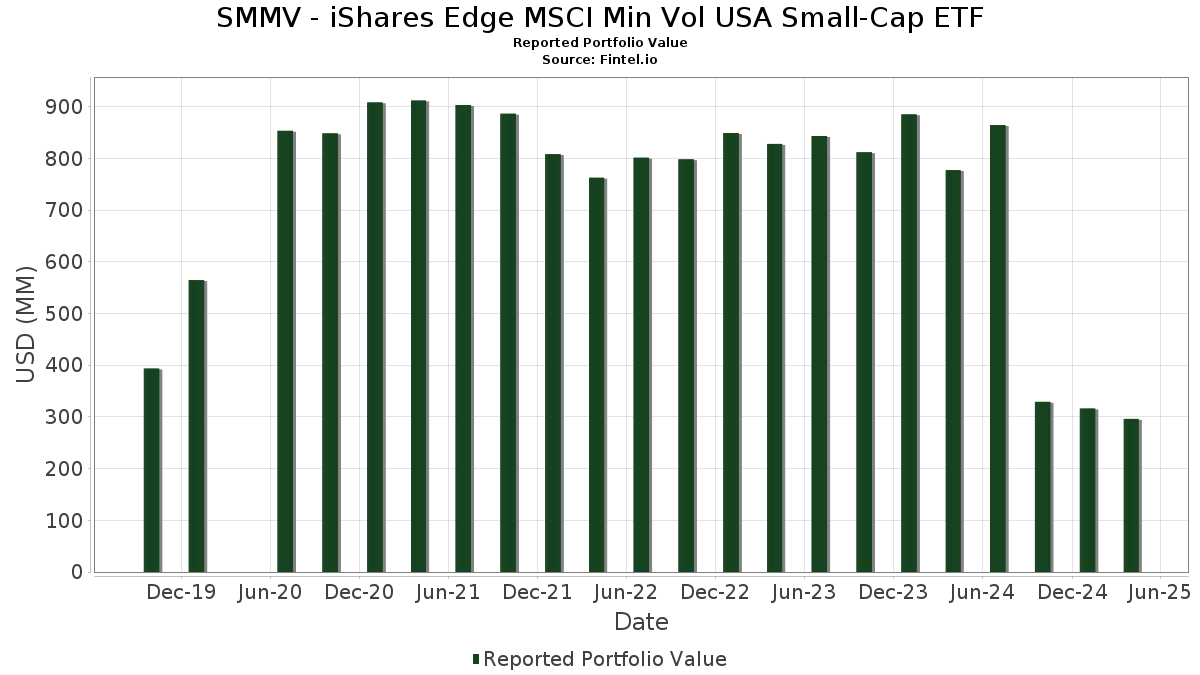
| Nilai Portofolio | $ 296,112,640 |
| Posisi Saat Ini | 281 |
Kepemilikan Terbaru, Kinerja, AUM (dari 13F, 13D)
SMMV - iShares Edge MSCI Min Vol USA Small-Cap ETF telah mengungkapkan total kepemilikan 281 dalam pengajuan SEC terbaru mereka. Nilai portofolio terbaru dihitung sebesar $ 296,112,640 USD. Aset yang Dikelola (AUM) sebenarnya adalah nilai ini ditambah kas (yang tidak diungkapkan). Aset-aset utama SMMV - iShares Edge MSCI Min Vol USA Small-Cap ETF adalah Royal Gold, Inc. (US:RGLD) , Old Republic International Corporation (US:ORI) , Agree Realty Corporation (US:ADC) , Pinnacle West Capital Corporation (US:PNW) , and AXIS Capital Holdings Limited (US:AXS) . Posisi baru SMMV - iShares Edge MSCI Min Vol USA Small-Cap ETF meliputi: The Western Union Company (US:WU) , .
Peningkatan Tertinggi Kuartal Ini
Kami menggunakan perubahan dalam alokasi portofolio karena ini adalah metrik yang paling bermakna. Perubahan dapat disebabkan oleh perdagangan atau perubahan harga saham.
| Keamanan | Saham (MM) |
Nilai (Juta Dolar AS) |
Portfolio % | ΔPorsyento ng Portfolio |
|---|---|---|---|---|
| 0.03 | 5.82 | 1.9638 | 0.5406 | |
| 0.04 | 4.11 | 1.3856 | 0.2715 | |
| 0.05 | 4.77 | 1.6096 | 0.2155 | |
| 0.03 | 3.15 | 1.0623 | 0.2153 | |
| 0.07 | 2.92 | 0.9839 | 0.1945 | |
| 0.06 | 4.79 | 1.6159 | 0.1839 | |
| 0.01 | 2.51 | 0.8470 | 0.1692 | |
| 0.02 | 2.19 | 0.7402 | 0.1686 | |
| 0.05 | 4.45 | 1.5015 | 0.1577 | |
| 0.09 | 3.96 | 1.3357 | 0.1576 |
Penurunan Tertinggi Kuartal Ini
Kami menggunakan perubahan dalam alokasi portofolio karena ini adalah metrik yang paling bermakna. Perubahan dapat disebabkan oleh perdagangan atau perubahan harga saham.
| Keamanan | Saham (MM) |
Nilai (Juta Dolar AS) |
Portfolio % | ΔPorsyento ng Portfolio |
|---|---|---|---|---|
| 0.00 | 0.00 | 0.0000 | -4.0377 | |
| 0.00 | 0.00 | -0.2459 | ||
| 0.01 | 0.45 | 0.1531 | -0.2043 | |
| 0.02 | 0.98 | 0.3319 | -0.1582 | |
| 0.00 | 0.00 | -0.1545 | ||
| 0.02 | 2.68 | 0.9035 | -0.1475 | |
| 0.02 | 1.35 | 0.4569 | -0.1442 | |
| 0.02 | 1.81 | 0.6100 | -0.1349 | |
| 0.04 | 0.94 | 0.3161 | -0.1219 | |
| 0.00 | 0.00 | -0.1104 |
Pengajuan 13F dan Dana
Formulir ini diajukan pada 2025-06-26 untuk periode pelaporan 2025-04-30. Klik ikon tautan untuk melihat riwayat transaksi selengkapnya.
Tingkatkan ke versi premium untuk membuka data premium dan ekspor ke Excel. ![]() .
.
| Keamanan | Ketik | Harga Saham Rata-rata | Saham (MM) |
ΔSaham (%) |
ΔSaham (%) |
Nilai ($MM) |
Portpolyo (%) |
ΔPortofolio (%) |
|
|---|---|---|---|---|---|---|---|---|---|
| RGLD / Royal Gold, Inc. | 0.03 | 2.91 | 5.82 | 34.48 | 1.9638 | 0.5406 | |||
| ORI / Old Republic International Corporation | 0.13 | 3.04 | 4.94 | 5.92 | 1.6669 | 0.1331 | |||
| ADC / Agree Realty Corporation | 0.06 | 2.84 | 4.79 | 9.99 | 1.6159 | 0.1839 | |||
| PNW / Pinnacle West Capital Corporation | 0.05 | 2.81 | 4.77 | 12.53 | 1.6096 | 0.2155 | |||
| AXS / AXIS Capital Holdings Limited | 0.05 | 2.90 | 4.45 | 8.91 | 1.5015 | 0.1577 | |||
| CHE / Chemed Corporation | 0.01 | 2.87 | 4.44 | 6.44 | 1.4994 | 0.1265 | |||
| ATR / AptarGroup, Inc. | 0.03 | 2.89 | 4.20 | -1.83 | 1.4158 | 0.0104 | |||
| EHC / Encompass Health Corporation | 0.04 | 2.86 | 4.11 | 21.20 | 1.3856 | 0.2715 | |||
| MUSA / Murphy USA Inc. | 0.01 | 2.87 | 4.02 | 1.98 | 1.3574 | 0.0602 | |||
| ENSG / The Ensign Group, Inc. | 0.03 | 2.88 | 4.02 | -4.96 | 1.3567 | -0.0349 | |||
| OGE / OGE Energy Corp. | 0.09 | 2.83 | 3.96 | 10.50 | 1.3357 | 0.1576 | |||
| UNM / Unum Group | 0.05 | 1.29 | 3.91 | 3.14 | 1.3181 | 0.0728 | |||
| IDA / IDACORP, Inc. | 0.03 | 2.85 | 3.86 | 10.49 | 1.3010 | 0.1533 | |||
| THG / The Hanover Insurance Group, Inc. | 0.02 | 3.04 | 3.64 | 11.81 | 1.2272 | 0.1574 | |||
| DTM / DT Midstream, Inc. | 0.04 | 2.98 | 3.56 | -0.97 | 1.2015 | 0.0190 | |||
| INGR / Ingredion Incorporated | 0.03 | 2.80 | 3.56 | 0.08 | 1.1997 | 0.0313 | |||
| RLI / RLI Corp. | 0.05 | 3.04 | 3.39 | 3.95 | 1.1452 | 0.0716 | |||
| MMSI / Merit Medical Systems, Inc. | 0.04 | 2.86 | 3.37 | -10.77 | 1.1376 | -0.1050 | |||
| POST / Post Holdings, Inc. | 0.03 | 2.84 | 3.25 | 9.64 | 1.0978 | 0.1219 | |||
| BJ / BJ's Wholesale Club Holdings, Inc. | 0.03 | 2.99 | 3.15 | 22.21 | 1.0623 | 0.2153 | |||
| OHI / Omega Healthcare Investors, Inc. | 0.08 | 2.82 | 3.10 | 8.36 | 1.0455 | 0.1050 | |||
| RNR / RenaissanceRe Holdings Ltd. | 0.01 | 3.00 | 3.03 | 7.15 | 1.0217 | 0.0923 | |||
| EXEL / Exelixis, Inc. | 0.07 | 2.86 | 2.92 | 21.46 | 0.9839 | 0.1945 | |||
| TKO / TKO Group Holdings, Inc. | 0.02 | 2.90 | 2.89 | 8.01 | 0.9737 | 0.0951 | |||
| NYT / The New York Times Company | 0.05 | 1.44 | 2.82 | -2.73 | 0.9511 | -0.0020 | |||
| DLB / Dolby Laboratories, Inc. | 0.04 | 2.71 | 2.79 | -5.80 | 0.9420 | -0.0326 | |||
| TXNM / TXNM Energy, Inc. | 0.05 | 2.91 | 2.79 | 13.26 | 0.9398 | 0.1309 | |||
| CTRE / CareTrust REIT, Inc. | 0.09 | 2.94 | 2.77 | 13.68 | 0.9341 | 0.1334 | |||
| WTM / White Mountains Insurance Group, Ltd. | 0.00 | 3.17 | 2.76 | -5.63 | 0.9328 | -0.0307 | |||
| LSTR / Landstar System, Inc. | 0.02 | 2.83 | 2.68 | -16.21 | 0.9035 | -0.1475 | |||
| CACI / CACI International Inc | 0.01 | 2.74 | 2.51 | 21.79 | 0.8470 | 0.1692 | |||
| PBH / Prestige Consumer Healthcare Inc. | 0.03 | 2.87 | 2.47 | 8.88 | 0.8318 | 0.0870 | |||
| CASY / Casey's General Stores, Inc. | 0.01 | 3.03 | 2.44 | 12.99 | 0.8222 | 0.1131 | |||
| HESM / Hess Midstream LP | 0.06 | 2.76 | 2.37 | -5.69 | 0.8005 | -0.0269 | |||
| LOPE / Grand Canyon Education, Inc. | 0.01 | 2.98 | 2.36 | 4.57 | 0.7955 | 0.0541 | |||
| SIGI / Selective Insurance Group, Inc. | 0.03 | 2.99 | 2.33 | 6.77 | 0.7874 | 0.0687 | |||
| ALKS / Alkermes plc | 0.08 | 2.81 | 2.29 | -6.20 | 0.7713 | -0.0300 | |||
| ALE / ALLETE, Inc. | 0.03 | 2.85 | 2.28 | 2.61 | 0.7700 | 0.0389 | |||
| PAGP / Plains GP Holdings, L.P. - Limited Partnership | 0.12 | 2.84 | 2.25 | -9.40 | 0.7582 | -0.0571 | |||
| FCFS / FirstCash Holdings, Inc. | 0.02 | 2.83 | 2.19 | 26.25 | 0.7402 | 0.1686 | |||
| FLO / Flowers Foods, Inc. | 0.12 | 2.51 | 2.16 | -7.77 | 0.7290 | -0.0413 | |||
| RYAN / Ryan Specialty Holdings, Inc. | 0.03 | 3.06 | 2.05 | 1.43 | 0.6930 | 0.0270 | |||
| NNN / NNN REIT, Inc. | 0.05 | 2.56 | 2.04 | 7.03 | 0.6890 | 0.0617 | |||
| NEU / NewMarket Corporation | 0.00 | 2.74 | 1.99 | 26.98 | 0.6703 | 0.1556 | |||
| G / Genpact Limited | 0.04 | 2.81 | 1.99 | 6.15 | 0.6702 | 0.0547 | |||
| ESGR / Enstar Group Limited | 0.01 | 3.10 | 1.96 | 5.44 | 0.6614 | 0.0500 | |||
| GNTX / Gentex Corporation | 0.09 | 2.89 | 1.95 | -13.55 | 0.6589 | -0.0838 | |||
| IDCC / InterDigital, Inc. | 0.01 | 2.71 | 1.94 | 12.84 | 0.6555 | 0.0893 | |||
| PSN / Parsons Corporation | 0.03 | 2.87 | 1.92 | -13.26 | 0.6471 | -0.0798 | |||
| AMED / Amedisys, Inc. | 0.02 | 2.97 | 1.91 | 5.60 | 0.6435 | 0.0498 | |||
| FCN / FTI Consulting, Inc. | 0.01 | 2.86 | 1.91 | -12.45 | 0.6433 | -0.0728 | |||
| BRC / Brady Corporation | 0.03 | 2.84 | 1.90 | -2.96 | 0.6414 | -0.0027 | |||
| MSGS / Madison Square Garden Sports Corp. | 0.01 | 2.87 | 1.83 | -9.91 | 0.6168 | -0.0504 | |||
| CWST / Casella Waste Systems, Inc. | 0.02 | 2.90 | 1.83 | 12.36 | 0.6168 | 0.0819 | |||
| VNOM / Viper Energy, Inc. | 0.05 | 2.90 | 1.82 | -11.53 | 0.6137 | -0.0623 | |||
| HQY / HealthEquity, Inc. | 0.02 | 2.80 | 1.81 | -20.19 | 0.6100 | -0.1349 | |||
| VIRT / Virtu Financial, Inc. | 0.04 | 2.78 | 1.75 | 0.40 | 0.5915 | 0.0176 | |||
| TXRH / Texas Roadhouse, Inc. | 0.01 | 2.95 | 1.73 | -5.63 | 0.5828 | -0.0193 | |||
| PRGS / Progress Software Corporation | 0.03 | 2.69 | 1.58 | 7.41 | 0.5329 | 0.0493 | |||
| GWRE / Guidewire Software, Inc. | 0.01 | 2.81 | 1.55 | -0.32 | 0.5232 | 0.0115 | |||
| NWE / NorthWestern Energy Group, Inc. | 0.03 | 2.65 | 1.51 | 10.92 | 0.5106 | 0.0618 | |||
| CALM / Cal-Maine Foods, Inc. | 0.02 | 2.89 | 1.51 | -11.01 | 0.5106 | -0.0483 | |||
| SFM / Sprouts Farmers Market, Inc. | 0.01 | 3.12 | 1.51 | 11.37 | 0.5092 | 0.0636 | |||
| CCCS / CCC Intelligent Solutions Holdings Inc. | 0.16 | 2.74 | 1.50 | -14.33 | 0.5062 | -0.0699 | |||
| PPC / Pilgrim's Pride Corporation | 0.03 | 2.80 | 1.46 | 20.53 | 0.4916 | 0.0942 | |||
| HRB / H&R Block, Inc. | 0.02 | 2.75 | 1.45 | 12.16 | 0.4889 | 0.0641 | |||
| KBR / KBR, Inc. | 0.03 | 2.63 | 1.45 | -0.41 | 0.4880 | 0.0104 | |||
| LRN / Stride, Inc. | 0.01 | 2.91 | 1.44 | 8.51 | 0.4866 | 0.0496 | |||
| SAIC / Science Applications International Corporation | 0.01 | 2.53 | 1.44 | 14.62 | 0.4844 | 0.0725 | |||
| POR / Portland General Electric Company | 0.03 | 2.41 | 1.41 | 4.84 | 0.4756 | 0.0335 | |||
| JAZZ / Jazz Pharmaceuticals plc | 0.01 | 2.71 | 1.40 | -3.38 | 0.4732 | -0.0043 | |||
| CCOI / Cogent Communications Holdings, Inc. | 0.02 | 2.70 | 1.35 | -25.94 | 0.4569 | -0.1442 | |||
| WEN / The Wendy's Company | 0.11 | 2.71 | 1.33 | -13.40 | 0.4472 | -0.0562 | |||
| XENE / Xenon Pharmaceuticals Inc. | 0.03 | 2.94 | 1.32 | -1.64 | 0.4457 | 0.0041 | |||
| COKE / Coca-Cola Consolidated, Inc. | 0.00 | 3.30 | 1.32 | 2.41 | 0.4443 | 0.0215 | |||
| HURN / Huron Consulting Group Inc. | 0.01 | 2.98 | 1.31 | 9.46 | 0.4415 | 0.0485 | |||
| IONS / Ionis Pharmaceuticals, Inc. | 0.04 | 2.76 | 1.30 | -1.07 | 0.4389 | 0.0065 | |||
| AM / Antero Midstream Corporation | 0.08 | 2.76 | 1.26 | 5.99 | 0.4244 | 0.0343 | |||
| PINC / Premier, Inc. | 0.06 | 2.38 | 1.25 | -8.08 | 0.4224 | -0.0254 | |||
| SBRA / Sabra Health Care REIT, Inc. | 0.07 | 3.01 | 1.25 | 10.06 | 0.4209 | 0.0481 | |||
| JJSF / J&J Snack Foods Corp. | 0.01 | 2.88 | 1.23 | -2.85 | 0.4144 | -0.0013 | |||
| DRS / Leonardo DRS, Inc. | 0.03 | 3.00 | 1.19 | 8.30 | 0.4011 | 0.0402 | |||
| SMPL / The Simply Good Foods Company | 0.03 | 2.93 | 1.17 | -2.18 | 0.3934 | 0.0014 | |||
| CWAN / Clearwater Analytics Holdings, Inc. | 0.05 | 2.82 | 1.15 | -16.94 | 0.3872 | -0.0673 | |||
| SON / Sonoco Products Company | 0.03 | 2.49 | 1.13 | -11.84 | 0.3822 | -0.0401 | |||
| WWD / Woodward, Inc. | 0.01 | 2.72 | 1.12 | 4.00 | 0.3777 | 0.0238 | |||
| SKWD / Skyward Specialty Insurance Group, Inc. | 0.02 | 3.13 | 1.11 | 23.58 | 0.3751 | 0.0794 | |||
| LBTYA / Liberty Global Ltd. | 0.10 | 3.10 | 1.10 | -1.96 | 0.3721 | 0.0024 | |||
| ADUS / Addus HomeCare Corporation | 0.01 | 2.91 | 1.10 | -14.00 | 0.3713 | -0.0496 | |||
| CW / Curtiss-Wright Corporation | 0.00 | 3.04 | 1.10 | 2.42 | 0.3712 | 0.0180 | |||
| HLI / Houlihan Lokey, Inc. | 0.01 | 2.64 | 1.06 | -8.46 | 0.3578 | -0.0231 | |||
| BWXT / BWX Technologies, Inc. | 0.01 | 2.85 | 1.05 | -0.66 | 0.3549 | 0.0068 | |||
| BATRK / Atlanta Braves Holdings, Inc. | 0.03 | 2.43 | 1.05 | 5.32 | 0.3545 | 0.0266 | |||
| MSA / MSA Safety Incorporated | 0.01 | 2.57 | 1.05 | -2.05 | 0.3543 | 0.0020 | |||
| DCI / Donaldson Company, Inc. | 0.02 | 2.73 | 1.03 | -5.14 | 0.3492 | -0.0096 | |||
| AVPT / AvePoint, Inc. | 0.06 | 2.88 | 1.03 | -10.43 | 0.3477 | -0.0306 | |||
| BOX / Box, Inc. | 0.03 | 2.72 | 1.02 | -3.97 | 0.3427 | -0.0051 | |||
| CNK / Cinemark Holdings, Inc. | 0.03 | 2.91 | 0.99 | 7.59 | 0.3348 | 0.0313 | |||
| ALTM / Arcadium Lithium plc | 0.02 | 2.86 | 0.98 | -34.03 | 0.3319 | -0.1582 | |||
| HMN / Horace Mann Educators Corporation | 0.02 | -4.46 | 0.98 | 2.73 | 0.3310 | 0.0170 | |||
| SNX / TD SYNNEX Corporation | 0.01 | 2.83 | 0.97 | -20.05 | 0.3259 | -0.0714 | |||
| AVT / Avnet, Inc. | 0.02 | 2.38 | 0.96 | -6.87 | 0.3248 | -0.0151 | |||
| LTC / LTC Properties, Inc. | 0.03 | 2.78 | 0.96 | 7.15 | 0.3238 | 0.0293 | |||
| UNF / UniFirst Corporation | 0.01 | 2.81 | 0.95 | -14.39 | 0.3214 | -0.0445 | |||
| VRRM / Verra Mobility Corporation | 0.04 | 2.60 | 0.95 | -15.21 | 0.3200 | -0.0480 | |||
| LANC / Lancaster Colony Corporation | 0.01 | 2.77 | 0.95 | -0.84 | 0.3196 | 0.0054 | |||
| WERN / Werner Enterprises, Inc. | 0.04 | 2.96 | 0.94 | -29.68 | 0.3161 | -0.1219 | |||
| DBX / Dropbox, Inc. | 0.03 | 2.53 | 0.93 | -8.98 | 0.3147 | -0.0222 | |||
| WAY / Waystar Holding Corp. | 0.02 | 2.69 | 0.91 | -5.11 | 0.3074 | -0.0081 | |||
| MIRM / Mirum Pharmaceuticals, Inc. | 0.02 | 2.85 | 0.91 | -8.57 | 0.3062 | -0.0202 | |||
| PRDO / Perdoceo Education Corporation | 0.04 | -4.74 | 0.90 | -16.85 | 0.3049 | -0.0525 | |||
| REYN / Reynolds Consumer Products Inc. | 0.04 | 2.65 | 0.89 | -14.44 | 0.3000 | -0.0419 | |||
| OLLI / Ollie's Bargain Outlet Holdings, Inc. | 0.01 | 2.83 | 0.89 | -2.10 | 0.2994 | 0.0012 | |||
| YELP / Yelp Inc. | 0.03 | 2.91 | 0.89 | -9.58 | 0.2993 | -0.0234 | |||
| GTY / Getty Realty Corp. | 0.03 | 2.83 | 0.89 | -7.23 | 0.2993 | -0.0150 | |||
| OPCH / Option Care Health, Inc. | 0.03 | 3.00 | 0.87 | 7.64 | 0.2949 | 0.0279 | |||
| DVAX / Dynavax Technologies Corporation | 0.07 | 2.86 | 0.85 | -7.40 | 0.2873 | -0.0150 | |||
| PLNT / Planet Fitness, Inc. | 0.01 | 2.88 | 0.84 | -10.03 | 0.2848 | -0.0237 | |||
| INSW / International Seaways, Inc. | 0.02 | 2.98 | 0.83 | -10.18 | 0.2798 | -0.0239 | |||
| MCY / Mercury General Corporation | 0.01 | 2.76 | 0.81 | 14.29 | 0.2730 | 0.0401 | |||
| COLM / Columbia Sportswear Company | 0.01 | 2.76 | 0.81 | -27.71 | 0.2723 | -0.0945 | |||
| CSW / CSW Industrials, Inc. | 0.00 | 3.22 | 0.78 | -2.13 | 0.2636 | 0.0009 | |||
| SCI / Service Corporation International | 0.01 | 2.87 | 0.77 | 5.17 | 0.2611 | 0.0192 | |||
| TTEK / Tetra Tech, Inc. | 0.02 | 2.94 | 0.77 | -12.75 | 0.2610 | -0.0306 | |||
| NJR / New Jersey Resources Corporation | 0.02 | 3.09 | 0.77 | 5.31 | 0.2610 | 0.0192 | |||
| LBTYK / Liberty Global Ltd. | 0.06 | 2.67 | 0.73 | -0.68 | 0.2478 | 0.0045 | |||
| SNDR / Schneider National, Inc. | 0.03 | 2.96 | 0.73 | -25.69 | 0.2462 | -0.0764 | |||
| MSM / MSC Industrial Direct Co., Inc. | 0.01 | 2.53 | 0.72 | -2.56 | 0.2445 | 0.0002 | |||
| OSW / OneSpaWorld Holdings Limited | 0.04 | 3.21 | 0.72 | -19.37 | 0.2419 | -0.0503 | |||
| AVA / Avista Corporation | 0.02 | 1.36 | 0.72 | 14.93 | 0.2416 | 0.0365 | |||
| EIG / Employers Holdings, Inc. | 0.01 | -3.63 | 0.71 | -4.72 | 0.2383 | -0.0055 | |||
| CVLT / Commvault Systems, Inc. | 0.00 | 3.19 | 0.70 | 8.24 | 0.2351 | 0.0235 | |||
| SAFT / Safety Insurance Group, Inc. | 0.01 | 3.09 | 0.70 | -0.14 | 0.2351 | 0.0055 | |||
| NTST / NETSTREIT Corp. | 0.04 | 3.03 | 0.68 | 15.90 | 0.2288 | 0.0362 | |||
| ATEN / A10 Networks, Inc. | 0.04 | 2.70 | 0.67 | -13.68 | 0.2258 | -0.0292 | |||
| IMAX / IMAX Corporation | 0.03 | 2.95 | 0.67 | 6.38 | 0.2253 | 0.0188 | |||
| AXSM / Axsome Therapeutics, Inc. | 0.01 | 3.01 | 0.66 | 8.73 | 0.2229 | 0.0230 | |||
| EXLS / ExlService Holdings, Inc. | 0.01 | 3.30 | 0.66 | -0.46 | 0.2213 | 0.0048 | |||
| SLGN / Silgan Holdings Inc. | 0.01 | 3.20 | 0.65 | -3.12 | 0.2201 | -0.0013 | |||
| INVA / Innoviva, Inc. | 0.03 | 2.94 | 0.65 | 3.19 | 0.2184 | 0.0122 | |||
| ARMK / Aramark | 0.02 | 2.73 | 0.64 | -11.74 | 0.2157 | -0.0225 | |||
| MMS / Maximus, Inc. | 0.01 | 3.27 | 0.62 | -8.16 | 0.2090 | -0.0128 | |||
| US0669224778 / BlackRock Cash Funds: Treasury, SL Agency Shares | 0.62 | 105.74 | 0.62 | 105.69 | 0.2078 | 0.1094 | |||
| EPAC / Enerpac Tool Group Corp. | 0.02 | 3.13 | 0.61 | -7.89 | 0.2049 | -0.0119 | |||
| RGA / Reinsurance Group of America, Incorporated | 0.00 | 2.90 | 0.61 | -15.38 | 0.2042 | -0.0311 | |||
| AWR / American States Water Company | 0.01 | 3.02 | 0.60 | 12.17 | 0.2024 | 0.0265 | |||
| VVV / Valvoline Inc. | 0.02 | 2.47 | 0.59 | -5.45 | 0.1993 | -0.0060 | |||
| UTZ / Utz Brands, Inc. | 0.04 | 3.36 | 0.57 | 2.69 | 0.1936 | 0.0101 | |||
| MATX / Matson, Inc. | 0.01 | 2.89 | 0.56 | -20.93 | 0.1889 | -0.0438 | |||
| FDP / Fresh Del Monte Produce Inc. | 0.02 | 3.20 | 0.56 | 15.11 | 0.1878 | 0.0288 | |||
| DX / Dynex Capital, Inc. | 0.04 | 2.52 | 0.55 | -4.81 | 0.1872 | -0.0043 | |||
| CWT / California Water Service Group | 0.01 | 4.18 | 0.55 | 16.60 | 0.1850 | 0.0302 | |||
| AMSF / AMERISAFE, Inc. | 0.01 | 3.11 | 0.55 | -4.20 | 0.1847 | -0.0031 | |||
| CORT / Corcept Therapeutics Incorporated | 0.01 | 3.36 | 0.54 | 11.00 | 0.1808 | 0.0221 | |||
| COLL / Collegium Pharmaceutical, Inc. | 0.02 | 2.92 | 0.53 | -13.47 | 0.1800 | -0.0228 | |||
| COLD / Americold Realty Trust, Inc. | 0.03 | 2.55 | 0.53 | -9.39 | 0.1795 | -0.0132 | |||
| SPNT / SiriusPoint Ltd. | 0.03 | -10.22 | 0.53 | 3.72 | 0.1789 | 0.0106 | |||
| ASH / Ashland Inc. | 0.01 | 2.60 | 0.52 | -12.12 | 0.1764 | -0.0192 | |||
| EZPW / EZCORP, Inc. | 0.03 | 3.54 | 0.52 | 41.08 | 0.1764 | 0.0546 | |||
| IMKTA / Ingles Markets, Incorporated | 0.01 | 2.55 | 0.52 | -4.40 | 0.1760 | -0.0036 | |||
| MGEE / MGE Energy, Inc. | 0.01 | 3.03 | 0.52 | 3.59 | 0.1754 | 0.0105 | |||
| IDT / IDT Corporation | 0.01 | 3.45 | 0.51 | 10.11 | 0.1730 | 0.0200 | |||
| CHH / Choice Hotels International, Inc. | 0.00 | 2.65 | 0.51 | -12.13 | 0.1712 | -0.0187 | |||
| KRP / Kimbell Royalty Partners, LP - Limited Partnership | 0.04 | 2.52 | 0.51 | -20.06 | 0.1709 | -0.0374 | |||
| HSTM / HealthStream, Inc. | 0.02 | 2.52 | 0.51 | 5.64 | 0.1708 | 0.0132 | |||
| RARE / Ultragenyx Pharmaceutical Inc. | 0.01 | 2.81 | 0.50 | -6.89 | 0.1689 | -0.0078 | |||
| BRBR / BellRing Brands, Inc. | 0.01 | 2.92 | 0.48 | 2.59 | 0.1607 | 0.0081 | |||
| MASI / Masimo Corporation | 0.00 | 2.74 | 0.47 | -5.05 | 0.1587 | -0.0043 | |||
| HALO / Halozyme Therapeutics, Inc. | 0.01 | 2.71 | 0.46 | 11.33 | 0.1562 | 0.0195 | |||
| LAUR / Laureate Education, Inc. | 0.02 | 3.09 | 0.46 | 10.41 | 0.1541 | 0.0182 | |||
| PCVX / Vaxcyte, Inc. | 0.01 | 2.87 | 0.45 | -58.29 | 0.1531 | -0.2043 | |||
| VERX / Vertex, Inc. | 0.01 | 2.61 | 0.45 | -28.89 | 0.1531 | -0.0567 | |||
| FCPT / Four Corners Property Trust, Inc. | 0.02 | 3.16 | 0.45 | 5.14 | 0.1522 | 0.0111 | |||
| IRDM / Iridium Communications Inc. | 0.02 | 2.74 | 0.45 | -13.79 | 0.1521 | -0.0198 | |||
| BLKB / Blackbaud, Inc. | 0.01 | 2.61 | 0.45 | -19.53 | 0.1518 | -0.0319 | |||
| ULS / UL Solutions Inc. | 0.01 | 2.54 | 0.45 | 8.78 | 0.1506 | 0.0157 | |||
| PRGO / Perrigo Company plc | 0.02 | 2.15 | 0.44 | 5.46 | 0.1501 | 0.0114 | |||
| KRYS / Krystal Biotech, Inc. | 0.00 | 2.59 | 0.42 | 9.02 | 0.1429 | 0.0153 | |||
| TGNA / TEGNA Inc. | 0.03 | 2.00 | 0.42 | -9.03 | 0.1428 | -0.0104 | |||
| RGR / Sturm, Ruger & Company, Inc. | 0.01 | 2.08 | 0.42 | 16.62 | 0.1423 | 0.0233 | |||
| CNX / CNX Resources Corporation | 0.01 | 2.56 | 0.41 | 10.22 | 0.1384 | 0.0160 | |||
| CIEN / Ciena Corporation | 0.01 | 2.54 | 0.41 | -21.04 | 0.1382 | -0.0322 | |||
| MGRC / McGrath RentCorp | 0.00 | 3.40 | 0.41 | -10.00 | 0.1368 | -0.0115 | |||
| CRNX / Crinetics Pharmaceuticals, Inc. | 0.01 | 3.12 | 0.40 | -14.59 | 0.1366 | -0.0192 | |||
| HCKT / The Hackett Group, Inc. | 0.02 | 3.11 | 0.39 | -14.73 | 0.1310 | -0.0187 | |||
| CNR / Core Natural Resources, Inc. | 0.01 | 2.88 | 0.39 | -17.87 | 0.1305 | -0.0242 | |||
| ICFI / ICF International, Inc. | 0.00 | 3.01 | 0.38 | -25.00 | 0.1297 | -0.0389 | |||
| IRON / Disc Medicine, Inc. | 0.01 | 3.07 | 0.38 | -8.74 | 0.1270 | -0.0086 | |||
| SPTN / SpartanNash Company | 0.02 | 2.15 | 0.38 | 10.95 | 0.1268 | 0.0156 | |||
| CHDN / Churchill Downs Incorporated | 0.00 | 2.71 | 0.37 | -24.85 | 0.1247 | -0.0370 | |||
| ZYME / Zymeworks Inc. | 0.03 | 3.49 | 0.37 | -7.77 | 0.1245 | -0.0071 | |||
| JBSS / John B. Sanfilippo & Son, Inc. | 0.01 | 2.77 | 0.37 | -5.93 | 0.1234 | -0.0043 | |||
| OGS / ONE Gas, Inc. | 0.00 | 2.61 | 0.36 | 14.15 | 0.1227 | 0.0178 | |||
| HCI / HCI Group, Inc. | 0.00 | 1.15 | 0.36 | 21.36 | 0.1211 | 0.0239 | |||
| GPOR / Gulfport Energy Corporation | 0.00 | 2.27 | 0.36 | -1.38 | 0.1207 | 0.0017 | |||
| LMAT / LeMaitre Vascular, Inc. | 0.00 | 3.45 | 0.35 | -3.31 | 0.1183 | -0.0008 | |||
| HWKN / Hawkins, Inc. | 0.00 | 3.42 | 0.33 | 17.86 | 0.1117 | 0.0193 | |||
| CNXN / PC Connection, Inc. | 0.01 | 3.07 | 0.33 | -13.72 | 0.1104 | -0.0145 | |||
| NABL / N-able, Inc. | 0.05 | 3.07 | 0.32 | -24.94 | 0.1088 | -0.0324 | |||
| HR / Healthcare Realty Trust Incorporated | 0.02 | 2.42 | 0.32 | -5.04 | 0.1082 | -0.0028 | |||
| ANIP / ANI Pharmaceuticals, Inc. | 0.00 | 2.30 | 0.32 | 23.35 | 0.1072 | 0.0226 | |||
| ROIV / Roivant Sciences Ltd. | 0.03 | 2.16 | 0.32 | 6.40 | 0.1070 | 0.0092 | |||
| EPRT / Essential Properties Realty Trust, Inc. | 0.01 | 3.66 | 0.31 | 3.99 | 0.1058 | 0.0065 | |||
| ADMA / ADMA Biologics, Inc. | 0.01 | 2.59 | 0.31 | 51.22 | 0.1046 | 0.0372 | |||
| ABUS / Arbutus Biopharma Corporation | 0.09 | 3.14 | 0.31 | 9.96 | 0.1044 | 0.0119 | |||
| GPK / Graphic Packaging Holding Company | 0.01 | 2.72 | 0.30 | -5.33 | 0.1022 | -0.0029 | |||
| KRG / Kite Realty Group Trust | 0.01 | 3.02 | 0.30 | -3.53 | 0.1016 | -0.0012 | |||
| NHI / National Health Investors, Inc. | 0.00 | 2.67 | 0.30 | 14.12 | 0.1010 | 0.0147 | |||
| WNS / WNS (Holdings) Limited | 0.00 | 2.11 | 0.30 | 1.02 | 0.0999 | 0.0034 | |||
| EBF / Ennis, Inc. | 0.02 | 0.54 | 0.29 | -12.91 | 0.0980 | -0.0118 | |||
| ALRM / Alarm.com Holdings, Inc. | 0.01 | 3.53 | 0.29 | -8.33 | 0.0966 | -0.0063 | |||
| UTI / Universal Technical Institute, Inc. | 0.01 | 4.76 | 0.28 | 7.25 | 0.0950 | 0.0086 | |||
| NPK / National Presto Industries, Inc. | 0.00 | 3.27 | 0.28 | -9.48 | 0.0936 | -0.0071 | |||
| WMK / Weis Markets, Inc. | 0.00 | 2.79 | 0.27 | 31.22 | 0.0909 | 0.0232 | |||
| CPK / Chesapeake Utilities Corporation | 0.00 | 7.03 | 0.27 | 15.02 | 0.0906 | 0.0140 | |||
| CCRN / Cross Country Healthcare, Inc. | 0.02 | 2.83 | 0.27 | -23.63 | 0.0897 | -0.0246 | |||
| SKX / Skechers U.S.A., Inc. | 0.01 | 3.42 | 0.26 | -34.16 | 0.0893 | -0.0427 | |||
| BBSI / Barrett Business Services, Inc. | 0.01 | 3.18 | 0.26 | -3.30 | 0.0891 | -0.0008 | |||
| ACAD / ACADIA Pharmaceuticals Inc. | 0.02 | 3.40 | 0.25 | -19.11 | 0.0859 | -0.0176 | |||
| TR / Tootsie Roll Industries, Inc. | 0.01 | 5.67 | 0.25 | 9.21 | 0.0841 | 0.0088 | |||
| VITL / Vital Farms, Inc. | 0.01 | 4.04 | 0.25 | -18.81 | 0.0830 | -0.0166 | |||
| GNK / Genco Shipping & Trading Limited | 0.02 | 2.28 | 0.24 | -8.61 | 0.0827 | -0.0052 | |||
| CRAI / CRA International, Inc. | 0.00 | 2.63 | 0.24 | -9.09 | 0.0811 | -0.0061 | |||
| MCS / The Marcus Corporation | 0.01 | 3.29 | 0.24 | -16.14 | 0.0807 | -0.0132 | |||
| Kiniksa Pharmaceuticals International plc / EC (GB00BRXB0C07) | 0.01 | 3.28 | 0.24 | 42.51 | 0.0804 | 0.0253 | |||
| AGX / Argan, Inc. | 0.00 | 3.15 | 0.24 | 15.20 | 0.0796 | 0.0124 | |||
| SR / Spire Inc. | 0.00 | 1.72 | 0.24 | 9.81 | 0.0794 | 0.0089 | |||
| NTGR / NETGEAR, Inc. | 0.01 | 2.60 | 0.22 | -10.40 | 0.0757 | -0.0067 | |||
| NTCT / NetScout Systems, Inc. | 0.01 | 1.64 | 0.22 | -10.53 | 0.0748 | -0.0065 | |||
| OSIS / OSI Systems, Inc. | 0.00 | 1.34 | 0.22 | 5.85 | 0.0734 | 0.0057 | |||
| ACT / Enact Holdings, Inc. | 0.01 | 6.42 | 0.21 | 12.83 | 0.0712 | 0.0097 | |||
| PLXS / Plexus Corp. | 0.00 | 3.26 | 0.21 | -10.68 | 0.0706 | -0.0065 | |||
| FLGT / Fulgent Genetics, Inc. | 0.01 | 3.10 | 0.21 | 7.22 | 0.0704 | 0.0066 | |||
| LQDT / Liquidity Services, Inc. | 0.01 | 3.33 | 0.21 | -5.53 | 0.0695 | -0.0020 | |||
| DORM / Dorman Products, Inc. | 0.00 | 4.03 | 0.20 | -10.22 | 0.0682 | -0.0058 | |||
| INSP / Inspire Medical Systems, Inc. | 0.00 | 2.75 | 0.20 | -15.90 | 0.0679 | -0.0108 | |||
| ATGE / Adtalem Global Education Inc. | 0.00 | 3.92 | 0.20 | 3.14 | 0.0666 | 0.0036 | |||
| BATRA / Atlanta Braves Holdings, Inc. | 0.00 | 5.25 | 0.20 | 7.10 | 0.0665 | 0.0060 | |||
| DAWN / Day One Biopharmaceuticals, Inc. | 0.03 | 2.80 | 0.20 | -35.43 | 0.0661 | -0.0335 | |||
| BCRX / BioCryst Pharmaceuticals, Inc. | 0.02 | 1.91 | 0.19 | 14.63 | 0.0636 | 0.0093 | |||
| FTDR / Frontdoor, Inc. | 0.00 | 3.13 | 0.19 | -29.17 | 0.0632 | -0.0238 | |||
| USM / United States Cellular Corporation | 0.00 | 3.42 | 0.18 | 13.21 | 0.0610 | 0.0084 | |||
| FRT / Federal Realty Investment Trust | 0.00 | 1.28 | 0.18 | -12.32 | 0.0603 | -0.0067 | |||
| PTGX / Protagonist Therapeutics, Inc. | 0.00 | 3.99 | 0.18 | 25.71 | 0.0597 | 0.0135 | |||
| AVBP / ArriVent BioPharma, Inc. | 0.01 | 3.34 | 0.18 | -22.81 | 0.0595 | -0.0158 | |||
| AVDL / Avadel Pharmaceuticals plc | 0.02 | 3.92 | 0.18 | 17.45 | 0.0591 | 0.0099 | |||
| HCC / Warrior Met Coal, Inc. | 0.00 | 1.79 | 0.17 | -7.94 | 0.0589 | -0.0033 | |||
| CART / Maplebear Inc. | 0.00 | 3.12 | 0.17 | -14.85 | 0.0582 | -0.0084 | |||
| ATEX / Anterix Inc. | 0.01 | 2.90 | 0.17 | 7.59 | 0.0575 | 0.0054 | |||
| IRMD / IRADIMED CORPORATION | 0.00 | 3.42 | 0.17 | -8.74 | 0.0567 | -0.0037 | |||
| DJCO / Daily Journal Corporation | 0.00 | 1.62 | 0.17 | -6.25 | 0.0560 | -0.0021 | |||
| QLYS / Qualys, Inc. | 0.00 | 3.53 | 0.17 | -6.78 | 0.0560 | -0.0025 | |||
| THS / TreeHouse Foods, Inc. | 0.01 | 3.24 | 0.16 | -30.51 | 0.0556 | -0.0222 | |||
| SRPT / Sarepta Therapeutics, Inc. | 0.00 | 3.16 | 0.16 | -43.55 | 0.0549 | -0.0396 | |||
| ARW / Arrow Electronics, Inc. | 0.00 | 1.85 | 0.16 | -2.45 | 0.0537 | -0.0001 | |||
| ELME / Elme Communities | 0.01 | 4.49 | 0.15 | 6.38 | 0.0509 | 0.0044 | |||
| SEB / Seaboard Corporation | 0.00 | -4.92 | 0.15 | 0.68 | 0.0506 | 0.0017 | |||
| TH / Target Hospitality Corp. | 0.02 | 2.36 | 0.15 | -28.08 | 0.0496 | -0.0173 | |||
| PECO / Phillips Edison & Company, Inc. | 0.00 | 2.07 | 0.15 | -2.68 | 0.0490 | 0.0000 | |||
| WH / Wyndham Hotels & Resorts, Inc. | 0.00 | 1.61 | 0.15 | -17.61 | 0.0490 | -0.0089 | |||
| QNST / QuinStreet, Inc. | 0.01 | 4.20 | 0.14 | -23.12 | 0.0486 | -0.0128 | |||
| STRA / Strategic Education, Inc. | 0.00 | 4.83 | 0.14 | -12.66 | 0.0466 | -0.0056 | |||
| CGON / CG Oncology, Inc. | 0.00 | 2.60 | 0.13 | -8.39 | 0.0445 | -0.0027 | |||
| LENZ / LENZ Therapeutics, Inc. | 0.00 | 2.53 | 0.13 | 15.18 | 0.0436 | 0.0065 | |||
| ACHC / Acadia Healthcare Company, Inc. | 0.01 | 3.35 | 0.13 | -46.64 | 0.0431 | -0.0353 | |||
| NL00150012L7 / NEWAMSTERDAM PHARMA COMPANY NV | 0.01 | 1.95 | 0.13 | -12.50 | 0.0428 | -0.0049 | |||
| USPH / U.S. Physical Therapy, Inc. | 0.00 | 2.07 | 0.13 | -18.18 | 0.0425 | -0.0081 | |||
| KELYA / Kelly Services, Inc. | 0.01 | 2.10 | 0.12 | -16.22 | 0.0421 | -0.0069 | |||
| SWBI / Smith & Wesson Brands, Inc. | 0.01 | 2.38 | 0.12 | -6.98 | 0.0408 | -0.0020 | |||
| NHC / National HealthCare Corporation | 0.00 | 2.42 | 0.12 | -5.51 | 0.0405 | -0.0014 | |||
| QDEL / QuidelOrtho Corporation | 0.00 | 1.89 | 0.11 | -34.88 | 0.0378 | -0.0188 | |||
| IMXI / International Money Express, Inc. | 0.01 | 2.42 | 0.11 | -32.91 | 0.0360 | -0.0162 | |||
| IDYA / IDEAYA Biosciences, Inc. | 0.01 | 2.70 | 0.11 | -15.20 | 0.0359 | -0.0053 | |||
| WU / The Western Union Company | 0.01 | 0.10 | 0.0349 | 0.0349 | |||||
| RHI / Robert Half Inc. | 0.00 | 0.09 | 0.09 | -31.88 | 0.0321 | -0.0136 | |||
| PBF / PBF Energy Inc. | 0.01 | 2.57 | 0.09 | -39.61 | 0.0315 | -0.0194 | |||
| BTU / Peabody Energy Corporation | 0.01 | 4.20 | 0.08 | -28.97 | 0.0257 | -0.0097 | |||
| PRAX / Praxis Precision Medicines, Inc. | 0.00 | 3.58 | 0.08 | -48.98 | 0.0254 | -0.0232 | |||
| US169CVR0169 / CONTRA CHINOOK THERAPE | 0.07 | 0.00 | 0.06 | 1.67 | 0.0208 | 0.0008 | |||
| Dow Jones U.S. Real Estate Index / DE (N/A) | 0.01 | 0.0025 | 0.0025 | ||||||
| HCP / HashiCorp, Inc. | 0.00 | -100.00 | 0.00 | -100.00 | -0.1104 | ||||
| KROS / Keros Therapeutics, Inc. | 0.00 | -100.00 | 0.00 | -100.00 | -0.0132 | ||||
| US0669225197 / BlackRock Cash Funds: Institutional, SL Agency Shares | 0.00 | -100.00 | 0.00 | -100.00 | 0.0000 | -4.0377 | |||
| ITCI / Intra-Cellular Therapies, Inc. | 0.00 | -100.00 | 0.00 | -100.00 | -0.2459 | ||||
| NARI / Inari Medical, Inc. | 0.00 | -100.00 | 0.00 | -100.00 | -0.1545 | ||||
| S&P Midcap 400 E-Mini Index / DE (N/A) | -0.01 | -0.0050 | -0.0050 |