Mga Batayang Estadistika
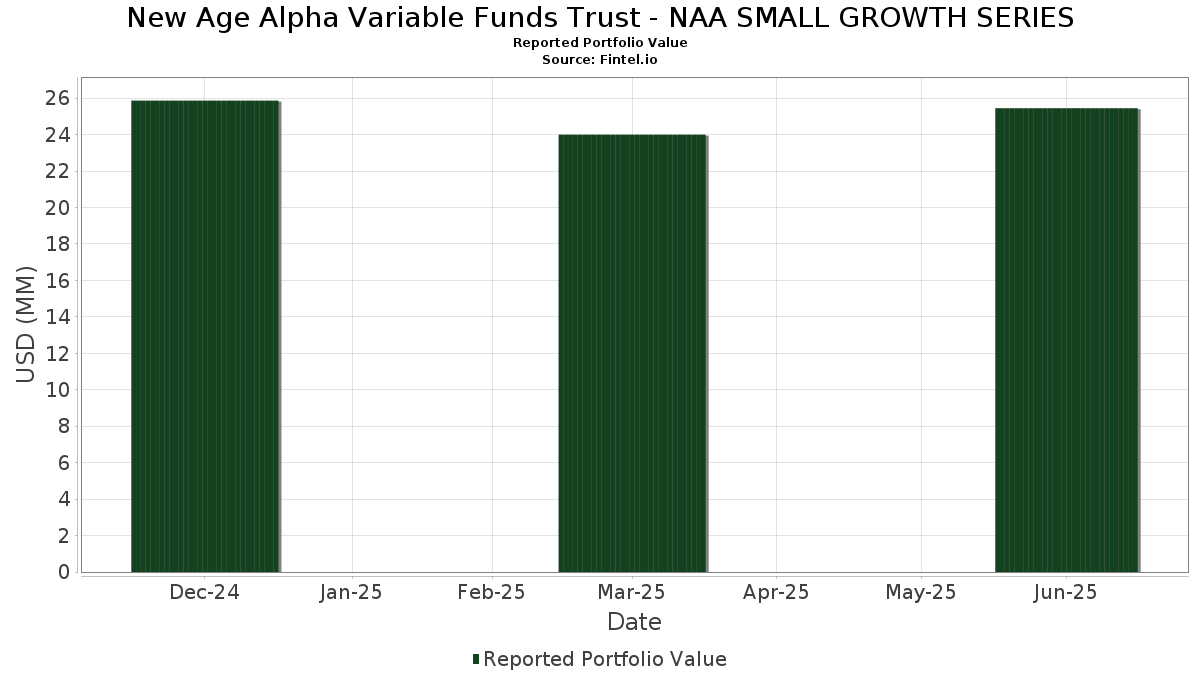
| Nilai Portofolio | $ 25,451,601 |
| Posisi Saat Ini | 129 |
Kepemilikan Terbaru, Kinerja, AUM (dari 13F, 13D)
New Age Alpha Variable Funds Trust - NAA SMALL GROWTH SERIES telah mengungkapkan total kepemilikan 129 dalam pengajuan SEC terbaru mereka. Nilai portofolio terbaru dihitung sebesar $ 25,451,601 USD. Aset yang Dikelola (AUM) sebenarnya adalah nilai ini ditambah kas (yang tidak diungkapkan). Aset-aset utama New Age Alpha Variable Funds Trust - NAA SMALL GROWTH SERIES adalah Dynatrace, Inc. (US:DT) , Carpenter Technology Corporation (US:CRS) , ATI Inc. (US:ATI) , HealthEquity, Inc. (US:HQY) , and SPX Technologies, Inc. (US:SPXC) . Posisi baru New Age Alpha Variable Funds Trust - NAA SMALL GROWTH SERIES meliputi: e.l.f. Beauty, Inc. (US:ELF) , Sterling Infrastructure, Inc. (US:STRL) , Ryman Hospitality Properties, Inc. (US:RHP) , iShares Trust - iShares S&P Small-Cap 600 Growth ETF (US:IJT) , and BancFirst Corporation (US:BANF) .
Peningkatan Tertinggi Kuartal Ini
Kami menggunakan perubahan dalam alokasi portofolio karena ini adalah metrik yang paling bermakna. Perubahan dapat disebabkan oleh perdagangan atau perubahan harga saham.
| Keamanan | Saham (MM) |
Nilai (Juta Dolar AS) |
Portfolio % | ΔPorsyento ng Portfolio |
|---|---|---|---|---|
| 0.01 | 0.77 | 3.0265 | 1.7659 | |
| 0.00 | 0.32 | 1.2686 | 1.2686 | |
| 0.00 | 0.30 | 1.1647 | 1.1647 | |
| 0.00 | 0.29 | 1.1299 | 1.1299 | |
| 0.00 | 0.24 | 0.9468 | 0.9468 | |
| 0.23 | 0.8914 | 0.8914 | ||
| 0.00 | 0.38 | 1.5013 | 0.7883 | |
| 0.01 | 0.58 | 2.2966 | 0.7110 | |
| 0.00 | 0.64 | 2.5278 | 0.5971 | |
| 0.00 | 0.26 | 1.0059 | 0.5298 |
Penurunan Tertinggi Kuartal Ini
Kami menggunakan perubahan dalam alokasi portofolio karena ini adalah metrik yang paling bermakna. Perubahan dapat disebabkan oleh perdagangan atau perubahan harga saham.
| Keamanan | Saham (MM) |
Nilai (Juta Dolar AS) |
Portfolio % | ΔPorsyento ng Portfolio |
|---|---|---|---|---|
| 0.00 | 0.34 | 1.3210 | -0.9574 | |
| 0.00 | 0.17 | 0.6792 | -0.3892 | |
| 0.01 | 0.24 | 0.9545 | -0.2705 | |
| 0.00 | 0.19 | 0.7512 | -0.2655 | |
| 0.00 | 0.27 | 1.0624 | -0.2536 | |
| 0.01 | 0.36 | 1.4117 | -0.2118 | |
| 0.00 | 0.18 | 0.6985 | -0.2046 | |
| 0.00 | 0.27 | 1.0481 | -0.1788 | |
| 0.01 | 0.12 | 0.4914 | -0.1686 | |
| 0.00 | 0.17 | 0.6564 | -0.1677 |
Pengajuan 13F dan Dana
Formulir ini diajukan pada 2025-08-28 untuk periode pelaporan 2025-06-30. Klik ikon tautan untuk melihat riwayat transaksi selengkapnya.
Tingkatkan ke versi premium untuk membuka data premium dan ekspor ke Excel. ![]() .
.
| Keamanan | Ketik | Harga Saham Rata-rata | Saham (MM) |
ΔSaham (%) |
ΔSaham (%) |
Nilai ($MM) |
Portpolyo (%) |
ΔPortofolio (%) |
|
|---|---|---|---|---|---|---|---|---|---|
| DT / Dynatrace, Inc. | 0.01 | 117.36 | 0.77 | 155.15 | 3.0265 | 1.7659 | |||
| CRS / Carpenter Technology Corporation | 0.00 | -9.02 | 0.64 | 38.74 | 2.5278 | 0.5971 | |||
| ATI / ATI Inc. | 0.01 | -7.47 | 0.58 | 53.56 | 2.2966 | 0.7110 | |||
| HQY / HealthEquity, Inc. | 0.00 | -2.72 | 0.45 | 15.27 | 1.7883 | 0.1445 | |||
| SPXC / SPX Technologies, Inc. | 0.00 | -1.98 | 0.39 | 27.54 | 1.5343 | 0.2598 | |||
| AVAV / AeroVironment, Inc. | 0.00 | -6.63 | 0.38 | 123.53 | 1.5013 | 0.7883 | |||
| CVLT / Commvault Systems, Inc. | 0.00 | -2.50 | 0.38 | 7.65 | 1.4997 | 0.0241 | |||
| MASI / Masimo Corporation | 0.00 | -2.64 | 0.37 | -1.85 | 1.4650 | -0.1148 | |||
| EAT / Brinker International, Inc. | 0.00 | -12.16 | 0.36 | 6.21 | 1.4170 | 0.0036 | |||
| EXLS / ExlService Holdings, Inc. | 0.01 | -0.62 | 0.36 | -7.73 | 1.4117 | -0.2118 | |||
| BMI / Badger Meter, Inc. | 0.00 | -4.13 | 0.35 | 23.51 | 1.3909 | 0.1964 | |||
| AWI / Armstrong World Industries, Inc. | 0.00 | -5.30 | 0.34 | 9.27 | 1.3494 | 0.0393 | |||
| CORT / Corcept Therapeutics Incorporated | 0.00 | -4.36 | 0.34 | -38.53 | 1.3210 | -0.9574 | |||
| DY / Dycom Industries, Inc. | 0.00 | -7.61 | 0.34 | 48.23 | 1.3203 | 0.3759 | |||
| ELF / e.l.f. Beauty, Inc. | 0.00 | 0.32 | 1.2686 | 1.2686 | |||||
| ALK / Alaska Air Group, Inc. | 0.01 | -2.17 | 0.31 | -1.57 | 1.2383 | -0.0965 | |||
| FSS / Federal Signal Corporation | 0.00 | -8.45 | 0.30 | 32.75 | 1.1994 | 0.2395 | |||
| EPRT / Essential Properties Realty Trust, Inc. | 0.01 | 6.40 | 0.30 | 4.11 | 1.1991 | -0.0229 | |||
| MARA / MARA Holdings, Inc. | 0.02 | 15.83 | 0.30 | 57.67 | 1.1776 | 0.3872 | |||
| STRL / Sterling Infrastructure, Inc. | 0.00 | 0.30 | 1.1647 | 1.1647 | |||||
| CFR / Cullen/Frost Bankers, Inc. | 0.00 | -2.53 | 0.29 | 0.00 | 1.1321 | -0.0672 | |||
| RHP / Ryman Hospitality Properties, Inc. | 0.00 | 0.29 | 1.1299 | 1.1299 | |||||
| LRN / Stride, Inc. | 0.00 | -10.30 | 0.29 | 2.89 | 1.1265 | -0.0334 | |||
| IDCC / InterDigital, Inc. | 0.00 | -6.17 | 0.27 | 1.49 | 1.0753 | -0.0449 | |||
| MMSI / Merit Medical Systems, Inc. | 0.00 | -3.22 | 0.27 | -14.60 | 1.0624 | -0.2536 | |||
| LPX / Louisiana-Pacific Corporation | 0.00 | -3.13 | 0.27 | -9.56 | 1.0481 | -0.1788 | |||
| SPSC / SPS Commerce, Inc. | 0.00 | 1.35 | 0.26 | 3.94 | 1.0436 | -0.0210 | |||
| SHAK / Shake Shack Inc. | 0.00 | -8.79 | 0.26 | 45.56 | 1.0350 | 0.2806 | |||
| GKOS / Glaukos Corporation | 0.00 | -9.83 | 0.26 | -5.42 | 1.0343 | -0.1243 | |||
| TGTX / TG Therapeutics, Inc. | 0.01 | 5.83 | 0.26 | -3.72 | 1.0241 | -0.0998 | |||
| BCPC / Balchem Corporation | 0.00 | -2.05 | 0.26 | -5.82 | 1.0207 | -0.1311 | |||
| IWO / iShares Trust - iShares Russell 2000 Growth ETF | 0.00 | 100.22 | 0.26 | 125.66 | 1.0059 | 0.5298 | |||
| ZWS / Zurn Elkay Water Solutions Corporation | 0.01 | -4.71 | 0.25 | 5.83 | 1.0011 | -0.0032 | |||
| MOGA / Moog, Inc. - Class A | 0.00 | -4.76 | 0.25 | -0.39 | 0.9984 | -0.0661 | |||
| CSW / CSW Industrials, Inc. | 0.00 | 2.68 | 0.25 | 0.80 | 0.9958 | -0.0491 | |||
| BOX / Box, Inc. | 0.01 | -2.07 | 0.25 | 8.41 | 0.9663 | 0.0216 | |||
| TMDX / TransMedics Group, Inc. | 0.00 | 6.60 | 0.24 | 112.17 | 0.9643 | 0.4828 | |||
| LOPE / Grand Canyon Education, Inc. | 0.00 | -12.10 | 0.24 | -3.94 | 0.9630 | -0.1002 | |||
| ACIW / ACI Worldwide, Inc. | 0.01 | -1.57 | 0.24 | -17.41 | 0.9545 | -0.2705 | |||
| IJT / iShares Trust - iShares S&P Small-Cap 600 Growth ETF | 0.00 | 0.24 | 0.9468 | 0.9468 | |||||
| ESE / ESCO Technologies Inc. | 0.00 | -5.40 | 0.24 | 13.88 | 0.9398 | 0.0664 | |||
| ADMA / ADMA Biologics, Inc. | 0.01 | 8.01 | 0.24 | -0.84 | 0.9375 | -0.0650 | |||
| FLS / Flowserve Corporation | 0.00 | -5.27 | 0.23 | 1.75 | 0.9196 | -0.0405 | |||
| BBH Overnight Sweep / STIV (N/A) | 0.23 | 0.8914 | 0.8914 | ||||||
| ROIV / Roivant Sciences Ltd. | 0.02 | -9.21 | 0.22 | 1.36 | 0.8856 | -0.0402 | |||
| PIPR / Piper Sandler Companies | 0.00 | -0.12 | 0.22 | 12.00 | 0.8839 | 0.0479 | |||
| CBSH / Commerce Bancshares, Inc. | 0.00 | -2.80 | 0.22 | -3.15 | 0.8501 | -0.0780 | |||
| ITGR / Integer Holdings Corporation | 0.00 | -0.35 | 0.21 | 3.96 | 0.8291 | -0.0173 | |||
| SKYW / SkyWest, Inc. | 0.00 | -0.87 | 0.21 | 17.32 | 0.8278 | 0.0766 | |||
| IBP / Installed Building Products, Inc. | 0.00 | -2.28 | 0.21 | 2.46 | 0.8228 | -0.0259 | |||
| ATGE / Adtalem Global Education Inc. | 0.00 | -14.72 | 0.21 | 7.81 | 0.8192 | 0.0137 | |||
| AROC / Archrock, Inc. | 0.01 | -6.68 | 0.21 | -11.91 | 0.8183 | -0.1641 | |||
| BRX / Brixmor Property Group Inc. | 0.01 | -5.08 | 0.21 | -6.79 | 0.8127 | -0.1127 | |||
| FTDR / Frontdoor, Inc. | 0.00 | -10.84 | 0.20 | 37.16 | 0.8022 | 0.1805 | |||
| AX / Axos Financial, Inc. | 0.00 | -5.60 | 0.20 | 11.24 | 0.7833 | 0.0369 | |||
| PLMR / Palomar Holdings, Inc. | 0.00 | -4.81 | 0.20 | 7.03 | 0.7817 | 0.0080 | |||
| GVA / Granite Construction Incorporated | 0.00 | -6.09 | 0.20 | 16.67 | 0.7727 | 0.0694 | |||
| CALM / Cal-Maine Foods, Inc. | 0.00 | -7.41 | 0.19 | 1.60 | 0.7558 | -0.0337 | |||
| INSP / Inspire Medical Systems, Inc. | 0.00 | -3.86 | 0.19 | -21.81 | 0.7512 | -0.2655 | |||
| PJT / PJT Partners Inc. | 0.00 | -4.87 | 0.19 | 13.77 | 0.7497 | 0.0516 | |||
| RDNT / RadNet, Inc. | 0.00 | -2.10 | 0.19 | 12.12 | 0.7311 | 0.0394 | |||
| CVCO / Cavco Industries, Inc. | 0.00 | -1.92 | 0.18 | -18.06 | 0.6985 | -0.2046 | |||
| VOYA / Voya Financial, Inc. | 0.00 | -4.81 | 0.17 | -0.58 | 0.6813 | -0.0428 | |||
| SKY / Champion Homes, Inc. | 0.00 | 2.00 | 0.17 | -32.55 | 0.6792 | -0.3892 | |||
| TNL / Travel + Leisure Co. | 0.00 | -6.64 | 0.17 | 4.35 | 0.6638 | -0.0122 | |||
| MSGS / Madison Square Garden Sports Corp. | 0.00 | -6.42 | 0.17 | 0.60 | 0.6604 | -0.0367 | |||
| FR / First Industrial Realty Trust, Inc. | 0.00 | -5.33 | 0.17 | -15.74 | 0.6564 | -0.1677 | |||
| PSN / Parsons Corporation | 0.00 | -4.27 | 0.16 | 16.31 | 0.6468 | 0.0559 | |||
| FCFS / FirstCash Holdings, Inc. | 0.00 | -5.42 | 0.16 | 5.88 | 0.6417 | 0.0014 | |||
| CRUS / Cirrus Logic, Inc. | 0.00 | -6.09 | 0.16 | -1.82 | 0.6397 | -0.0506 | |||
| VIRT / Virtu Financial, Inc. | 0.00 | -13.10 | 0.16 | 1.91 | 0.6336 | -0.0242 | |||
| ADC / Agree Realty Corporation | 0.00 | -1.57 | 0.16 | -7.19 | 0.6135 | -0.0846 | |||
| NMIH / NMI Holdings, Inc. | 0.00 | -10.28 | 0.15 | 5.52 | 0.6035 | -0.0058 | |||
| ALKS / Alkermes plc | 0.01 | 0.55 | 0.15 | -12.64 | 0.6005 | -0.1302 | |||
| AM / Antero Midstream Corporation | 0.01 | -7.37 | 0.15 | -2.58 | 0.5959 | -0.0519 | |||
| SLG / SL Green Realty Corp. | 0.00 | -5.49 | 0.15 | 1.37 | 0.5837 | -0.0266 | |||
| MTG / MGIC Investment Corporation | 0.01 | -15.13 | 0.15 | -5.19 | 0.5793 | -0.0647 | |||
| WHD / Cactus, Inc. | 0.00 | -1.58 | 0.15 | -6.41 | 0.5782 | -0.0747 | |||
| NOVT / Novanta Inc. | 0.00 | -1.52 | 0.14 | -0.70 | 0.5614 | -0.0379 | |||
| CNK / Cinemark Holdings, Inc. | 0.00 | -15.34 | 0.14 | 2.21 | 0.5508 | -0.0180 | |||
| TRNO / Terreno Realty Corporation | 0.00 | -0.52 | 0.14 | -12.03 | 0.5495 | -0.1107 | |||
| ETSY / Etsy, Inc. | 0.00 | -3.61 | 0.14 | 2.26 | 0.5376 | -0.0186 | |||
| GSHD / Goosehead Insurance, Inc | 0.00 | 4.03 | 0.14 | -6.85 | 0.5372 | -0.0754 | |||
| TBBK / The Bancorp, Inc. | 0.00 | -2.61 | 0.14 | 4.65 | 0.5352 | -0.0052 | |||
| ENVA / Enova International, Inc. | 0.00 | -10.17 | 0.13 | 3.10 | 0.5278 | -0.0115 | |||
| MAC / The Macerich Company | 0.01 | -0.42 | 0.13 | -6.34 | 0.5260 | -0.0682 | |||
| MKSI / MKS Inc. | 0.00 | -5.45 | 0.13 | 16.81 | 0.5227 | 0.0499 | |||
| CTRE / CareTrust REIT, Inc. | 0.00 | -8.18 | 0.13 | -2.24 | 0.5197 | -0.0407 | |||
| GPI / Group 1 Automotive, Inc. | 0.00 | -8.59 | 0.13 | 4.84 | 0.5128 | -0.0073 | |||
| EEFT / Euronet Worldwide, Inc. | 0.00 | 2.89 | 0.13 | -3.01 | 0.5118 | -0.0440 | |||
| NOG / Northern Oil and Gas, Inc. | 0.00 | -9.96 | 0.13 | -15.69 | 0.5112 | -0.1306 | |||
| VAL / Valaris Limited | 0.00 | -9.06 | 0.13 | -2.29 | 0.5045 | -0.0438 | |||
| GMS / GMS Inc. | 0.00 | -10.88 | 0.12 | 31.91 | 0.4915 | 0.0982 | |||
| MGY / Magnolia Oil & Gas Corporation | 0.01 | -11.30 | 0.12 | -21.02 | 0.4914 | -0.1686 | |||
| BANF / BancFirst Corporation | 0.00 | 0.12 | 0.4876 | 0.4876 | |||||
| IPAR / Interparfums, Inc. | 0.00 | -1.53 | 0.12 | 13.46 | 0.4657 | 0.0309 | |||
| HCC / Warrior Met Coal, Inc. | 0.00 | -6.20 | 0.12 | -9.45 | 0.4535 | -0.0802 | |||
| MC / Moelis & Company | 0.00 | -0.11 | 0.11 | 6.54 | 0.4519 | 0.0028 | |||
| AEIS / Advanced Energy Industries, Inc. | 0.00 | -8.40 | 0.11 | 28.09 | 0.4501 | 0.0754 | |||
| MATX / Matson, Inc. | 0.00 | -5.62 | 0.11 | -17.99 | 0.4498 | -0.1317 | |||
| SKT / Tanger Inc. | 0.00 | -2.29 | 0.11 | -11.72 | 0.4463 | -0.0888 | |||
| OUT / OUTFRONT Media Inc. | 0.01 | -0.25 | 0.11 | 0.91 | 0.4409 | -0.0225 | |||
| BRKR / Bruker Corporation | 0.00 | -1.54 | 0.11 | -2.78 | 0.4161 | -0.0378 | |||
| BGC / BGC Group, Inc. | 0.01 | -3.09 | 0.10 | 8.42 | 0.4067 | 0.0079 | |||
| FBP / First BanCorp. | 0.00 | -4.11 | 0.10 | 4.12 | 0.4000 | -0.0070 | |||
| TDW / Tidewater Inc. | 0.00 | -10.93 | 0.10 | -1.94 | 0.3983 | -0.0361 | |||
| CCOI / Cogent Communications Holdings, Inc. | 0.00 | -2.74 | 0.10 | -23.48 | 0.3982 | -0.1537 | |||
| RDN / Radian Group Inc. | 0.00 | -18.51 | 0.10 | -11.50 | 0.3967 | -0.0771 | |||
| CNS / Cohen & Steers, Inc. | 0.00 | -2.34 | 0.10 | -8.26 | 0.3967 | -0.0619 | |||
| ORA / Ormat Technologies, Inc. | 0.00 | -7.19 | 0.10 | 10.34 | 0.3789 | 0.0132 | |||
| OII / Oceaneering International, Inc. | 0.00 | -11.11 | 0.10 | -15.18 | 0.3756 | -0.0959 | |||
| WMG / Warner Music Group Corp. | 0.00 | 0.09 | 0.3626 | 0.3626 | |||||
| AGO / Assured Guaranty Ltd. | 0.00 | -12.34 | 0.09 | -13.33 | 0.3607 | -0.0805 | |||
| WDFC / WD-40 Company | 0.00 | -8.49 | 0.09 | -14.56 | 0.3487 | -0.0834 | |||
| URBN / Urban Outfitters, Inc. | 0.00 | -6.25 | 0.09 | 31.34 | 0.3473 | 0.0636 | |||
| ALRM / Alarm.com Holdings, Inc. | 0.00 | -0.92 | 0.09 | 1.19 | 0.3351 | -0.0176 | |||
| MHO / M/I Homes, Inc. | 0.00 | -1.63 | 0.08 | -3.57 | 0.3203 | -0.0312 | |||
| IRDM / Iridium Communications Inc. | 0.00 | 0.08 | 0.3020 | 0.3020 | |||||
| CPK / Chesapeake Utilities Corporation | 0.00 | -4.07 | 0.08 | -10.59 | 0.3013 | -0.0544 | |||
| TPH / Tri Pointe Homes, Inc. | 0.00 | -4.10 | 0.07 | -3.90 | 0.2945 | -0.0307 | |||
| AWR / American States Water Company | 0.00 | -4.14 | 0.07 | -6.58 | 0.2800 | -0.0378 | |||
| ACLS / Axcelis Technologies, Inc. | 0.00 | -2.65 | 0.07 | 37.50 | 0.2623 | 0.0587 | |||
| APLE / Apple Hospitality REIT, Inc. | 0.01 | -5.35 | 0.06 | -15.28 | 0.2434 | -0.0582 | |||
| YELP / Yelp Inc. | 0.00 | 0.06 | 0.2423 | 0.2423 | |||||
| SHOO / Steven Madden, Ltd. | 0.00 | 4.39 | 0.06 | -4.69 | 0.2405 | -0.0308 | |||
| SATS / EchoStar Corporation | 0.00 | 0.06 | 0.2299 | 0.2299 | |||||
| YETI / YETI Holdings, Inc. | 0.00 | 0.66 | 0.06 | -5.00 | 0.2278 | -0.0241 | |||
| LBRT / Liberty Energy Inc. | 0.00 | -10.30 | 0.05 | -34.72 | 0.1867 | -0.1176 | |||
| VBK / Vanguard Index Funds - Vanguard Small-Cap Growth ETF | 0.00 | 0.01 | 0.0589 | 0.0589 |