Mga Batayang Estadistika
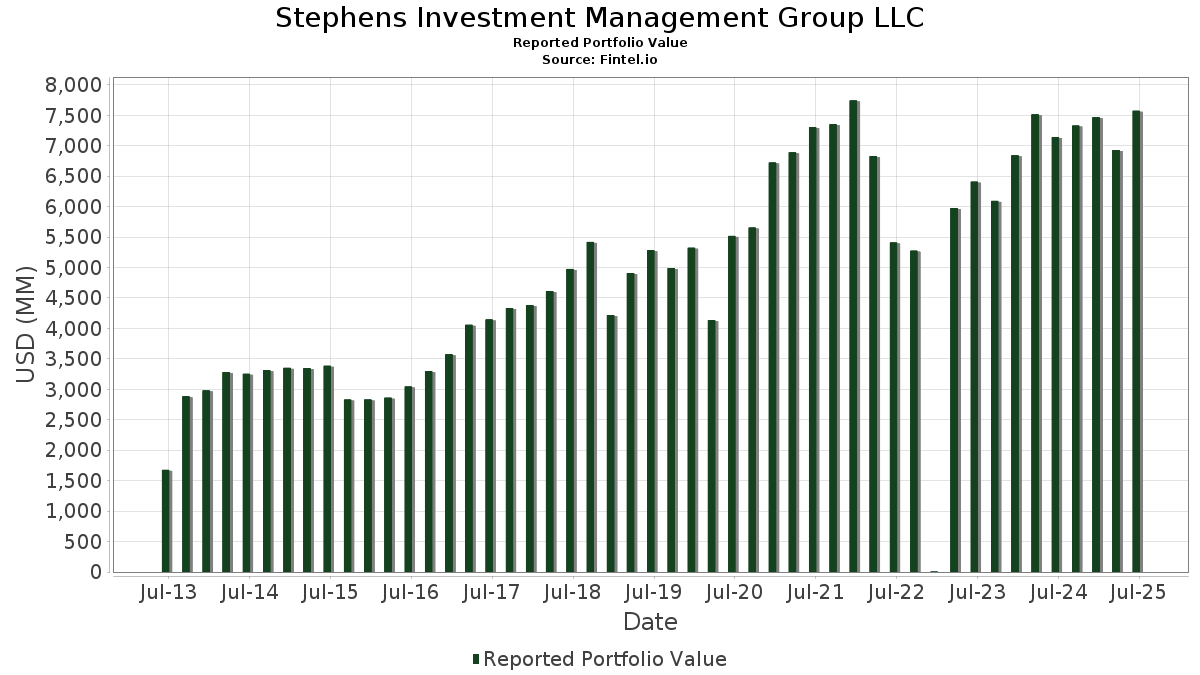
| Nilai Portofolio | $ 7,573,387,794 |
| Posisi Saat Ini | 178 |
Kepemilikan Terbaru, Kinerja, AUM (dari 13F, 13D)
Stephens Investment Management Group LLC telah mengungkapkan total kepemilikan 178 dalam pengajuan SEC terbaru mereka. Nilai portofolio terbaru dihitung sebesar $ 7,573,387,794 USD. Aset yang Dikelola (AUM) sebenarnya adalah nilai ini ditambah kas (yang tidak diungkapkan). Aset-aset utama Stephens Investment Management Group LLC adalah AeroVironment, Inc. (US:AVAV) , CyberArk Software Ltd. (US:CYBR) , Wingstop Inc. (US:WING) , Guidewire Software, Inc. (US:GWRE) , and Kratos Defense & Security Solutions, Inc. (US:KTOS) . Posisi baru Stephens Investment Management Group LLC meliputi: Viking Holdings Ltd (US:VIK) , Exact Sciences Corporation (US:EXAS) , Procore Technologies, Inc. (US:PCOR) , Xometry, Inc. (US:XMTR) , and Credo Technology Group Holding Ltd (US:CRDO) . Industri unggulan Stephens Investment Management Group LLC adalah "Mining And Quarrying Of Nonmetallic Minerals, Except Fuels" (sic 14) , "Apparel And Other Finished Products Made From Fabrics And Similar Materials" (sic 23) , and "Motor Freight Transportation And Warehousing" (sic 42) .
Peningkatan Tertinggi Kuartal Ini
Kami menggunakan perubahan dalam alokasi portofolio karena ini adalah metrik yang paling bermakna. Perubahan dapat disebabkan oleh perdagangan atau perubahan harga saham.
| Keamanan | Saham (MM) |
Nilai (Juta Dolar AS) |
Portfolio % | ΔPorsyento ng Portfolio |
|---|---|---|---|---|
| 0.63 | 180.63 | 2.3850 | 1.0719 | |
| 1.18 | 110.60 | 1.4604 | 0.7096 | |
| 0.74 | 97.69 | 1.2900 | 0.5215 | |
| 0.61 | 32.43 | 0.4282 | 0.4282 | |
| 0.64 | 81.58 | 1.0772 | 0.3799 | |
| 0.53 | 28.17 | 0.3719 | 0.3719 | |
| 0.59 | 84.62 | 1.1173 | 0.3718 | |
| 0.53 | 80.27 | 1.0599 | 0.3379 | |
| 0.55 | 85.13 | 1.1240 | 0.3377 | |
| 0.40 | 135.61 | 1.7906 | 0.3369 |
Penurunan Tertinggi Kuartal Ini
Kami menggunakan perubahan dalam alokasi portofolio karena ini adalah metrik yang paling bermakna. Perubahan dapat disebabkan oleh perdagangan atau perubahan harga saham.
| Keamanan | Saham (MM) |
Nilai (Juta Dolar AS) |
Portfolio % | ΔPorsyento ng Portfolio |
|---|---|---|---|---|
| 1.30 | 88.68 | 1.1710 | -0.5799 | |
| 1.31 | 75.65 | 0.9989 | -0.4955 | |
| 1.17 | 44.78 | 0.5913 | -0.4205 | |
| 1.29 | 67.21 | 0.8874 | -0.3436 | |
| 0.00 | 0.58 | 0.0076 | -0.3405 | |
| 0.16 | 76.75 | 1.0134 | -0.3187 | |
| 0.27 | 84.07 | 1.1101 | -0.3013 | |
| 0.41 | 60.34 | 0.7967 | -0.2861 | |
| 0.57 | 134.56 | 1.7768 | -0.2642 | |
| 0.18 | 18.40 | 0.2429 | -0.2604 |
Pengajuan 13D/G
Ini adalah daftar pengajuan 13D dan 13G yang dibuat dalam setahun terakhir (jika ada). Klik ikon tautan untuk melihat riwayat transaksi lengkap. Baris berwarna hijau menunjukkan posisi baru. Baris berwarna merah menunjukkan posisi yang sudah ditutup.
| Tanggal File | Formulir | Keamanan | Sebelumnya Saham |
Saat ini Saham |
ΔPersentase Saham | % Kepemilikan |
% ΔKepemilikan | |
|---|---|---|---|---|---|---|---|---|
| 2025-08-13 | ECPG / Encore Capital Group, Inc. | 1,248,831 | 5.30 |
Pengajuan 13F dan Dana
Formulir ini diajukan pada 2025-07-30 untuk periode pelaporan 2025-06-30. Klik ikon tautan untuk melihat riwayat transaksi selengkapnya.
Tingkatkan ke versi premium untuk membuka data premium dan ekspor ke Excel. ![]() .
.
| Keamanan | Ketik | Harga Saham Rata-rata | Saham (MM) |
ΔSaham (%) |
ΔSaham (%) |
Nilai ($MM) |
Portpolyo (%) |
ΔPortofolio (%) |
|
|---|---|---|---|---|---|---|---|---|---|
| AVAV / AeroVironment, Inc. | 0.63 | -16.98 | 180.63 | 98.49 | 2.3850 | 1.0719 | |||
| CYBR / CyberArk Software Ltd. | 0.34 | -7.17 | 138.47 | 11.74 | 1.8283 | 0.0402 | |||
| WING / Wingstop Inc. | 0.40 | -9.83 | 135.61 | 34.61 | 1.7906 | 0.3369 | |||
| GWRE / Guidewire Software, Inc. | 0.57 | -24.30 | 134.56 | -4.86 | 1.7768 | -0.2642 | |||
| KTOS / Kratos Defense & Security Solutions, Inc. | 2.58 | -33.18 | 119.82 | 4.54 | 1.5821 | -0.0718 | |||
| HEIA / Heico Corp. - Class A | 0.46 | -15.53 | 118.57 | 3.60 | 1.5657 | -0.0859 | |||
| EXEL / Exelixis, Inc. | 2.64 | -12.40 | 116.46 | 4.57 | 1.5378 | -0.0693 | |||
| FCFS / FirstCash Holdings, Inc. | 0.85 | -4.49 | 114.72 | 7.27 | 1.5148 | -0.0284 | |||
| HOOD / Robinhood Markets, Inc. | 1.18 | -5.51 | 110.60 | 112.58 | 1.4604 | 0.7096 | |||
| RBC / RBC Bearings Incorporated | 0.29 | -6.77 | 109.87 | 11.50 | 1.4507 | 0.0288 | |||
| OLLI / Ollie's Bargain Outlet Holdings, Inc. | 0.82 | 0.84 | 107.54 | 14.20 | 1.4200 | 0.0612 | |||
| HQY / HealthEquity, Inc. | 1.02 | -4.97 | 106.47 | 12.66 | 1.4059 | 0.0421 | |||
| FTI / TechnipFMC plc | 3.08 | -10.32 | 106.23 | -2.54 | 1.4027 | -0.1702 | |||
| LYV / Live Nation Entertainment, Inc. | 0.66 | -6.09 | 99.84 | 8.80 | 1.3183 | -0.0059 | |||
| EXE / Expand Energy Corporation | 0.85 | -12.35 | 99.48 | -7.93 | 1.3136 | -0.2455 | |||
| TW / Tradeweb Markets Inc. | 0.68 | -6.17 | 99.17 | -7.47 | 1.3095 | -0.2370 | |||
| TTWO / Take-Two Interactive Software, Inc. | 0.41 | -18.08 | 99.06 | -4.01 | 1.3079 | -0.1812 | |||
| FIVE / Five Below, Inc. | 0.74 | 4.78 | 97.69 | 83.45 | 1.2900 | 0.5215 | |||
| BURL / Burlington Stores, Inc. | 0.40 | -3.17 | 93.88 | -5.49 | 1.2396 | -0.1937 | |||
| MANH / Manhattan Associates, Inc. | 0.46 | 2.40 | 90.43 | 16.86 | 1.1941 | 0.0774 | |||
| EA / Electronic Arts Inc. | 0.56 | -5.54 | 88.72 | 4.38 | 1.1715 | -0.0550 | |||
| RYAN / Ryan Specialty Holdings, Inc. | 1.30 | -20.59 | 88.68 | -26.91 | 1.1710 | -0.5799 | |||
| DPZ / Domino's Pizza, Inc. | 0.19 | -5.31 | 86.46 | -7.13 | 1.1416 | -0.2018 | |||
| PLMR / Palomar Holdings, Inc. | 0.56 | -16.92 | 86.31 | -6.52 | 1.1397 | -0.1926 | |||
| AXON / Axon Enterprise, Inc. | 0.10 | -38.84 | 85.83 | -3.72 | 1.1333 | -0.1531 | |||
| IRTC / iRhythm Technologies, Inc. | 0.55 | 6.21 | 85.13 | 56.21 | 1.1240 | 0.3377 | |||
| VRNS / Varonis Systems, Inc. | 1.67 | 4.10 | 84.77 | 30.61 | 1.1194 | 0.1828 | |||
| BWXT / BWX Technologies, Inc. | 0.59 | 12.15 | 84.62 | 63.78 | 1.1173 | 0.3718 | |||
| VRSK / Verisk Analytics, Inc. | 0.27 | -17.88 | 84.07 | -14.05 | 1.1101 | -0.3013 | |||
| TYL / Tyler Technologies, Inc. | 0.14 | -5.67 | 84.01 | -3.81 | 1.1093 | -0.1510 | |||
| TOST / Toast, Inc. | 1.89 | -7.55 | 83.81 | 23.44 | 1.1066 | 0.1269 | |||
| RMD / ResMed Inc. | 0.32 | -9.42 | 83.66 | 4.40 | 1.1047 | -0.0516 | |||
| VRT / Vertiv Holdings Co | 0.64 | -5.08 | 81.58 | 68.83 | 1.0772 | 0.3799 | |||
| EVR / Evercore Inc. | 0.30 | 4.64 | 80.60 | 41.47 | 1.0642 | 0.2421 | |||
| BOOT / Boot Barn Holdings, Inc. | 0.53 | 13.38 | 80.27 | 60.42 | 1.0599 | 0.3379 | |||
| PIPR / Piper Sandler Companies | 0.28 | 11.59 | 77.70 | 25.23 | 1.0259 | 0.1307 | |||
| MTSI / MACOM Technology Solutions Holdings, Inc. | 0.54 | 8.35 | 77.36 | 54.67 | 1.0215 | 0.2997 | |||
| KNSL / Kinsale Capital Group, Inc. | 0.16 | -16.38 | 76.75 | -16.86 | 1.0134 | -0.3187 | |||
| DXCM / DexCom, Inc. | 0.88 | 4.37 | 76.63 | 33.41 | 1.0118 | 0.1830 | |||
| BRBR / BellRing Brands, Inc. | 1.31 | -6.11 | 75.65 | -26.95 | 0.9989 | -0.4955 | |||
| BFAM / Bright Horizons Family Solutions Inc. | 0.59 | -4.03 | 72.69 | -6.64 | 0.9598 | -0.1636 | |||
| LGND / Ligand Pharmaceuticals Incorporated | 0.60 | -0.40 | 68.76 | 7.69 | 0.9079 | -0.0134 | |||
| HALO / Halozyme Therapeutics, Inc. | 1.29 | -3.37 | 67.21 | -21.22 | 0.8874 | -0.3436 | |||
| RGEN / Repligen Corporation | 0.52 | -3.09 | 65.03 | -5.27 | 0.8587 | -0.1319 | |||
| PTC / PTC Inc. | 0.37 | -5.19 | 63.27 | 5.45 | 0.8354 | -0.0304 | |||
| PSTG / Pure Storage, Inc. | 1.09 | -4.64 | 62.74 | 24.03 | 0.8285 | 0.0985 | |||
| CSGP / CoStar Group, Inc. | 0.77 | 4.66 | 62.17 | 6.21 | 0.8209 | -0.0238 | |||
| ICLR / ICON Public Limited Company | 0.41 | -3.26 | 60.34 | -19.59 | 0.7967 | -0.2861 | |||
| ROK / Rockwell Automation, Inc. | 0.17 | -6.64 | 57.11 | 20.03 | 0.7542 | 0.0675 | |||
| TSCO / Tractor Supply Company | 1.08 | -6.62 | 56.90 | -10.57 | 0.7513 | -0.1668 | |||
| SITE / SiteOne Landscape Supply, Inc. | 0.46 | -2.01 | 55.85 | -2.41 | 0.7375 | -0.0884 | |||
| IDXX / IDEXX Laboratories, Inc. | 0.10 | -7.23 | 55.43 | 18.48 | 0.7319 | 0.0568 | |||
| CIEN / Ciena Corporation | 0.67 | -1.42 | 54.58 | 32.67 | 0.7207 | 0.1271 | |||
| MCHP / Microchip Technology Incorporated | 0.77 | -0.86 | 54.06 | 44.12 | 0.7138 | 0.1725 | |||
| ASO / Academy Sports and Outdoors, Inc. | 1.18 | 23.94 | 52.76 | 21.76 | 0.6967 | 0.0714 | |||
| MGY / Magnolia Oil & Gas Corporation | 2.30 | -4.90 | 51.61 | -15.36 | 0.6814 | -0.1984 | |||
| CWAN / Clearwater Analytics Holdings, Inc. | 2.29 | 32.92 | 50.14 | 8.77 | 0.6621 | -0.0032 | |||
| AZEK / The AZEK Company Inc. | 0.92 | -0.18 | 50.07 | 10.97 | 0.6611 | 0.0100 | |||
| SUPN / Supernus Pharmaceuticals, Inc. | 1.58 | -9.05 | 49.84 | -12.47 | 0.6580 | -0.1635 | |||
| RDDT / Reddit, Inc. | 0.33 | 35.01 | 49.73 | 93.79 | 0.6566 | 0.2863 | |||
| HUBB / Hubbell Incorporated | 0.12 | -5.90 | 49.25 | 16.14 | 0.6503 | 0.0384 | |||
| ECPG / Encore Capital Group, Inc. | 1.25 | 9.12 | 48.34 | 23.22 | 0.6383 | 0.0722 | |||
| OKTA / Okta, Inc. | 0.46 | -7.44 | 46.18 | -12.06 | 0.6098 | -0.1480 | |||
| SLAB / Silicon Laboratories Inc. | 0.31 | 9.44 | 46.07 | 43.27 | 0.6083 | 0.1443 | |||
| FN / Fabrinet | 0.16 | -1.24 | 45.77 | 47.35 | 0.6044 | 0.1561 | |||
| AR / Antero Resources Corporation | 1.13 | -5.04 | 45.70 | -5.42 | 0.6034 | -0.0938 | |||
| SDGR / Schrödinger, Inc. | 2.26 | 14.79 | 45.50 | 17.00 | 0.6008 | 0.0396 | |||
| AAON / AAON, Inc. | 0.61 | 0.76 | 44.80 | -4.88 | 0.5915 | -0.0881 | |||
| VNOM / Viper Energy, Inc. | 1.17 | -24.37 | 44.78 | -36.13 | 0.5913 | -0.4205 | |||
| BCPC / Balchem Corporation | 0.28 | -0.11 | 43.84 | -4.20 | 0.5789 | -0.0815 | |||
| TECH / Bio-Techne Corporation | 0.85 | 3.39 | 43.50 | -9.27 | 0.5744 | -0.1175 | |||
| NTNX / Nutanix, Inc. | 0.56 | -6.91 | 42.78 | 1.93 | 0.5649 | -0.0408 | |||
| PODD / Insulet Corporation | 0.13 | 11.79 | 42.05 | 33.75 | 0.5553 | 0.1016 | |||
| LSCC / Lattice Semiconductor Corporation | 0.86 | -3.36 | 42.02 | -9.73 | 0.5548 | -0.1169 | |||
| MEDP / Medpace Holdings, Inc. | 0.13 | -2.26 | 41.99 | 0.68 | 0.5544 | -0.0474 | |||
| POWI / Power Integrations, Inc. | 0.75 | 1.49 | 41.92 | 12.34 | 0.5536 | 0.0151 | |||
| MNDY / monday.com Ltd. | 0.13 | -5.58 | 41.43 | 22.11 | 0.5470 | 0.0575 | |||
| HOLX / Hologic, Inc. | 0.61 | -19.78 | 39.99 | -15.37 | 0.5280 | -0.1538 | |||
| TREX / Trex Company, Inc. | 0.73 | -2.55 | 39.50 | -8.79 | 0.5216 | -0.1033 | |||
| GMED / Globus Medical, Inc. | 0.65 | 0.55 | 38.28 | -18.93 | 0.5054 | -0.1759 | |||
| SG / Sweetgreen, Inc. | 2.57 | 89.51 | 38.20 | 12.71 | 0.5045 | 0.0153 | |||
| S / SentinelOne, Inc. | 1.96 | -1.08 | 35.86 | -0.54 | 0.4736 | -0.0468 | |||
| U / Unity Software Inc. | 1.47 | 77.63 | 35.49 | 119.44 | 0.4686 | 0.2352 | |||
| DT / Dynatrace, Inc. | 0.64 | 12.57 | 35.22 | 31.81 | 0.4650 | 0.0795 | |||
| SAIL / SailPoint, Inc. | 1.51 | 22.27 | 34.60 | 49.08 | 0.4569 | 0.1220 | |||
| MMS / Maximus, Inc. | 0.48 | 6.31 | 33.97 | 9.45 | 0.4485 | 0.0007 | |||
| GNRC / Generac Holdings Inc. | 0.23 | -4.47 | 33.57 | 8.02 | 0.4433 | -0.0052 | |||
| TENB / Tenable Holdings, Inc. | 0.98 | 2.77 | 33.16 | -0.76 | 0.4378 | -0.0443 | |||
| IBP / Installed Building Products, Inc. | 0.18 | -1.01 | 33.07 | 4.11 | 0.4367 | -0.0217 | |||
| BRZE / Braze, Inc. | 1.17 | 45.93 | 32.87 | 13.65 | 0.4341 | 0.0167 | |||
| SPOT / Spotify Technology S.A. | 0.04 | -29.44 | 32.82 | -1.56 | 0.4333 | -0.0477 | |||
| AMBA / Ambarella, Inc. | 0.49 | -1.17 | 32.63 | 29.73 | 0.4309 | 0.0679 | |||
| POOL / Pool Corporation | 0.11 | -4.47 | 32.60 | -12.53 | 0.4305 | -0.1074 | |||
| MGNI / Magnite, Inc. | 1.35 | 42.02 | 32.56 | 200.24 | 0.4300 | 0.2735 | |||
| VIK / Viking Holdings Ltd | 0.61 | 32.43 | 0.4282 | 0.4282 | |||||
| TNDM / Tandem Diabetes Care, Inc. | 1.74 | 1.81 | 32.39 | -0.95 | 0.4277 | -0.0442 | |||
| GTLB / GitLab Inc. | 0.71 | -4.67 | 32.01 | -8.50 | 0.4226 | -0.0821 | |||
| CGNX / Cognex Corporation | 0.99 | -4.22 | 31.56 | 1.85 | 0.4167 | -0.0304 | |||
| DRS / Leonardo DRS, Inc. | 0.68 | -12.22 | 31.51 | 24.09 | 0.4161 | 0.0496 | |||
| SAIA / Saia, Inc. | 0.11 | 4.30 | 31.18 | -18.22 | 0.4117 | -0.1384 | |||
| KRNT / Kornit Digital Ltd. | 1.53 | 12.82 | 30.40 | 17.72 | 0.4014 | 0.0288 | |||
| JBHT / J.B. Hunt Transport Services, Inc. | 0.21 | -6.49 | 29.86 | -9.24 | 0.3943 | -0.0805 | |||
| EXAS / Exact Sciences Corporation | 0.53 | 28.17 | 0.3719 | 0.3719 | |||||
| ILMN / Illumina, Inc. | 0.28 | -5.56 | 26.64 | 13.57 | 0.3517 | 0.0133 | |||
| AZTA / Azenta, Inc. | 0.81 | 0.42 | 24.84 | -10.77 | 0.3281 | -0.0737 | |||
| VIRT / Virtu Financial, Inc. | 0.55 | 12.89 | 24.55 | 32.64 | 0.3242 | 0.0571 | |||
| ANSS / ANSYS, Inc. | 0.07 | -7.72 | 24.24 | 2.39 | 0.3201 | -0.0216 | |||
| CPRT / Copart, Inc. | 0.48 | -17.59 | 23.50 | -28.54 | 0.3103 | -0.1642 | |||
| EZPW / EZCORP, Inc. | 1.67 | 0.11 | 23.21 | -5.60 | 0.3065 | -0.0483 | |||
| VSEC / VSE Corporation | 0.18 | -0.02 | 22.99 | 9.14 | 0.3035 | -0.0004 | |||
| CDNS / Cadence Design Systems, Inc. | 0.07 | -25.13 | 21.92 | -9.29 | 0.2894 | -0.0592 | |||
| PCOR / Procore Technologies, Inc. | 0.31 | 20.88 | 0.2757 | 0.2757 | |||||
| RBRK / Rubrik, Inc. | 0.23 | -10.86 | 20.57 | 30.96 | 0.2717 | 0.0450 | |||
| DSGX / The Descartes Systems Group Inc. | 0.20 | -0.28 | 20.39 | 0.53 | 0.2692 | -0.0235 | |||
| LASR / nLIGHT, Inc. | 1.03 | 13.68 | 20.36 | 187.92 | 0.2688 | 0.1668 | |||
| ROST / Ross Stores, Inc. | 0.16 | -14.32 | 20.32 | -14.47 | 0.2683 | -0.0745 | |||
| FAST / Fastenal Company | 0.45 | 88.00 | 18.98 | 1.81 | 0.2507 | -0.0184 | |||
| VST / Vistra Corp. | 0.10 | -18.13 | 18.60 | 35.11 | 0.2455 | 0.0469 | |||
| ONTO / Onto Innovation Inc. | 0.18 | -36.59 | 18.40 | -47.25 | 0.2429 | -0.2604 | |||
| POWL / Powell Industries, Inc. | 0.08 | 13.80 | 17.72 | 40.61 | 0.2340 | 0.0521 | |||
| KRMN / Karman Holdings Inc. | 0.35 | 32.66 | 17.47 | 99.95 | 0.2307 | 0.1046 | |||
| SMPL / The Simply Good Foods Company | 0.54 | 28.50 | 17.08 | 17.70 | 0.2255 | 0.0161 | |||
| VEEV / Veeva Systems Inc. | 0.06 | -17.43 | 16.73 | 2.66 | 0.2209 | -0.0142 | |||
| RVLV / Revolve Group, Inc. | 0.82 | 28.60 | 16.40 | 19.99 | 0.2166 | 0.0193 | |||
| LHX / L3Harris Technologies, Inc. | 0.06 | -17.80 | 15.70 | -1.49 | 0.2073 | -0.0227 | |||
| PRO / PROS Holdings, Inc. | 0.99 | -10.00 | 15.53 | -25.94 | 0.2050 | -0.0975 | |||
| AGYS / Agilysys, Inc. | 0.13 | 33.03 | 15.18 | 110.25 | 0.2004 | 0.0962 | |||
| MRVL / Marvell Technology, Inc. | 0.19 | -30.89 | 14.79 | -13.12 | 0.1953 | -0.0504 | |||
| SPSC / SPS Commerce, Inc. | 0.11 | 0.07 | 14.73 | 2.60 | 0.1945 | -0.0127 | |||
| ZETA / Zeta Global Holdings Corp. | 0.94 | 15.60 | 14.48 | 32.06 | 0.1913 | 0.0330 | |||
| MEG / Montrose Environmental Group, Inc. | 0.66 | 44.59 | 14.38 | 121.97 | 0.1898 | 0.0964 | |||
| BKR / Baker Hughes Company | 0.35 | -18.15 | 13.35 | -28.60 | 0.1763 | -0.0935 | |||
| LNN / Lindsay Corporation | 0.09 | 7.65 | 13.33 | 22.74 | 0.1760 | 0.0193 | |||
| XMTR / Xometry, Inc. | 0.39 | 13.29 | 0.1755 | 0.1755 | |||||
| COHR / Coherent Corp. | 0.15 | -8.67 | 13.24 | 25.46 | 0.1748 | 0.0225 | |||
| ROP / Roper Technologies, Inc. | 0.02 | -18.64 | 12.96 | -21.78 | 0.1711 | -0.0679 | |||
| RMBS / Rambus Inc. | 0.20 | 0.75 | 12.49 | 24.59 | 0.1649 | 0.0203 | |||
| FWRG / First Watch Restaurant Group, Inc. | 0.77 | 8.51 | 12.33 | 4.53 | 0.1629 | -0.0074 | |||
| FTNT / Fortinet, Inc. | 0.12 | -18.74 | 12.25 | -10.76 | 0.1617 | -0.0363 | |||
| ADSK / Autodesk, Inc. | 0.04 | -14.98 | 11.68 | 0.53 | 0.1542 | -0.0134 | |||
| BLFS / BioLife Solutions, Inc. | 0.53 | 6.94 | 11.45 | 0.85 | 0.1512 | -0.0126 | |||
| PANW / Palo Alto Networks, Inc. | 0.06 | -18.00 | 11.29 | -1.66 | 0.1491 | -0.0166 | |||
| HSIC / Henry Schein, Inc. | 0.14 | -15.31 | 10.57 | -9.68 | 0.1396 | -0.0293 | |||
| TER / Teradyne, Inc. | 0.12 | -15.80 | 10.56 | -8.34 | 0.1395 | -0.0268 | |||
| HUBG / Hub Group, Inc. | 0.31 | 0.18 | 10.49 | -9.90 | 0.1386 | -0.0295 | |||
| CRWD / CrowdStrike Holdings, Inc. | 0.02 | -38.64 | 10.16 | -11.36 | 0.1342 | -0.0313 | |||
| KEYS / Keysight Technologies, Inc. | 0.06 | -15.98 | 10.15 | -8.08 | 0.1341 | -0.0253 | |||
| FANG / Diamondback Energy, Inc. | 0.07 | -23.14 | 9.88 | -33.95 | 0.1305 | -0.0854 | |||
| CRDO / Credo Technology Group Holding Ltd | 0.10 | 9.25 | 0.1222 | 0.1222 | |||||
| HSTM / HealthStream, Inc. | 0.32 | 0.30 | 8.84 | -13.75 | 0.1167 | -0.0312 | |||
| MDB / MongoDB, Inc. | 0.04 | -15.90 | 8.46 | 0.68 | 0.1118 | -0.0095 | |||
| GLBE / Global-E Online Ltd. | 0.24 | 38.52 | 7.90 | 30.30 | 0.1043 | 0.0168 | |||
| GENI / Genius Sports Limited | 0.75 | 7.84 | 0.1036 | 0.1036 | |||||
| TITN / Titan Machinery Inc. | 0.38 | 7.61 | 0.1004 | 0.1004 | |||||
| SEI / Solaris Energy Infrastructure, Inc. | 0.27 | 0.97 | 7.59 | 31.27 | 0.1002 | 0.0168 | |||
| GPOR / Gulfport Energy Corporation | 0.04 | 7.49 | 0.0989 | 0.0989 | |||||
| BROS / Dutch Bros Inc. | 0.11 | 7.28 | 0.0961 | 0.0961 | |||||
| PAR / PAR Technology Corporation | 0.10 | 7.14 | 0.0943 | 0.0943 | |||||
| INTA / Intapp, Inc. | 0.12 | -35.84 | 6.38 | -43.26 | 0.0842 | -0.0780 | |||
| FOLD / Amicus Therapeutics, Inc. | 0.83 | 35.95 | 4.77 | -4.52 | 0.0630 | -0.0091 | |||
| SLP / Simulations Plus, Inc. | 0.27 | 4.69 | 0.0619 | 0.0619 | |||||
| CHEF / The Chefs' Warehouse, Inc. | 0.07 | -66.56 | 4.37 | -60.82 | 0.0577 | -0.1032 | |||
| PI / Impinj, Inc. | 0.04 | 3.97 | 0.0525 | 0.0525 | |||||
| MSFT / Microsoft Corporation | 0.00 | -2.34 | 1.23 | 29.46 | 0.0162 | 0.0025 | |||
| NVDD / Direxion Shares ETF Trust - Direxion Daily NVDA Bear 1X Shares | 0.01 | 0.00 | 1.10 | 45.68 | 0.0145 | 0.0036 | |||
| TSM / Taiwan Semiconductor Manufacturing Company Limited - Depositary Receipt (Common Stock) | 0.00 | 0.00 | 0.81 | 36.59 | 0.0107 | 0.0021 | |||
| AMZN / Amazon.com, Inc. | 0.00 | 0.00 | 0.74 | 15.36 | 0.0097 | 0.0005 | |||
| PLTR / Palantir Technologies Inc. | 0.00 | -98.52 | 0.58 | -97.61 | 0.0076 | -0.3405 | |||
| MELI / MercadoLibre, Inc. | 0.00 | 0.00 | 0.56 | 33.98 | 0.0074 | 0.0014 | |||
| META / Meta Platforms, Inc. | 0.00 | 34.54 | 0.52 | 72.19 | 0.0069 | 0.0025 | |||
| CME / CME Group Inc. | 0.00 | 0.00 | 0.34 | 3.63 | 0.0045 | -0.0002 | |||
| GOOGL / Alphabet Inc. | 0.00 | -12.57 | 0.34 | -0.29 | 0.0045 | -0.0004 | |||
| TJX / The TJX Companies, Inc. | 0.00 | 0.00 | 0.33 | 1.56 | 0.0043 | -0.0003 | |||
| RTX / RTX Corporation | 0.00 | 0.00 | 0.31 | 10.11 | 0.0040 | 0.0000 | |||
| ASML / ASML Holding N.V. - Depositary Receipt (Common Stock) | 0.00 | 0.00 | 0.29 | 20.92 | 0.0038 | 0.0004 | |||
| SHOP / Shopify Inc. | 0.00 | 0.26 | 0.0034 | 0.0034 | |||||
| SPGI / S&P Global Inc. | 0.00 | 0.00 | 0.25 | 4.10 | 0.0034 | -0.0002 | |||
| ISRG / Intuitive Surgical, Inc. | 0.00 | 0.00 | 0.25 | 10.04 | 0.0033 | 0.0000 | |||
| GLOB / Globant S.A. | 0.00 | -100.00 | 0.00 | 0.0000 | |||||
| NEOG / Neogen Corporation | 0.00 | -100.00 | 0.00 | 0.0000 |