Mga Batayang Estadistika
| Pemilik Institusional | 164 total, 164 long only, 0 short only, 0 long/short - change of -4.07% MRQ |
| Alokasi Portofolio Rata-rata | 0.1232 % - change of -8.20% MRQ |
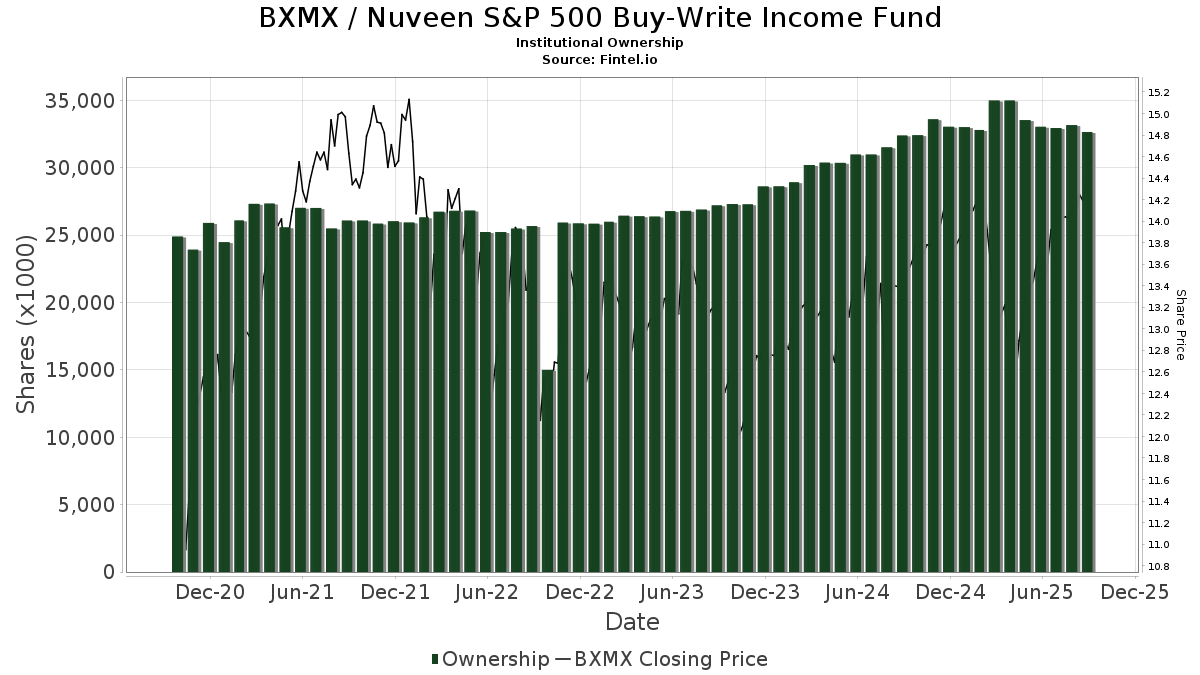
| Saham Institusional (Jangka Panjang) | 32,658,930 (ex 13D/G) - change of -0.30MM shares -0.91% MRQ |
| Nilai Institusional (Jangka Panjang) | $ 433,203 USD ($1000) |
Kepemilikan Institusional dan Pemegang Saham
Nuveen S&P 500 Buy-Write Income Fund (US:BXMX) memiliki 164 pemilik institusional dan pemegang saham yang telah mengajukan formulir 13D/G atau 13F kepada Komisi Bursa Efek (Securities Exchange Commission/SEC). Lembaga-lembaga ini memegang total 32,658,930 saham. Pemegang saham terbesar meliputi Morgan Stanley, Wells Fargo & Company/mn, LPL Financial LLC, Invesco Ltd., UBS Group AG, PCEF - Invesco CEF Income Composite ETF, Raymond James Financial Inc, Advisors Asset Management, Inc., Allspring Global Investments Holdings, LLC, and Bank Of America Corp /de/ .
Struktur kepemilikan institusional Nuveen S&P 500 Buy-Write Income Fund (NYSE:BXMX) menunjukkan posisi terkini di perusahaan oleh institusi dan dana, serta perubahan terbaru dalam ukuran posisi. Pemegang saham utama dapat mencakup investor individu, reksa dana, dana lindung nilai, atau institusi. Jadwal 13D menunjukkan bahwa investor memegang (atau pernah memegang) lebih dari 5% saham perusahaan dan bermaksud (atau pernah bermaksud) untuk secara aktif mengejar perubahan strategi bisnis. Jadwal 13G menunjukkan investasi pasif lebih dari 5%.
The share price as of September 5, 2025 is 14.27 / share. Previously, on September 6, 2024, the share price was 13.19 / share. This represents an increase of 8.19% over that period.
Skor Sentimen Dana
Skor Sentimen Dana (sebelumnya dikenal sebagai Skor Akumulasi Kepemilikan) menemukan saham-saham yang paling banyak dibeli oleh dana. Ini adalah hasil dari model kuantitatif multi-faktor yang canggih yang mengidentifikasi perusahaan dengan tingkat akumulasi institusional tertinggi. Model penilaian menggunakan kombinasi dari total peningkatan pemilik yang diungkapkan, perubahan dalam alokasi portofolio pada pemilik tersebut, dan metrik lainnya. Angka berkisar dari 0 hingga 100, dengan angka yang lebih tinggi menunjukkan tingkat akumulasi yang lebih tinggi dibandingkan dengan perusahaan sejenisnya, dan 50 adalah rata-ratanya.
Frekuensi Pembaruan: Setiap Hari
Lihat Ownership Explorer, yang menyediakan daftar perusahaan dengan peringkat tertinggi.
Rasio Put/Call Institusional
Selain melaporkan isu ekuitas dan utang standar, institusi dengan aset di bawah manajemen lebih dari 100 juta dolar AS juga harus mengungkapkan kepemilikan opsi put dan call mereka. Karena opsi put umumnya menunjukkan sentimen negatif, dan opsi call menunjukkan sentimen positif, kita dapat mengetahui sentimen institusional secara keseluruhan dengan memplot rasio put terhadap call. Grafik di sebelah kanan memplot rasio put/call historis untuk instrumen ini.
Menggunakan Rasio Put/Call sebagai indikator sentimen investor mengatasi salah satu kekurangan utama dari penggunaan total kepemilikan institusional, yaitu sejumlah besar aset yang dikelola diinvestasikan secara pasif untuk melacak indeks. Dana yang dikelola secara pasif biasanya tidak membeli opsi, sehingga indikator rasio put/call lebih akurat dalam melacak sentimen dana yang dikelola secara aktif.
Pengajuan 13F dan NPORT
Detail pada pengajuan 13F tersedia gratis. Detail pada pengajuan NP memerlukan keanggotaan premium. Baris berwarna hijau menunjukkan posisi baru. Baris berwarna merah menunjukkan posisi yang sudah ditutup. Klik tautan ini ikon untuk melihat riwayat transaksi selengkapnya.
Tingkatkan
untuk membuka data premium dan mengekspor ke Excel ![]() .
.
| Tanggal File | Sumber | Investor | Ketik | Presyo ng Avg (Silangan) |
Saham | Δ Saham (%) |
Dilaporkan Nilai ($1000) |
Nilai Δ (%) |
Alokasi Port (%) |
|
|---|---|---|---|---|---|---|---|---|---|---|
| 2025-07-15 | 13F | World Equity Group, Inc. | 26,750 | 102.65 | 371 | 114.45 | ||||
| 2025-07-10 | 13F | Oliver Lagore Vanvalin Investment Group | 9,597 | 0.00 | 126 | -6.72 | ||||
| 2025-08-14 | 13F | Hilltop Holdings Inc. | 39,598 | -11.90 | 550 | -6.79 | ||||
| 2025-08-18 | 13F | Hollencrest Capital Management | 8,609 | 0.00 | 119 | 6.25 | ||||
| 2025-07-16 | 13F | Signaturefd, Llc | 2,511 | 35 | ||||||
| 2025-08-14 | 13F | Polar Asset Management Partners Inc. | 156,696 | 2,175 | ||||||
| 2025-07-16 | 13F | Twelve Points Wealth Management LLC | 432,690 | 4.27 | 6,006 | 10.30 | ||||
| 2025-08-12 | 13F | Wealth Dimensions Group, Ltd. | 10,943 | -10.69 | 152 | -5.62 | ||||
| 2025-07-24 | 13F | IFP Advisors, Inc | 5,200 | -7.14 | 72 | -1.37 | ||||
| 2025-07-29 | 13F | International Assets Investment Management, Llc | 47,367 | 10.33 | 657 | 16.70 | ||||
| 2025-08-14 | 13F | GWM Advisors LLC | 87,831 | 102.31 | 1,219 | 114.24 | ||||
| 2025-08-11 | 13F | Delta Asset Management Llc/tn | 1,800 | 0.00 | 25 | 4.35 | ||||
| 2025-03-12 | 13F/A | Private Capital Management Llc | 0 | -100.00 | 0 | |||||
| 2025-08-12 | 13F | Advisors Asset Management, Inc. | 927,730 | 18.19 | 12,877 | 25.03 | ||||
| 2025-08-07 | 13F | BOK Financial Private Wealth, Inc. | 1,957 | 0.00 | 28 | 3.85 | ||||
| 2025-08-14 | 13F | Apriem Advisors | 17,968 | 0.00 | 249 | 5.96 | ||||
| 2025-07-17 | 13F | Janney Montgomery Scott LLC | 269,380 | 27.32 | 4 | 50.00 | ||||
| 2025-08-06 | 13F | Maltin Wealth Management, Inc. | 18,291 | 1.72 | 254 | 7.66 | ||||
| 2025-07-25 | 13F | Hazlett, Burt & Watson, Inc. | 7,594 | -21.89 | 0 | |||||
| 2025-07-23 | 13F | Joel Isaacson & Co., LLC | 0 | -100.00 | 0 | |||||
| 2025-07-24 | 13F | Costello Asset Management, INC | 100 | 0.00 | 1 | 0.00 | ||||
| 2025-08-14 | 13F | Mml Investors Services, Llc | 17,905 | 5.32 | 0 | |||||
| 2025-08-07 | 13F | Readystate Asset Management Lp | 0 | -100.00 | 0 | |||||
| 2025-08-08 | 13F | Cornerstone Advisors, LLC | 380,684 | -45.66 | 5,284 | -42.52 | ||||
| 2025-08-13 | 13F | StoneX Group Inc. | 26,437 | -20.26 | 373 | -16.03 | ||||
| 2025-07-25 | 13F | Cwm, Llc | 1,748 | 0.00 | 0 | |||||
| 2025-07-08 | 13F | Nbc Securities, Inc. | 28,864 | -0.71 | 0 | |||||
| 2025-07-17 | 13F | Venture Visionary Partners LLC | 52,681 | -3.03 | 731 | 2.67 | ||||
| 2025-08-14 | 13F | Wiley Bros.-aintree Capital, Llc | 87,808 | 67.66 | 1,219 | 78.59 | ||||
| 2025-07-29 | 13F | Hoese & Co LLP | 875 | -50.00 | 12 | -45.45 | ||||
| 2025-08-01 | 13F | Envestnet Asset Management Inc | 167,022 | -4.50 | 2,318 | 1.05 | ||||
| 2025-08-13 | 13F | Kayne Anderson Rudnick Investment Management Llc | 465 | 0.00 | 6 | 0.00 | ||||
| 2025-08-12 | 13F | Steward Partners Investment Advisory, Llc | 50,446 | 1.03 | 700 | 6.87 | ||||
| 2025-08-14 | 13F | Two Sigma Investments, Lp | 169,380 | 2,351 | ||||||
| 2025-08-13 | 13F | Global Endowment Management, LP | 0 | -100.00 | 0 | |||||
| 2025-05-08 | 13F | Plante Moran Financial Advisors, LLC | 0 | -100.00 | 0 | |||||
| 2025-04-29 | 13F | Pensionmark Financial Group, Llc | 0 | -100.00 | 0 | |||||
| 2025-08-12 | 13F | LPL Financial LLC | 1,629,051 | 0.85 | 22,611 | 6.69 | ||||
| 2025-08-12 | 13F | Proequities, Inc. | 0 | 0 | ||||||
| 2025-08-07 | 13F | Hennion & Walsh Asset Management, Inc. | 104,200 | 99.24 | 1,446 | 110.79 | ||||
| 2025-08-14 | 13F | Royal Bank Of Canada | 479,512 | -3.25 | 6,656 | 2.37 | ||||
| 2025-08-12 | 13F | Pathstone Holdings, LLC | 17,537 | 0.00 | 243 | 5.65 | ||||
| 2025-08-15 | 13F | Kestra Advisory Services, LLC | 74,671 | 11.09 | 1,036 | 17.59 | ||||
| 2025-08-04 | 13F | Carret Asset Management, Llc | 10,000 | 0.00 | 139 | 5.34 | ||||
| 2025-08-15 | 13F | Captrust Financial Advisors | 15,769 | 219 | ||||||
| 2025-08-13 | 13F | Invesco Ltd. | 1,507,507 | -0.41 | 20,924 | 5.36 | ||||
| 2025-07-15 | 13F | Bay Capital Advisors, LLC | 15,950 | 0.00 | 221 | 5.74 | ||||
| 2025-08-15 | 13F | Puff Wealth Management, Llc | 81,552 | 3.15 | 1,132 | 9.06 | ||||
| 2025-08-12 | 13F | Wood Tarver Financial Group, LLC | 21 | 0.00 | 0 | |||||
| 2025-07-25 | 13F | Northwest Capital Management Inc | 978 | 0.00 | 14 | 8.33 | ||||
| 2025-07-31 | 13F | Cambridge Investment Research Advisors, Inc. | 567,331 | 1.63 | 8 | 0.00 | ||||
| 2025-07-25 | 13F | Stephens Consulting, LLC | 0 | -100.00 | 0 | |||||
| 2025-05-12 | 13F | Independent Advisor Alliance | 0 | -100.00 | 0 | -100.00 | ||||
| 2025-08-07 | 13F | Kestra Private Wealth Services, Llc | 18,292 | 5.02 | 254 | 10.96 | ||||
| 2025-08-14 | 13F | Wells Fargo & Company/mn | 1,689,550 | 1.44 | 23,451 | 7.32 | ||||
| 2025-07-28 | 13F | BRYN MAWR TRUST Co | 504 | 0.00 | 7 | 0.00 | ||||
| 2025-03-11 | 13F/A | Elequin Capital Lp | 0 | -100.00 | 0 | |||||
| 2025-07-14 | 13F | Matrix Trust Co | 57,855 | 0.67 | 1 | |||||
| 2025-07-09 | 13F | Triumph Capital Management | 17,432 | 0.00 | 242 | 5.70 | ||||
| 2025-05-15 | 13F | Talon Private Wealth, LLC | 0 | -100.00 | 0 | -100.00 | ||||
| 2025-05-05 | 13F | Lindbrook Capital, Llc | 690,062 | 0.00 | 9,054 | -6.22 | ||||
| 2025-07-14 | 13F | Park Avenue Securities Llc | 122,039 | -4.13 | 2 | 0.00 | ||||
| 2025-08-11 | 13F | Blue Bell Private Wealth Management, Llc | 5,680 | 2.64 | 79 | 8.33 | ||||
| 2025-08-06 | 13F | Commonwealth Equity Services, Llc | 327,849 | -6.20 | 5 | 0.00 | ||||
| 2025-08-07 | 13F | Commerce Bank | 15,819 | 0.00 | 220 | 5.80 | ||||
| 2025-05-06 | 13F | MCF Advisors LLC | 0 | -100.00 | 0 | |||||
| 2025-08-05 | 13F | Bank of New York Mellon Corp | 12,762 | 8.09 | 177 | 14.94 | ||||
| 2025-08-14 | 13F | Susquehanna International Group, Llp | 0 | -100.00 | 0 | |||||
| 2025-07-21 | 13F | Ameritas Advisory Services, LLC | 3,090 | 43 | ||||||
| 2025-08-12 | 13F | Landscape Capital Management, L.l.c. | 0 | -100.00 | 0 | |||||
| 2025-05-08 | 13F | Private Advisory Group LLC | 0 | -100.00 | 0 | |||||
| 2025-08-11 | 13F | Rothschild Investment Llc | 693 | 0.00 | 10 | 0.00 | ||||
| 2025-08-14 | 13F | Atomi Financial Group, Inc. | 77,062 | -5.89 | 1,070 | -0.47 | ||||
| 2025-08-11 | 13F | Citigroup Inc | 2,650 | 0.00 | 37 | 5.88 | ||||
| 2025-08-27 | NP | RYDEX VARIABLE TRUST - Multi-Hedge Strategies Fund Variable Annuity | 230 | -19.30 | 3 | 0.00 | ||||
| 2025-07-15 | 13F | Focused Wealth Management, Inc | 333,887 | 1.57 | 4,634 | 7.47 | ||||
| 2025-08-05 | 13F | Key FInancial Inc | 37 | 0.00 | 1 | |||||
| 2025-07-24 | 13F | Leo Wealth, LLC | 34,991 | 0.00 | 486 | 5.66 | ||||
| 2025-08-14 | 13F | Mariner, LLC | 16,381 | 12.93 | 227 | 19.47 | ||||
| 2025-08-19 | 13F | Newbridge Financial Services Group, Inc. | 1,061 | 15 | ||||||
| 2025-04-15 | 13F | Fiduciary Financial Group, Llc | 0 | -100.00 | 0 | |||||
| 2025-07-28 | NP | PCEF - Invesco CEF Income Composite ETF This fund is a listed as child fund of Invesco Ltd. and if that institution has disclosed ownership in this security, then these positions will not be double counted when calculating total shares and total value | 1,465,087 | -0.51 | 19,735 | -3.24 | ||||
| 2025-08-13 | 13F | Rsm Us Wealth Management Llc | 17,671 | -0.82 | 250 | 5.04 | ||||
| 2025-05-06 | 13F | Venturi Wealth Management, LLC | 0 | -100.00 | 0 | |||||
| 2025-07-22 | 13F | DAVENPORT & Co LLC | 13,927 | 0.00 | 193 | 6.04 | ||||
| 2025-07-30 | 13F | D.a. Davidson & Co. | 48,594 | 0.70 | 674 | 6.48 | ||||
| 2025-08-14 | 13F | UBS Group AG | 1,488,300 | -4.04 | 20,658 | 1.52 | ||||
| 2025-08-04 | 13F | Spire Wealth Management | 37,364 | 10.23 | 519 | 16.67 | ||||
| 2025-08-08 | 13F | Avantax Advisory Services, Inc. | 22,147 | 18.73 | 307 | 25.82 | ||||
| 2025-08-05 | 13F | Prosperity Wealth Management, Inc. | 123,745 | 1.21 | 1,718 | 7.04 | ||||
| 2025-08-06 | 13F | Marco Investment Management Llc | 27,300 | 0.00 | 379 | 5.59 | ||||
| 2025-08-12 | 13F | Founders Financial Alliance, LLC | 12,908 | -0.20 | 179 | 5.92 | ||||
| 2025-08-14 | 13F | Kovitz Investment Group Partners, LLC | 105,731 | 39.30 | 1,468 | 47.54 | ||||
| 2025-08-14 | 13F | Bank Of America Corp /de/ | 823,947 | 2.94 | 11,436 | 8.90 | ||||
| 2025-08-12 | 13F | Armor Investment Advisors, LLC | 19,673 | -0.07 | 273 | 5.81 | ||||
| 2025-07-28 | 13F | Harbour Investments, Inc. | 1,825 | 25 | ||||||
| 2025-08-19 | 13F | National Asset Management, Inc. | 31,119 | -70.37 | 432 | -70.66 | ||||
| 2025-07-29 | 13F | Private Trust Co Na | 2,000 | -12.78 | 28 | -10.00 | ||||
| 2025-07-25 | 13F | Allspring Global Investments Holdings, LLC | 905,057 | 42.10 | 12,562 | 50.34 | ||||
| 2025-07-14 | 13F | Farmers & Merchants Investments Inc | 1,850 | 0.00 | 26 | 4.17 | ||||
| 2025-08-14 | 13F | NCP Inc. | 127,332 | 0.82 | 1,767 | 6.64 | ||||
| 2025-07-29 | 13F | Sims Investment Management, Llc | 60,100 | 0.00 | 834 | 5.84 | ||||
| 2025-08-14 | 13F | Glen Eagle Advisors, LLC | 15,970 | -21.96 | 222 | -17.54 | ||||
| 2025-08-14 | 13F | Cnh Partners Llc | 361,193 | -23.44 | 4,992 | -18.61 | ||||
| 2025-08-13 | 13F | Baird Financial Group, Inc. | 29,808 | -4.34 | 414 | 1.23 | ||||
| 2025-08-05 | 13F | Shaker Financial Services, LLC | 77,595 | -62.94 | 1,106 | -60.77 | ||||
| 2025-08-13 | 13F | Colonial Trust Co / SC | 254 | 0.00 | 3 | 0.00 | ||||
| 2025-08-04 | 13F | Horizon Wealth Management, LLC | 11,660 | 0.00 | 162 | 5.92 | ||||
| 2025-07-16 | 13F | St Germain D J Co Inc | 187 | 0.00 | 3 | 0.00 | ||||
| 2025-08-13 | 13F | Colonial Trust Advisors | 2,200 | 31 | ||||||
| 2025-08-27 | NP | RYMSX - Guggenheim Multi-Hedge Strategies Fund Class P | 137 | -37.44 | 2 | -50.00 | ||||
| 2025-08-11 | 13F | Annis Gardner Whiting Capital Advisors, LLC | 3,000 | 0.00 | 42 | 5.13 | ||||
| 2025-08-12 | 13F | CIBC Private Wealth Group, LLC | 33 | 0.00 | 0 | |||||
| 2025-08-18 | 13F | Arq Wealth Advisors, Llc | 0 | -100.00 | 0 | |||||
| 2025-08-05 | 13F | Sage Capital Management, LLC | 255,095 | 2.35 | 3,541 | 8.26 | ||||
| 2025-08-12 | 13F | Coldstream Capital Management Inc | 0 | -100.00 | 0 | |||||
| 2025-08-06 | 13F | SOUTH STATE Corp | 978 | 0.00 | 14 | 8.33 | ||||
| 2025-07-25 | 13F | Integrated Capital Management, Inc. | 23,069 | 2.70 | 320 | 8.84 | ||||
| 2025-08-11 | 13F | Nations Financial Group Inc, /ia/ /adv | 20,877 | -6.92 | 290 | -1.70 | ||||
| 2025-08-14 | 13F | Wealth Preservation Advisors, LLC | 7,655 | 0.00 | 106 | 6.00 | ||||
| 2025-08-05 | 13F | Huntington National Bank | 35 | 0.00 | ||||||
| 2025-07-15 | 13F | Financial Management Professionals, Inc. | 314 | 0.00 | 4 | 0.00 | ||||
| 2025-08-04 | 13F | Kovack Advisors, Inc. | 12,778 | -3.77 | 177 | 1.72 | ||||
| 2025-04-22 | 13F | Castleview Partners, Llc | 0 | -100.00 | 0 | |||||
| 2025-07-24 | 13F | Us Bancorp \de\ | 5,000 | 0.00 | 69 | 6.15 | ||||
| 2025-07-18 | 13F | Truist Financial Corp | 41,249 | -0.07 | 573 | 5.73 | ||||
| 2025-07-07 | 13F | Bangor Savings Bank | 1,057 | -45.99 | 15 | -44.00 | ||||
| 2025-08-13 | 13F | Summit Financial, LLC | 26,414 | 116.45 | 373 | 133.13 | ||||
| 2025-08-06 | 13F | Prospera Financial Services Inc | 100,783 | 1.49 | 1,399 | 7.37 | ||||
| 2025-07-08 | 13F | Apella Capital, LLC | 15,035 | 0.00 | 209 | 8.33 | ||||
| 2025-07-21 | 13F | Pflug Koory, LLC | 33,682 | 0.00 | 468 | 5.90 | ||||
| 2025-07-17 | 13F | Jackson, Grant Investment Advisers, Inc. | 31,103 | 1.49 | 432 | 7.21 | ||||
| 2025-08-14 | 13F | Ameriprise Financial Inc | 313,236 | -21.45 | 4,334 | -17.17 | ||||
| 2025-08-20 | NP | ADANX - AQR Diversified Arbitrage Fund Class N | 119,046 | -13.55 | 1,652 | -8.53 | ||||
| 2025-08-06 | 13F | Moors & Cabot, Inc. | 73,052 | -44.65 | 1,014 | -41.48 | ||||
| 2025-08-08 | 13F | Cetera Investment Advisers | 153,547 | 8.89 | 2,131 | 15.19 | ||||
| 2025-08-18 | 13F | Geneos Wealth Management Inc. | 9,252 | -1.76 | 128 | 4.07 | ||||
| 2025-07-08 | 13F | Arlington Trust Co LLC | 6,000 | 0.00 | 83 | 6.41 | ||||
| 2025-07-23 | 13F | Tyche Wealth Partners LLC | 25,640 | 0.07 | 356 | 5.65 | ||||
| 2025-08-14 | 13F | CoreFirst Bank & Trust | 930 | 13 | ||||||
| 2025-08-22 | NP | Cornerstone Total Return Fund Inc | 87,486 | -63.05 | 1,214 | -60.91 | ||||
| 2025-07-16 | 13F | Encompass Wealth Advisors, Llc | 14,207 | -37.20 | 197 | -33.45 | ||||
| 2025-04-23 | 13F | Continuum Advisory, LLC | 0 | -100.00 | 0 | |||||
| 2025-08-13 | 13F | Northwestern Mutual Wealth Management Co | 47,387 | 3.15 | 658 | 9.14 | ||||
| 2025-05-15 | 13F | Gwn Securities Inc. | 0 | -100.00 | 0 | |||||
| 2025-08-14 | 13F | Raymond James Financial Inc | 951,409 | -0.65 | 13,206 | 5.11 | ||||
| 2025-08-07 | 13F | Allworth Financial LP | 36,858 | 244.79 | 512 | 278.52 | ||||
| 2025-08-11 | 13F | HighTower Advisors, LLC | 37,334 | -13.43 | 518 | -8.32 | ||||
| 2025-07-07 | 13F | Centurion Wealth Management LLC | 12,318 | 0.00 | 171 | -1.16 | ||||
| 2025-07-10 | 13F | Global Financial Private Client, LLC | 0 | -100.00 | 0 | |||||
| 2025-07-29 | 13F | Commons Capital, Llc | 15,127 | 1.34 | 210 | 7.18 | ||||
| 2025-07-24 | 13F | Eastern Bank | 2,199 | 0.00 | 31 | 7.14 | ||||
| 2025-08-11 | 13F | Alteri Wealth LLC | 47,955 | 10.48 | 666 | 16.87 | ||||
| 2025-06-04 | 13F | Pvg Asset Management Corp | 0 | -100.00 | 0 | |||||
| 2025-07-01 | 13F | Harbor Investment Advisory, Llc | 2,468 | 0.00 | 34 | 6.25 | ||||
| 2025-07-25 | 13F | Atria Wealth Solutions, Inc. | 14,914 | -69.25 | 211 | -67.34 | ||||
| 2025-07-21 | 13F | Patriot Financial Group Insurance Agency, LLC | 27,630 | 0.93 | 384 | 6.69 | ||||
| 2025-08-08 | 13F | Pnc Financial Services Group, Inc. | 32,256 | 29.21 | 448 | 36.70 | ||||
| 2025-05-14 | 13F | ICONIQ Capital, LLC | 0 | -100.00 | 0 | |||||
| 2025-07-16 | 13F | Investment Partners Asset Management, Inc. | 37,219 | -0.24 | 517 | 5.52 | ||||
| 2025-08-08 | 13F | Fortis Group Advisors, LLC | 250 | 0.00 | 3 | 0.00 | ||||
| 2025-08-14 | 13F/A | Rockefeller Capital Management L.P. | 34,524 | 1.75 | 479 | 7.64 | ||||
| 2025-04-25 | 13F | Smallwood Wealth Investment Management, LLC | 4,027 | 53 | ||||||
| 2025-08-13 | 13F | MONECO Advisors, LLC | 257,967 | -2.18 | 3,581 | 3.50 | ||||
| 2025-08-12 | 13F | Bokf, Na | 0 | -100.00 | 0 | |||||
| 2025-08-12 | 13F | Richmond Investment Services, LLC | 114,171 | 95.73 | 1,585 | 107.06 | ||||
| 2025-05-08 | 13F | Essential Planning, LLC. | 0 | -100.00 | 0 | |||||
| 2025-05-07 | 13F | Sheaff Brock Investment Advisors, LLC | 13,188 | -0.08 | 173 | -5.98 | ||||
| 2025-09-04 | 13F/A | Advisor Group Holdings, Inc. | 380,959 | 3.05 | 5,288 | 9.03 | ||||
| 2025-08-14 | 13F | Quantedge Capital Pte Ltd | 0 | -100.00 | 0 | |||||
| 2025-07-18 | 13F | TPG Advisors LLC | 138,713 | -0.49 | 1,925 | 5.31 | ||||
| 2025-08-05 | 13F | Palogic Value Management, L.P. | 21,371 | -2.29 | 297 | 3.50 | ||||
| 2025-05-06 | 13F | Atria Investments Llc | 0 | -100.00 | 0 | |||||
| 2025-07-15 | 13F | Shulman DeMeo Asset Management LLC | 96,095 | -0.12 | 1,334 | 5.63 | ||||
| 2025-07-11 | 13F | Pinnacle Bancorp, Inc. | 2,895 | 40 | ||||||
| 2025-08-08 | 13F | Creative Planning | 0 | -100.00 | 0 | |||||
| 2025-08-11 | 13F | WPG Advisers, LLC | 683 | -35.63 | 9 | -30.77 | ||||
| 2025-08-13 | 13F | Green Harvest Asset Management LLC | 15,760 | 0.00 | 219 | 5.83 | ||||
| 2025-08-08 | 13F | Islay Capital Management, Llc | 76,317 | -4.91 | 1,059 | 0.67 | ||||
| 2025-08-14 | 13F | Comerica Bank | 92,866 | 3.05 | 1,289 | 8.97 | ||||
| 2025-08-14 | 13F | CoreCap Advisors, LLC | 20,656 | 55.19 | 287 | 64.37 | ||||
| 2025-06-12 | 13F/A | Deutsche Bank Ag\ | 0 | -100.00 | 0 | |||||
| 2025-08-14 | 13F | Great Valley Advisor Group, Inc. | 0 | -100.00 | 0 | |||||
| 2025-08-14 | 13F | Wetherby Asset Management Inc | 26,302 | 109.85 | 365 | 108.57 | ||||
| 2025-04-16 | 13F | Fortitude Family Office, LLC | 0 | -100.00 | 0 | |||||
| 2025-08-12 | 13F | Jpmorgan Chase & Co | 2,528 | 4.08 | 35 | 12.90 | ||||
| 2025-08-13 | 13F | Guggenheim Capital Llc | 723,627 | 8.17 | 10,044 | 14.44 | ||||
| 2025-05-02 | 13F | Legacy Capital Wealth Partners, LLC | 0 | -100.00 | 0 | -100.00 | ||||
| 2025-08-14 | 13F | Stifel Financial Corp | 302,608 | 7.54 | 4,200 | 13.79 | ||||
| 2025-07-30 | 13F | FNY Investment Advisers, LLC | 5,000 | 0.00 | 0 | |||||
| 2025-08-14 | 13F | Jane Street Group, Llc | 0 | -100.00 | 0 | |||||
| 2025-08-15 | 13F | Morgan Stanley | 11,835,003 | 2.03 | 164,270 | 7.94 | ||||
| 2025-08-04 | 13F | Wolverine Asset Management Llc | 0 | -100.00 | 0 | |||||
| 2025-07-16 | 13F | Instrumental Wealth, Llc | 25,251 | 5.92 | 353 | 15.41 | ||||
| 2025-08-14 | 13F | Colony Group, LLC | 30,143 | 21.39 | 418 | 28.62 | ||||
| 2025-07-30 | 13F | Patten Group, Inc. | 58,215 | -0.73 | 808 | 5.07 | ||||
| 2025-07-31 | 13F | Blake Schutter Theil Wealth Advisors, LLC | 68,604 | 0.24 | 952 | 6.13 | ||||
| 2025-08-07 | 13F | Clarity Wealth Advisors, LLC | 10,091 | -17.10 | 140 | -11.95 | ||||
| 2025-07-11 | 13F | Farther Finance Advisors, LLC | 3,600 | 380.00 | 50 | 444.44 | ||||
| 2025-07-23 | 13F | Ameliora Wealth Management Ltd. | 200 | 0.00 | 3 | 0.00 | ||||
| 2025-08-22 | NP | Cornerstone Strategic Value Fund Inc | 293,198 | -36.79 | 4,070 | -33.13 |