Mga Batayang Estadistika
| Pemilik Institusional | 124 total, 124 long only, 0 short only, 0 long/short - change of 0.00% MRQ |
| Alokasi Portofolio Rata-rata | 0.0813 % - change of 28.76% MRQ |
| Saham Institusional (Jangka Panjang) | 7,376,713 (ex 13D/G) - change of 0.16MM shares 2.25% MRQ |
| Nilai Institusional (Jangka Panjang) | $ 380,419 USD ($1000) |
Kepemilikan Institusional dan Pemegang Saham
ALPS ETF Trust - ALPS | O'Shares U.S. Quality Dividend ETF (US:OUSA) memiliki 124 pemilik institusional dan pemegang saham yang telah mengajukan formulir 13D/G atau 13F kepada Komisi Bursa Efek (Securities Exchange Commission/SEC). Lembaga-lembaga ini memegang total 7,376,713 saham. Pemegang saham terbesar meliputi Morgan Stanley, LPL Financial LLC, Thurston, Springer, Miller, Herd & Titak, Inc., Ameriprise Financial Inc, Bank Of America Corp /de/, Wells Fargo & Company/mn, Royal Bank Of Canada, Raymond James Financial Inc, We Are One Seven, LLC, and Kestra Advisory Services, LLC .
Struktur kepemilikan institusional ALPS ETF Trust - ALPS | O'Shares U.S. Quality Dividend ETF (BATS:OUSA) menunjukkan posisi terkini di perusahaan oleh institusi dan dana, serta perubahan terbaru dalam ukuran posisi. Pemegang saham utama dapat mencakup investor individu, reksa dana, dana lindung nilai, atau institusi. Jadwal 13D menunjukkan bahwa investor memegang (atau pernah memegang) lebih dari 5% saham perusahaan dan bermaksud (atau pernah bermaksud) untuk secara aktif mengejar perubahan strategi bisnis. Jadwal 13G menunjukkan investasi pasif lebih dari 5%.
The share price as of September 5, 2025 is 56.23 / share. Previously, on September 6, 2024, the share price was 51.49 / share. This represents an increase of 9.21% over that period.

Skor Sentimen Dana
Skor Sentimen Dana (sebelumnya dikenal sebagai Skor Akumulasi Kepemilikan) menemukan saham-saham yang paling banyak dibeli oleh dana. Ini adalah hasil dari model kuantitatif multi-faktor yang canggih yang mengidentifikasi perusahaan dengan tingkat akumulasi institusional tertinggi. Model penilaian menggunakan kombinasi dari total peningkatan pemilik yang diungkapkan, perubahan dalam alokasi portofolio pada pemilik tersebut, dan metrik lainnya. Angka berkisar dari 0 hingga 100, dengan angka yang lebih tinggi menunjukkan tingkat akumulasi yang lebih tinggi dibandingkan dengan perusahaan sejenisnya, dan 50 adalah rata-ratanya.
Frekuensi Pembaruan: Setiap Hari
Lihat Ownership Explorer, yang menyediakan daftar perusahaan dengan peringkat tertinggi.
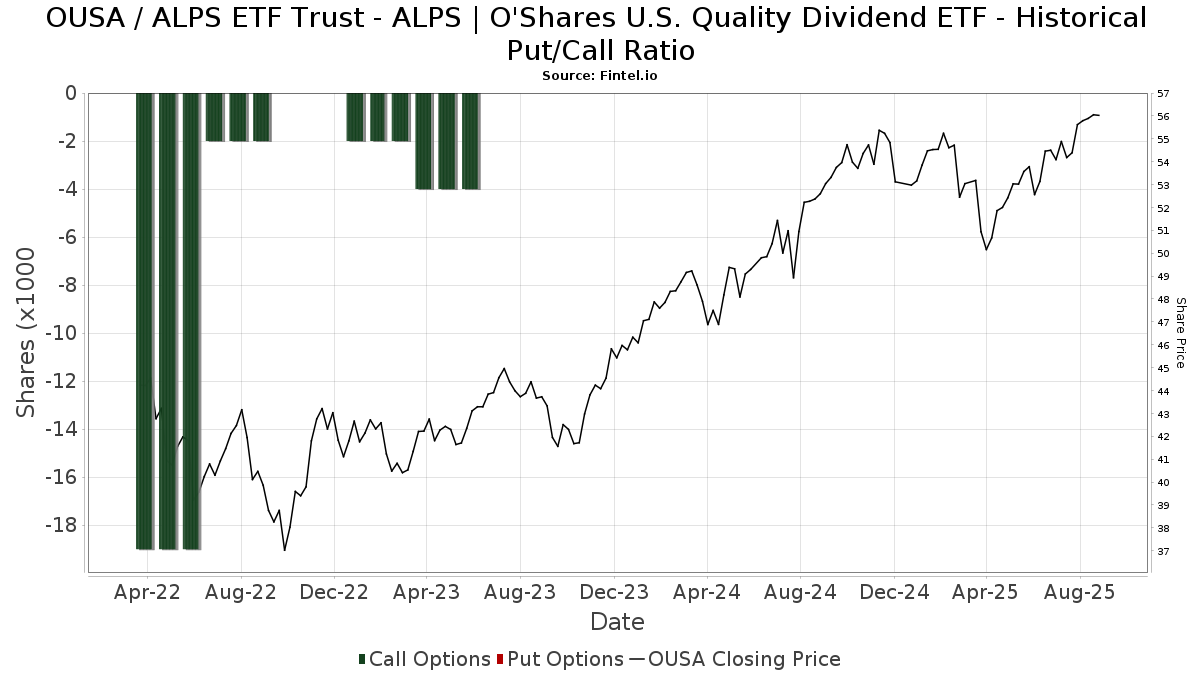
Rasio Put/Call Institusional
Selain melaporkan isu ekuitas dan utang standar, institusi dengan aset di bawah manajemen lebih dari 100 juta dolar AS juga harus mengungkapkan kepemilikan opsi put dan call mereka. Karena opsi put umumnya menunjukkan sentimen negatif, dan opsi call menunjukkan sentimen positif, kita dapat mengetahui sentimen institusional secara keseluruhan dengan memplot rasio put terhadap call. Grafik di sebelah kanan memplot rasio put/call historis untuk instrumen ini.
Menggunakan Rasio Put/Call sebagai indikator sentimen investor mengatasi salah satu kekurangan utama dari penggunaan total kepemilikan institusional, yaitu sejumlah besar aset yang dikelola diinvestasikan secara pasif untuk melacak indeks. Dana yang dikelola secara pasif biasanya tidak membeli opsi, sehingga indikator rasio put/call lebih akurat dalam melacak sentimen dana yang dikelola secara aktif.
Pengajuan 13F dan NPORT
Detail pada pengajuan 13F tersedia gratis. Detail pada pengajuan NP memerlukan keanggotaan premium. Baris berwarna hijau menunjukkan posisi baru. Baris berwarna merah menunjukkan posisi yang sudah ditutup. Klik tautan ini ikon untuk melihat riwayat transaksi selengkapnya.
Tingkatkan
untuk membuka data premium dan mengekspor ke Excel ![]() .
.
| Tanggal File | Sumber | Investor | Ketik | Presyo ng Avg (Silangan) |
Saham | Δ Saham (%) |
Dilaporkan Nilai ($1000) |
Nilai Δ (%) |
Alokasi Port (%) |
|
|---|---|---|---|---|---|---|---|---|---|---|
| 2025-08-14 | 13F | GWM Advisors LLC | 62,761 | 0.12 | 3,387 | 1.56 | ||||
| 2025-08-11 | 13F | Principal Securities, Inc. | 524 | 0.00 | 28 | 3.70 | ||||
| 2025-04-16 | 13F | NorthCrest Asset Manangement, LLC | 0 | -100.00 | 0 | |||||
| 2025-08-14 | 13F | Comerica Bank | 2,884 | -1.70 | 156 | -0.64 | ||||
| 2025-07-25 | 13F | Sovereign Financial Group, Inc. | 23,286 | 2.88 | 1,257 | 4.32 | ||||
| 2025-07-28 | 13F | WealthPlan Investment Management, LLC | 35,623 | 4.34 | 1,923 | 5.84 | ||||
| 2025-08-12 | 13F | Atlas Capital Advisors Llc | 8,183 | 9.35 | 442 | 10.80 | ||||
| 2025-08-15 | 13F | Tower Research Capital LLC (TRC) | 5,111 | -48.66 | 276 | -48.02 | ||||
| 2025-07-16 | 13F | Signaturefd, Llc | 25 | -10.71 | 1 | 0.00 | ||||
| 2025-07-30 | 13F | Whittier Trust Co Of Nevada Inc | 1,000 | 0.00 | 54 | 0.00 | ||||
| 2025-08-13 | 13F | Russell Investments Group, Ltd. | 37 | 0.00 | 2 | 0.00 | ||||
| 2025-08-12 | 13F | O'shaughnessy Asset Management, Llc | 92 | 0.00 | 5 | 0.00 | ||||
| 2025-08-12 | 13F | Archer Investment Corp | 148 | 0.00 | 8 | 0.00 | ||||
| 2025-08-14 | 13F | Win Advisors, Inc | 0 | -100.00 | 0 | |||||
| 2025-08-14 | 13F | Royal Bank Of Canada | 326,911 | -2.55 | 17,643 | -1.18 | ||||
| 2025-08-14 | 13F | Two Sigma Investments, Lp | 18,900 | 1,020 | ||||||
| 2025-08-14 | 13F | Wells Fargo & Company/mn | 337,349 | -3.23 | 18,207 | -1.87 | ||||
| 2025-07-25 | 13F | Cwm, Llc | 300 | 0.00 | 0 | |||||
| 2025-08-11 | 13F | Private Advisor Group, LLC | 84,384 | -2.69 | 4,554 | -1.30 | ||||
| 2025-08-14 | 13F | Atomi Financial Group, Inc. | 10,726 | 5.61 | 579 | 7.04 | ||||
| 2025-07-16 | 13F | ORG Partners LLC | 3,838 | 0.37 | 210 | 2.96 | ||||
| 2025-08-08 | 13F | Compass Financial Services Inc | 187 | 0.00 | 10 | 11.11 | ||||
| 2025-04-30 | 13F | Sofos Investments, Inc. | 376 | 20 | ||||||
| 2025-07-25 | 13F | Hobbs Group Advisors, LLC | 4,127 | 1.88 | 223 | 3.26 | ||||
| 2025-08-05 | 13F | Fourth Dimension Wealth, LLC | 1,150 | 0.00 | 62 | 1.64 | ||||
| 2025-07-08 | 13F | Next Level Private LLC | 4,641 | 0.00 | 250 | 1.63 | ||||
| 2025-07-31 | 13F | Optimum Investment Advisors | 303 | 0.00 | 16 | 0.00 | ||||
| 2025-08-14 | 13F | Ameriprise Financial Inc | 454,805 | 9.65 | 24,520 | 11.11 | ||||
| 2025-08-14 | 13F | Goldman Sachs Group Inc | 57,539 | 1.52 | 3,105 | 2.95 | ||||
| 2025-08-12 | 13F | J.w. Cole Advisors, Inc. | 7,278 | 1.06 | 393 | 2.35 | ||||
| 2025-08-12 | 13F | Steward Partners Investment Advisory, Llc | 7,170 | 0.00 | 387 | 1.31 | ||||
| 2025-08-15 | 13F | Kestra Advisory Services, LLC | 245,610 | 4.64 | 13,256 | 6.12 | ||||
| 2025-07-17 | 13F | Grandview Asset Management LLC | 12,159 | -2.74 | 1 | |||||
| 2025-07-30 | 13F | Princeton Global Asset Management LLC | 424 | 0.00 | 23 | 0.00 | ||||
| 2025-07-31 | 13F | Cambridge Investment Research Advisors, Inc. | 6,382 | -29.37 | 0 | |||||
| 2025-08-19 | 13F | Newbridge Financial Services Group, Inc. | 10,726 | 579 | ||||||
| 2025-08-05 | 13F | Bank Of Montreal /can/ | 91 | 0.00 | 5 | 0.00 | ||||
| 2025-08-14 | 13F | Acas, Llc | 4,709 | 0.00 | 262 | 7.41 | ||||
| 2025-07-18 | 13F | TruNorth Capital Management, LLC | 418 | 0.48 | 23 | 0.00 | ||||
| 2025-08-14 | 13F | Integrated Wealth Concepts LLC | 6,854 | -4.74 | 370 | -3.40 | ||||
| 2025-07-08 | 13F/A | Salem Investment Counselors Inc | 1,350 | 8.00 | 73 | 9.09 | ||||
| 2025-07-22 | 13F | Beacon Financial Advisory LLC | 6,608 | 0.38 | 357 | 1.71 | ||||
| 2025-07-18 | 13F | USA Financial Portformulas Corp | 9,934 | 536 | ||||||
| 2025-08-08 | 13F | TD Capital Management LLC | 662 | 0.00 | 36 | 0.00 | ||||
| 2025-08-14 | 13F | Susquehanna International Group, Llp | 6,029 | -70.12 | 325 | -69.71 | ||||
| 2025-07-17 | 13F | Janney Montgomery Scott LLC | 169,186 | 21.11 | 9 | 28.57 | ||||
| 2025-08-13 | 13F | Northwestern Mutual Wealth Management Co | 5,213 | -5.24 | 281 | -3.77 | ||||
| 2025-07-15 | 13F | Capstone Wealth Management Group LLC | 5,330 | 288 | ||||||
| 2025-08-13 | 13F | Mount Yale Investment Advisors, LLC | 4 | 0 | ||||||
| 2025-05-01 | 13F | Quest 10 Wealth Builders, Inc. | 126 | 0.00 | 7 | 0.00 | ||||
| 2025-05-15 | 13F | Advisory Services Network, LLC | 0 | -100.00 | 0 | |||||
| 2025-07-07 | 13F | Park Edge Advisors, LLC | 21,500 | 7.38 | 1,160 | 8.92 | ||||
| 2025-07-28 | 13F | Mutual Advisors, LLC | 5,091 | 0.02 | 279 | 7.31 | ||||
| 2025-08-06 | 13F | AE Wealth Management LLC | 2,405 | 0.00 | 130 | 1.57 | ||||
| 2025-05-14 | 13F | Van Hulzen Asset Management, LLC | 0 | -100.00 | 0 | -100.00 | ||||
| 2025-08-05 | 13F | Sigma Planning Corp | 11,223 | 0.09 | 606 | 1.51 | ||||
| 2025-07-08 | 13F | Nbc Securities, Inc. | 919 | 0.33 | 0 | |||||
| 2025-07-15 | 13F | Fifth Third Bancorp | 140 | 0.00 | 8 | 0.00 | ||||
| 2025-08-11 | 13F | Citigroup Inc | 1 | 0.00 | 0 | |||||
| 2025-07-24 | 13F | Capital Advisors, Ltd. LLC | 15,969 | 0.08 | 1 | |||||
| 2025-07-14 | 13F | Park Avenue Securities Llc | 9,245 | 0 | ||||||
| 2025-08-14 | 13F | Avant Capital LLC | 32,794 | 3.97 | 1,770 | 5.42 | ||||
| 2025-08-15 | 13F | Morgan Stanley | 1,543,151 | 4.33 | 83,284 | 5.80 | ||||
| 2025-05-15 | 13F | Guardian Wealth Advisors, Llc / Nc | 0 | -100.00 | 0 | |||||
| 2025-07-07 | 13F | Thurston, Springer, Miller, Herd & Titak, Inc. | 521,180 | 12.13 | 28,128 | 13.71 | ||||
| 2025-08-12 | 13F | MAI Capital Management | 117 | 0.86 | 6 | 0.00 | ||||
| 2025-08-14 | 13F | Wiley Bros.-aintree Capital, Llc | 140,277 | -1.59 | 7,571 | 0.99 | ||||
| 2025-08-11 | 13F | NewEdge Wealth, LLC | 6,848 | -1.07 | 372 | 0.82 | ||||
| 2025-07-15 | 13F | Mather Group, Llc. | 0 | -100.00 | 0 | |||||
| 2025-08-14 | 13F | Glen Eagle Advisors, LLC | 322 | 0.31 | 17 | 0.00 | ||||
| 2025-08-14 | 13F | Fmr Llc | 4,324 | -7.74 | 233 | -6.43 | ||||
| 2025-08-12 | 13F | Global Retirement Partners, LLC | 0 | -100.00 | 0 | |||||
| 2025-07-23 | 13F | High Note Wealth, LLC | 1,793 | -10.04 | 97 | -9.43 | ||||
| 2025-07-29 | 13F | Stratos Wealth Partners, LTD. | 53,727 | 2.32 | 2,900 | 3.76 | ||||
| 2025-08-14 | 13F | Aqr Capital Management Llc | 0 | -100.00 | 0 | |||||
| 2025-07-22 | 13F | Highland Capital Management, Llc | 5,434 | 0.46 | 293 | 2.09 | ||||
| 2025-08-11 | 13F | HighTower Advisors, LLC | 9,020 | 0.01 | 487 | 1.46 | ||||
| 2025-08-14 | 13F | Mml Investors Services, Llc | 61,413 | -3.32 | 3 | 0.00 | ||||
| 2025-08-13 | 13F | Cresset Asset Management, LLC | 13,592 | 0.00 | 734 | 1.38 | ||||
| 2025-07-24 | 13F | Us Bancorp \de\ | 1,072 | 0.00 | 58 | 0.00 | ||||
| 2025-07-21 | 13F | Ameritas Advisory Services, LLC | 63,811 | 27.61 | 3,444 | 29.39 | ||||
| 2025-07-22 | 13F | Diligent Investors, LLC | 6,462 | -50.01 | 349 | -49.34 | ||||
| 2025-08-14 | 13F | Citadel Advisors Llc | 23,255 | 1,255 | ||||||
| 2025-08-01 | 13F | Envestnet Asset Management Inc | 81,118 | 0.94 | 4,378 | 2.34 | ||||
| 2025-08-11 | 13F | Intrepid Financial Planning Group LLC | 7,840 | 3.43 | 423 | 3.17 | ||||
| 2025-07-18 | 13F | Truist Financial Corp | 8,173 | 0.38 | 441 | 1.85 | ||||
| 2025-07-24 | 13F | Blair William & Co/il | 469 | 0.43 | 25 | 4.17 | ||||
| 2025-08-12 | 13F | Coldstream Capital Management Inc | 0 | -100.00 | 0 | |||||
| 2025-08-14 | 13F | UBS Group AG | 205,832 | 1.25 | 11,109 | 2.67 | ||||
| 2025-07-25 | 13F | Stephens Consulting, LLC | 3,607 | 0.00 | 195 | 1.57 | ||||
| 2025-08-14 | 13F/A | Rockefeller Capital Management L.P. | 206,149 | -5.62 | 11,126 | -4.29 | ||||
| 2025-08-13 | 13F | Cerity Partners LLC | 4,140 | 0.00 | 223 | 1.36 | ||||
| 2025-08-13 | 13F | Jones Financial Companies Lllp | 17,823 | 70.47 | 956 | 73.95 | ||||
| 2025-07-25 | 13F | Astoria Portfolio Advisors LLC. | 0 | -100.00 | 0 | |||||
| 2025-07-31 | 13F | Jackson Hole Capital Partners, LLC | 552 | 0.00 | 30 | 0.00 | ||||
| 2025-08-14 | 13F | Bank Of America Corp /de/ | 372,327 | -2.73 | 20,094 | -1.36 | ||||
| 2025-08-13 | 13F | Summit Financial, LLC | 7,236 | -6.44 | 391 | -5.11 | ||||
| 2025-07-16 | 13F | Beaumont Financial Advisors, LLC | 27,421 | -0.31 | 1,480 | 1.09 | ||||
| 2025-07-17 | 13F | Beacon Capital Management, LLC | 380 | 0.26 | 21 | 0.00 | ||||
| 2025-08-15 | 13F | Equitable Holdings, Inc. | 140,184 | -2.13 | 7,566 | -0.75 | ||||
| 2025-07-25 | 13F | Apollon Financial, LLC | 33,930 | -0.59 | 1,831 | 0.83 | ||||
| 2025-08-07 | 13F | CENTRAL TRUST Co | 1,076 | 0.00 | 58 | 1.75 | ||||
| 2025-08-12 | 13F | LPL Financial LLC | 547,091 | -0.05 | 29,526 | 1.36 | ||||
| 2025-08-13 | 13F | Beacon Pointe Advisors, LLC | 5,570 | 0.00 | 301 | 1.35 | ||||
| 2025-08-07 | 13F | Kestra Private Wealth Services, Llc | 100,810 | 2.52 | 5,441 | 3.96 | ||||
| 2025-08-08 | 13F | Symphony Financial Services, Inc. | 11,313 | 4.28 | 611 | 5.72 | ||||
| 2025-08-08 | 13F | Financial Gravity Companies, Inc. | 376 | 0.00 | 20 | 5.26 | ||||
| 2025-08-08 | 13F | Cetera Investment Advisers | 22,350 | -1.14 | 1,206 | 0.25 | ||||
| 2025-08-11 | 13F | Brown Brothers Harriman & Co | 2,173 | 0.00 | 117 | 1.74 | ||||
| 2025-08-08 | 13F | Kingsview Wealth Management, LLC | 13,430 | -2.78 | 725 | -1.50 | ||||
| 2025-07-25 | 13F | We Are One Seven, LLC | 259,981 | 5.61 | 14,031 | 7.10 | ||||
| 2025-08-04 | 13F | Flagship Harbor Advisors, Llc | 21,668 | 0.04 | 1,169 | 1.48 | ||||
| 2025-08-12 | 13F | Proequities, Inc. | 0 | 0 | ||||||
| 2025-08-06 | 13F | Wedbush Securities Inc | 9,062 | 0.00 | 0 | |||||
| 2025-08-11 | 13F | Alps Advisors Inc | 55,610 | 3,001 | ||||||
| 2025-07-28 | 13F | Rosenberg Matthew Hamilton | 318 | 0.00 | 17 | 6.25 | ||||
| 2025-08-14 | 13F | Mercer Global Advisors Inc /adv | 6,743 | 1.70 | 364 | 3.13 | ||||
| 2025-07-22 | 13F | DAVENPORT & Co LLC | 35,511 | 0.06 | 1,917 | 1.48 | ||||
| 2025-07-10 | 13F | Focus Financial Network, Inc. | 7,972 | -11.97 | 430 | -10.60 | ||||
| 2025-07-11 | 13F | Farther Finance Advisors, LLC | 42 | -74.85 | 2 | -75.00 | ||||
| 2025-07-31 | 13F | Oppenheimer & Co Inc | 8,905 | -13.42 | 481 | -12.25 | ||||
| 2025-08-14 | 13F | Mariner, LLC | 6,159 | 0.00 | 332 | 1.53 | ||||
| 2025-08-14 | 13F | Stifel Financial Corp | 90,521 | -13.52 | 4,885 | -12.30 | ||||
| 2025-06-25 | NP | RLGAX - RiverFront Asset Allocation Growth & Income Investor Shares | 55,610 | 2,884 | ||||||
| 2025-07-29 | 13F | Private Trust Co Na | 1,243 | 24.30 | 67 | 26.42 | ||||
| 2025-08-06 | 13F | New Millennium Group LLC | 0 | -100.00 | 0 | |||||
| 2025-08-12 | 13F | Nemes Rush Group LLC | 5,013 | -0.46 | 271 | 0.75 | ||||
| 2025-08-06 | 13F | Commonwealth Equity Services, Llc | 41,042 | 0.03 | 2 | 0.00 | ||||
| 2025-07-28 | 13F | BRYN MAWR TRUST Co | 1,569 | 0.00 | 85 | 1.20 | ||||
| 2025-09-04 | 13F/A | Advisor Group Holdings, Inc. | 65,977 | -15.45 | 3,562 | -14.25 | ||||
| 2025-07-10 | 13F | Wealth Enhancement Advisory Services, Llc | 69,158 | 0.48 | 3,787 | 3.41 | ||||
| 2025-08-12 | 13F | Jpmorgan Chase & Co | 7,478 | -14.14 | 404 | -12.96 | ||||
| 2025-08-14 | 13F | Raymond James Financial Inc | 285,148 | 3.26 | 15,389 | 4.72 | ||||
| 2025-07-15 | 13F | Burns Matteson Capital Management, LLC | 6,715 | -0.42 | 362 | 1.12 | ||||
| 2025-05-09 | 13F | Atria Wealth Solutions, Inc. | 0 | -100.00 | 0 | |||||
| 2025-05-12 | 13F | Independent Advisor Alliance | 0 | -100.00 | 0 | |||||
| 2025-08-14 | 13F | CoreCap Advisors, LLC | 140 | 0.00 | 8 | 0.00 | ||||
| 2025-04-16 | 13F | Kelly Financial Group Llc | 0 | -100.00 | 0 | |||||
| 2025-08-08 | 13F | Creative Planning | 7,200 | 0.00 | 389 | 1.31 |