Mga Batayang Estadistika
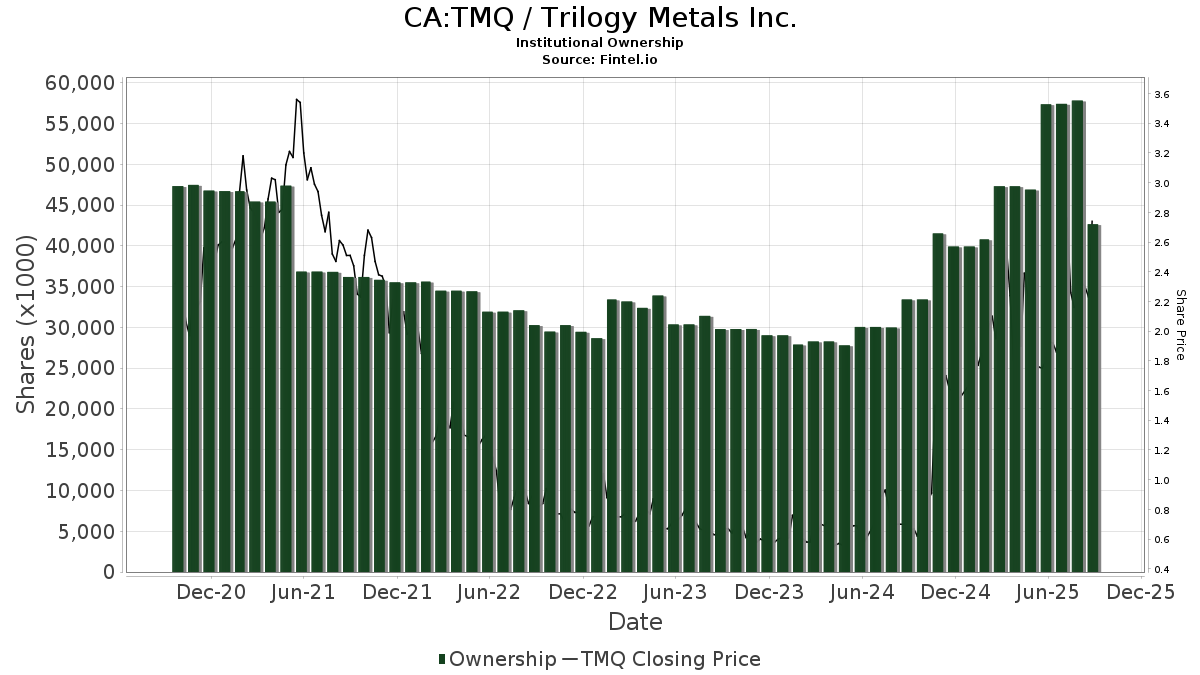
| Saham Institusional (Jangka Panjang) | 42,654,914 - 25.97% (ex 13D/G) - change of -14.71MM shares -25.64% MRQ |
| Nilai Institusional (Jangka Panjang) | $ 57,178 USD ($1000) |
Kepemilikan Institusional dan Pemegang Saham
Trilogy Metals Inc. (CA:TMQ) memiliki 71 pemilik institusional dan pemegang saham yang telah mengajukan formulir 13D/G atau 13F kepada Komisi Bursa Efek (Securities Exchange Commission/SEC). Lembaga-lembaga ini memegang total 42,654,914 saham. Pemegang saham terbesar meliputi Paulson & Co. Inc., Old West Investment Management, LLC, Wexford Capital Lp, Toroso Investments, LLC, Amplify ETF Trust - Amplify Junior Silver Miners ETF, Goehring & Rozencwajg Associates, LLC, Bornite Capital Management LP, Sprott Inc., Envestnet Asset Management Inc, and JOHN HANCOCK INVESTMENT TRUST - John Hancock Diversified Real Assets Fund Class NAV .
Struktur kepemilikan institusional Trilogy Metals Inc. (TSX:TMQ) menunjukkan posisi terkini di perusahaan oleh institusi dan dana, serta perubahan terbaru dalam ukuran posisi. Pemegang saham utama dapat mencakup investor individu, reksa dana, dana lindung nilai, atau institusi. Jadwal 13D menunjukkan bahwa investor memegang (atau pernah memegang) lebih dari 5% saham perusahaan dan bermaksud (atau pernah bermaksud) untuk secara aktif mengejar perubahan strategi bisnis. Jadwal 13G menunjukkan investasi pasif lebih dari 5%.
The share price as of September 5, 2025 is 2.55 / share. Previously, on September 6, 2024, the share price was 0.70 / share. This represents an increase of 264.29% over that period.
Skor Sentimen Dana
Skor Sentimen Dana (sebelumnya dikenal sebagai Skor Akumulasi Kepemilikan) menemukan saham-saham yang paling banyak dibeli oleh dana. Ini adalah hasil dari model kuantitatif multi-faktor yang canggih yang mengidentifikasi perusahaan dengan tingkat akumulasi institusional tertinggi. Model penilaian menggunakan kombinasi dari total peningkatan pemilik yang diungkapkan, perubahan dalam alokasi portofolio pada pemilik tersebut, dan metrik lainnya. Angka berkisar dari 0 hingga 100, dengan angka yang lebih tinggi menunjukkan tingkat akumulasi yang lebih tinggi dibandingkan dengan perusahaan sejenisnya, dan 50 adalah rata-ratanya.
Frekuensi Pembaruan: Setiap Hari
Lihat Ownership Explorer, yang menyediakan daftar perusahaan dengan peringkat tertinggi.
Pengajuan 13F dan NPORT
Detail pada pengajuan 13F tersedia gratis. Detail pada pengajuan NP memerlukan keanggotaan premium. Baris berwarna hijau menunjukkan posisi baru. Baris berwarna merah menunjukkan posisi yang sudah ditutup. Klik tautan ini ikon untuk melihat riwayat transaksi selengkapnya.
Tingkatkan
untuk membuka data premium dan mengekspor ke Excel ![]() .
.
| Tanggal File | Sumber | Investor | Ketik | Presyo ng Avg (Silangan) |
Saham | Δ Saham (%) |
Dilaporkan Nilai ($1000) |
Nilai Δ (%) |
Alokasi Port (%) |
|
|---|---|---|---|---|---|---|---|---|---|---|
| 2025-08-14 | 13F | Family Management Corp | 0 | -100.00 | 0 | |||||
| 2025-08-14 | 13F | Raymond James Financial Inc | 10,044 | 0.00 | 14 | -13.33 | ||||
| 2025-05-15 | 13F | Tower Research Capital LLC (TRC) | 0 | -100.00 | 0 | |||||
| 2025-08-25 | NP | SPROTT FUNDS TRUST - Sprott Junior Copper Miners ETF | 222,639 | -13.74 | 301 | -25.00 | ||||
| 2025-08-14 | 13F | Wells Fargo & Company/mn | 10,519 | -1.29 | 14 | -12.50 | ||||
| 2025-08-15 | 13F | Morgan Stanley | 37,539 | 0.00 | 51 | -13.79 | ||||
| 2025-08-13 | 13F | Northwestern Mutual Wealth Management Co | 28 | 0.00 | 0 | |||||
| 2025-08-14 | 13F | Susquehanna International Group, Llp | 0 | -100.00 | 0 | |||||
| 2025-08-18 | 13F/A | National Bank Of Canada /fi/ | 29 | -79.14 | 0 | |||||
| 2025-08-14 | 13F | IPG Investment Advisors LLC | 14,850 | 0.00 | 20 | -13.04 | ||||
| 2025-08-14 | 13F | Royal Bank Of Canada | 670 | -93.68 | 1 | -93.75 | ||||
| 2025-08-14 | 13F | Federation des caisses Desjardins du Quebec | 200 | -36.91 | 0 | |||||
| 2025-08-01 | 13F | Envestnet Asset Management Inc | 562,080 | 119.96 | 759 | 91.41 | ||||
| 2025-08-12 | 13F | Goehring & Rozencwajg Associates, LLC | 1,279,509 | -8.79 | 1,739 | -23.79 | ||||
| 2025-08-14 | 13F | Two Sigma Investments, Lp | 214,594 | 4.76 | 290 | -8.83 | ||||
| 2025-08-08 | 13F | New England Capital Financial Advisors LLC | 333 | 0.00 | 0 | |||||
| 2025-07-15 | 13F | Financial Management Professionals, Inc. | 500 | 1 | ||||||
| 2025-08-12 | 13F | LPL Financial LLC | 28,552 | 129.92 | 39 | 100.00 | ||||
| 2025-07-11 | 13F | Farther Finance Advisors, LLC | 0 | -100.00 | 0 | |||||
| 2025-08-05 | 13F | Simplex Trading, Llc | 5,074 | -68.26 | 0 | |||||
| 2025-08-14 | 13F | Jane Street Group, Llc | 113,843 | 154 | ||||||
| 2025-08-13 | 13F/A | DLD Asset Management, LP | 300,000 | 20.00 | 405 | 4.65 | ||||
| 2025-08-05 | 13F | Simplex Trading, Llc | Put | 300 | -25.00 | 0 | ||||
| 2025-08-08 | 13F | Pnc Financial Services Group, Inc. | 2,000 | 0.00 | 3 | -33.33 | ||||
| 2025-08-14 | 13F | Susquehanna International Group, Llp | Call | 202,500 | 14.54 | 273 | -0.36 | |||
| 2025-08-14 | 13F | Susquehanna International Group, Llp | Put | 15,600 | 44.44 | 21 | 31.25 | |||
| 2025-08-12 | 13F | Dimensional Fund Advisors Lp | 21,693 | 0.00 | 29 | -12.12 | ||||
| 2025-08-11 | 13F | Birchbrook, Inc. | 0 | -100.00 | 0 | |||||
| 2025-08-14 | 13F | Cubist Systematic Strategies, LLC | 51,795 | 70 | ||||||
| 2025-08-14 | 13F | Bank Of America Corp /de/ | 122,095 | 16.50 | 165 | 1.23 | ||||
| 2025-08-04 | 13F | Spire Wealth Management | 12,105 | 97.09 | 16 | 77.78 | ||||
| 2025-08-14 | 13F | Paulson & Co. Inc. | 14,326,996 | 0.00 | 19,341 | -12.90 | ||||
| 2025-07-14 | 13F | Legacy Capital Group California, Inc. | 222,454 | 48.86 | 300 | 29.87 | ||||
| 2025-08-12 | 13F | Pathstone Holdings, LLC | 20,000 | 0.00 | 27 | -12.90 | ||||
| 2025-07-10 | 13F | Baader Bank INC | 0 | -100.00 | 0 | |||||
| 2025-08-12 | 13F | Jpmorgan Chase & Co | 204,800 | 5,289.47 | 276 | 5,420.00 | ||||
| 2025-08-14 | 13F | UBS Group AG | 22,664 | -64.07 | 31 | -69.07 | ||||
| 2025-08-14 | 13F | Harwood Advisory Group, LLC | 0 | -100.00 | 0 | |||||
| 2025-08-18 | 13F | Wolverine Trading, Llc | Call | 21,500 | 31 | |||||
| 2025-08-14 | 13F | Millennium Management Llc | 321,949 | 435 | ||||||
| 2025-05-14 | 13F | Credit Agricole S A | 167 | 0.00 | 0 | |||||
| 2025-07-31 | 13F | Cambridge Investment Research Advisors, Inc. | 27,808 | 0 | ||||||
| 2025-08-08 | 13F | Old West Investment Management, LLC | 11,094,426 | -12.03 | 14,977 | -23.63 | ||||
| 2025-08-14 | 13F | Hrt Financial Lp | 209,114 | 0 | ||||||
| 2025-07-14 | 13F | AdvisorNet Financial, Inc | 9,258 | 0.00 | 12 | -14.29 | ||||
| 2025-09-04 | 13F/A | Advisor Group Holdings, Inc. | 16 | 0.00 | 0 | |||||
| 2025-08-25 | NP | SETM - Sprott Energy Transition Materials ETF | 9,840 | 10.66 | 13 | 0.00 | ||||
| 2025-07-25 | 13F | Cwm, Llc | 75 | 0.00 | 0 | |||||
| 2025-08-14 | 13F | Praetorian PR LLC | 0 | -100.00 | 0 | |||||
| 2025-08-05 | 13F | Simplex Trading, Llc | Call | 0 | -100.00 | 0 | ||||
| 2025-08-08 | 13F | Compass Wealth Management LLC | 0 | -100.00 | 0 | |||||
| 2025-07-28 | 13F | Harbour Investments, Inc. | 66 | 0.00 | 0 | |||||
| 2025-07-31 | 13F/A | Avion Wealth | 8,400 | 0 | ||||||
| 2025-08-14 | 13F | Wiley Bros.-aintree Capital, Llc | 37,285 | 50 | ||||||
| 2025-08-08 | 13F | SBI Securities Co., Ltd. | 0 | -100.00 | 0 | |||||
| 2025-08-13 | 13F/A | StoneX Group Inc. | 0 | -100.00 | 0 | -100.00 | ||||
| 2025-08-08 | 13F | Pinnbrook Capital Management Lp | 0 | -100.00 | 0 | -100.00 | ||||
| 2025-08-14 | 13F | Integrated Wealth Concepts LLC | 10,000 | 14 | ||||||
| 2025-08-12 | 13F | XTX Topco Ltd | 85,352 | 115 | ||||||
| 2025-07-28 | NP | AVDS - Avantis International Small Cap Equity ETF | 5,285 | 6 | ||||||
| 2025-08-13 | 13F | Renaissance Technologies Llc | 164,100 | 192.51 | 222 | 156.98 | ||||
| 2025-08-14 | 13F | Group One Trading, L.p. | Call | 1,400 | -78.79 | 2 | -90.00 | |||
| 2025-08-14 | 13F | Group One Trading, L.p. | 4,504 | 6 | ||||||
| 2025-08-14 | 13F | Group One Trading, L.p. | Put | 100 | 0 | |||||
| 2025-08-11 | 13F | TD Waterhouse Canada Inc. | 50 | 0.00 | 0 | |||||
| 2025-08-25 | NP | SPROTT FUNDS TRUST - Sprott Copper Miners ETF | 39,157 | -15.43 | 53 | -26.76 | ||||
| 2025-07-22 | NP | GRHIX - Goehring & Rozencwajg Resources Fund Institutional Class Shares | 18,700 | -97.29 | 22 | -97.33 | ||||
| 2025-08-14 | 13F | CoreCap Advisors, LLC | 1,066 | 0.00 | 1 | 0.00 | ||||
| 2025-08-12 | 13F | Virtu Financial LLC | 41,798 | -21.87 | 0 | |||||
| 2025-08-14 | 13F | Wexford Capital Lp | 3,472,836 | -33.52 | 4,688 | -42.10 | ||||
| 2025-08-07 | 13F | Bornite Capital Management LP | 1,000,000 | 0.00 | 1,350 | -12.90 | ||||
| 2025-08-14 | 13F | GeoSphere Capital Management | 150,000 | -50.00 | 202 | -56.56 | ||||
| 2025-08-14 | 13F | Two Sigma Securities, Llc | 0 | -100.00 | 0 | |||||
| 2025-08-11 | 13F | Sprott Inc. | 803,834 | -57.44 | 1,085 | -62.93 | ||||
| 2025-07-28 | 13F | Cypress Wealth Services, LLC | 19,600 | 0.00 | 26 | -13.33 | ||||
| 2025-05-12 | 13F | Citigroup Inc | 0 | -100.00 | 0 | |||||
| 2025-08-13 | 13F | Truvestments Capital Llc | 8 | 0.00 | 0 | |||||
| 2025-08-29 | NP | JOHN HANCOCK INVESTMENT TRUST - John Hancock Diversified Real Assets Fund Class NAV | 498,375 | -4.61 | 677 | -15.16 | ||||
| 2025-08-14 | 13F | Goldman Sachs Group Inc | 61,550 | 83 | ||||||
| 2025-08-14 | 13F | Citadel Advisors Llc | Call | 26,100 | -41.48 | 35 | -49.28 | |||
| 2025-05-15 | 13F | Foursixthree Capital Lp | 0 | -100.00 | 0 | -100.00 | ||||
| 2025-08-14 | 13F | Citadel Advisors Llc | Put | 28,600 | 3,077.78 | 39 | 3,700.00 | |||
| 2025-07-30 | 13F | Cullen/frost Bankers, Inc. | 0 | -100.00 | 0 | |||||
| 2025-08-14 | 13F | Rangeley Capital, LLC | 87,000 | -11.29 | 117 | -23.03 | ||||
| 2025-08-14 | 13F | Two Sigma Advisers, Lp | 85,100 | -42.34 | 115 | -50.00 | ||||
| 2025-08-14 | 13F | Citadel Advisors Llc | 247,904 | 48.72 | 335 | 29.46 | ||||
| 2025-07-24 | 13F | Us Bancorp \de\ | 6 | 0.00 | 0 | |||||
| 2025-08-14 | 13F | Toroso Investments, LLC | 2,725,473 | -50.47 | 3,679 | -56.86 | ||||
| 2025-07-30 | 13F | Exencial Wealth Advisors, Llc | 11,190 | 0.00 | 15 | -11.76 | ||||
| 2025-08-14 | 13F | Manufacturers Life Insurance Company, The | 498,375 | -4.61 | 674 | -16.19 | ||||
| 2025-08-12 | 13F | Global Retirement Partners, LLC | 33 | 0.00 | 0 | |||||
| 2025-08-12 | 13F | Proequities, Inc. | Put | 0 | 0 | |||||
| 2025-08-11 | 13F | TSP Capital Management Group, LLC | 8,306 | 2.61 | ||||||
| 2025-08-12 | 13F | Proequities, Inc. | Call | 0 | 0 | |||||
| 2025-08-12 | 13F | Proequities, Inc. | 0 | 0 | ||||||
| 2025-07-24 | 13F | Total Wealth Planning & Management, Inc. | 100,500 | -1.95 | 136 | -14.56 | ||||
| 2025-08-28 | NP | Amplify ETF Trust - Amplify Junior Silver Miners ETF | 2,725,473 | -50.47 | 3,679 | -56.86 | ||||
| 2025-08-11 | 13F | Alps Advisors Inc | 271,636 | -13.29 | 367 | -24.54 |