Mga Batayang Estadistika
| Pemilik Institusional | 119 total, 119 long only, 0 short only, 0 long/short - change of 21.21% MRQ |
| Alokasi Portofolio Rata-rata | 0.1774 % - change of 10.01% MRQ |
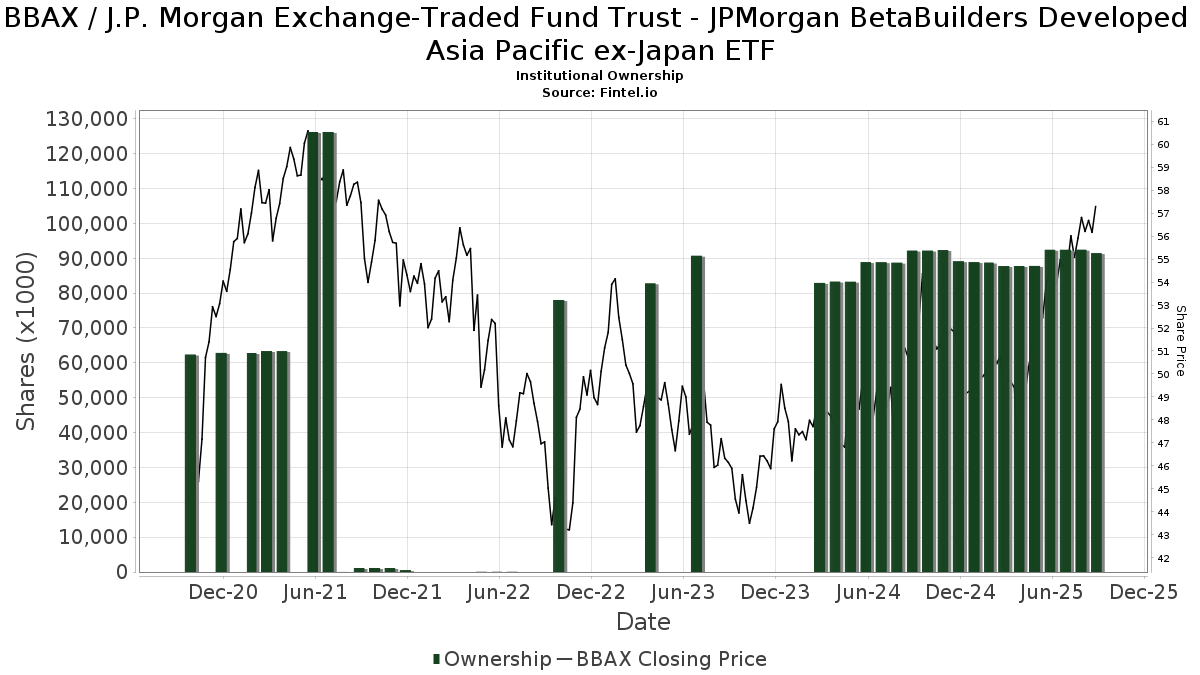
| Saham Institusional (Jangka Panjang) | 91,477,325 (ex 13D/G) - change of -0.95MM shares -1.03% MRQ |
| Nilai Institusional (Jangka Panjang) | $ 4,963,169 USD ($1000) |
Kepemilikan Institusional dan Pemegang Saham
J.P. Morgan Exchange-Traded Fund Trust - JPMorgan BetaBuilders Developed Asia Pacific ex-Japan ETF (US:BBAX) memiliki 119 pemilik institusional dan pemegang saham yang telah mengajukan formulir 13D/G atau 13F kepada Komisi Bursa Efek (Securities Exchange Commission/SEC). Lembaga-lembaga ini memegang total 91,477,325 saham. Pemegang saham terbesar meliputi Jpmorgan Chase & Co, Bank Of America Corp /de/, Janus Henderson Group Plc, Clayton Street Trust - Protective Life Dynamic Allocation Series - Moderate Portfolio, AIA Group Ltd, Municipal Employees' Retirement System of Michigan, Morgan Stanley, Badgley Phelps Wealth Managers, LLC, Jane Street Group, Llc, and Simon Quick Advisors, Llc .
Struktur kepemilikan institusional J.P. Morgan Exchange-Traded Fund Trust - JPMorgan BetaBuilders Developed Asia Pacific ex-Japan ETF (BATS:BBAX) menunjukkan posisi terkini di perusahaan oleh institusi dan dana, serta perubahan terbaru dalam ukuran posisi. Pemegang saham utama dapat mencakup investor individu, reksa dana, dana lindung nilai, atau institusi. Jadwal 13D menunjukkan bahwa investor memegang (atau pernah memegang) lebih dari 5% saham perusahaan dan bermaksud (atau pernah bermaksud) untuk secara aktif mengejar perubahan strategi bisnis. Jadwal 13G menunjukkan investasi pasif lebih dari 5%.
The share price as of September 11, 2025 is 57.86 / share. Previously, on September 12, 2024, the share price was 51.80 / share. This represents an increase of 11.70% over that period.
Skor Sentimen Dana
Skor Sentimen Dana (sebelumnya dikenal sebagai Skor Akumulasi Kepemilikan) menemukan saham-saham yang paling banyak dibeli oleh dana. Ini adalah hasil dari model kuantitatif multi-faktor yang canggih yang mengidentifikasi perusahaan dengan tingkat akumulasi institusional tertinggi. Model penilaian menggunakan kombinasi dari total peningkatan pemilik yang diungkapkan, perubahan dalam alokasi portofolio pada pemilik tersebut, dan metrik lainnya. Angka berkisar dari 0 hingga 100, dengan angka yang lebih tinggi menunjukkan tingkat akumulasi yang lebih tinggi dibandingkan dengan perusahaan sejenisnya, dan 50 adalah rata-ratanya.
Frekuensi Pembaruan: Setiap Hari
Lihat Ownership Explorer, yang menyediakan daftar perusahaan dengan peringkat tertinggi.
Rasio Put/Call Institusional
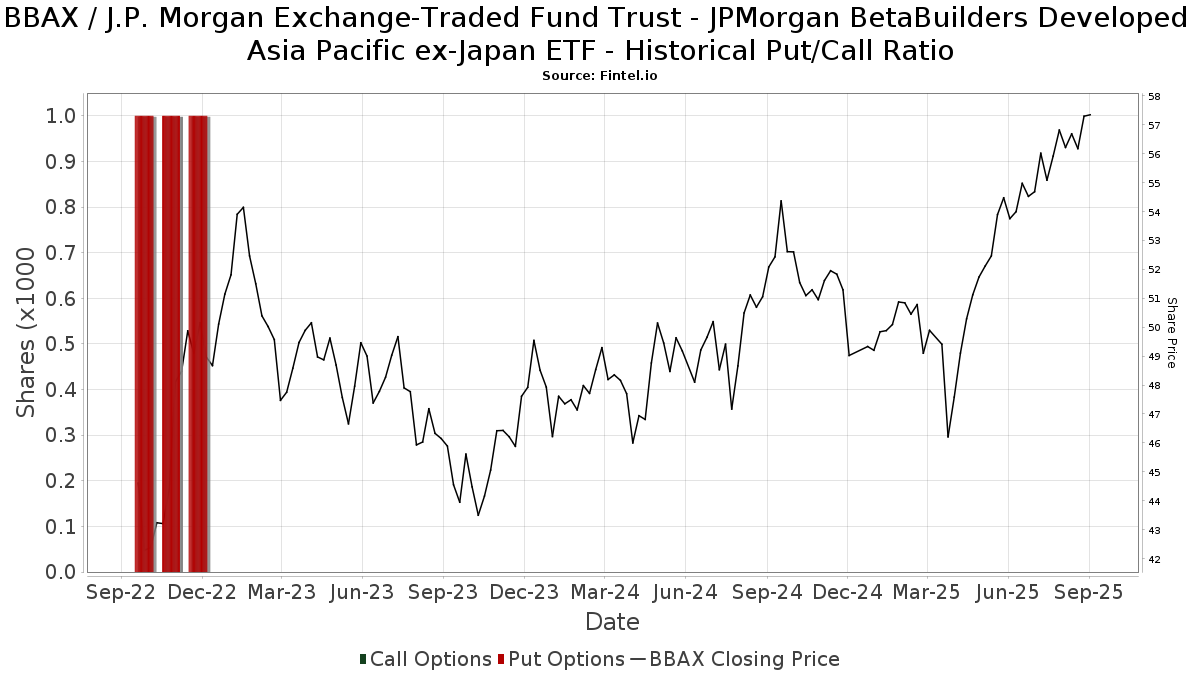
Selain melaporkan isu ekuitas dan utang standar, institusi dengan aset di bawah manajemen lebih dari 100 juta dolar AS juga harus mengungkapkan kepemilikan opsi put dan call mereka. Karena opsi put umumnya menunjukkan sentimen negatif, dan opsi call menunjukkan sentimen positif, kita dapat mengetahui sentimen institusional secara keseluruhan dengan memplot rasio put terhadap call. Grafik di sebelah kanan memplot rasio put/call historis untuk instrumen ini.
Menggunakan Rasio Put/Call sebagai indikator sentimen investor mengatasi salah satu kekurangan utama dari penggunaan total kepemilikan institusional, yaitu sejumlah besar aset yang dikelola diinvestasikan secara pasif untuk melacak indeks. Dana yang dikelola secara pasif biasanya tidak membeli opsi, sehingga indikator rasio put/call lebih akurat dalam melacak sentimen dana yang dikelola secara aktif.
Pengajuan 13F dan NPORT
Detail pada pengajuan 13F tersedia gratis. Detail pada pengajuan NP memerlukan keanggotaan premium. Baris berwarna hijau menunjukkan posisi baru. Baris berwarna merah menunjukkan posisi yang sudah ditutup. Klik tautan ini ikon untuk melihat riwayat transaksi selengkapnya.
Tingkatkan
untuk membuka data premium dan mengekspor ke Excel ![]() .
.
| Tanggal File | Sumber | Investor | Ketik | Presyo ng Avg (Silangan) |
Saham | Δ Saham (%) |
Dilaporkan Nilai ($1000) |
Nilai Δ (%) |
Alokasi Port (%) |
|
|---|---|---|---|---|---|---|---|---|---|---|
| 2025-07-24 | 13F | Us Bancorp \de\ | 9,099 | 65.47 | 496 | 85.39 | ||||
| 2025-08-01 | 13F | Envestnet Asset Management Inc | 0 | -100.00 | 0 | |||||
| 2025-08-12 | 13F | Laurel Wealth Advisors LLC | 6,486 | 5,350.42 | 0 | -100.00 | ||||
| 2025-07-14 | 13F | Pacifica Partners Inc. | 62 | 3 | ||||||
| 2025-08-15 | 13F | CI Private Wealth, LLC | 11,833 | 0.31 | 645 | 12.39 | ||||
| 2025-04-22 | 13F | Atticus Wealth Management, Llc | 0 | -100.00 | 0 | |||||
| 2025-05-05 | 13F | Kestra Private Wealth Services, Llc | 0 | -100.00 | 0 | |||||
| 2025-07-28 | 13F | Harbour Investments, Inc. | 0 | -100.00 | 0 | |||||
| 2025-08-14 | 13F | Glen Eagle Advisors, LLC | 18 | 0.00 | 1 | |||||
| 2025-04-30 | 13F | Allworth Financial LP | 0 | -100.00 | 0 | |||||
| 2025-08-11 | 13F | FSC Wealth Advisors, LLC | 0 | -100.00 | 0 | |||||
| 2025-08-14 | 13F | Royal Bank Of Canada | 13,495 | 474.26 | 735 | 539.13 | ||||
| 2025-08-14 | 13F | Circle Wealth Management, LLC | 9,871 | 0.00 | 538 | 11.88 | ||||
| 2025-07-10 | 13F | Tompkins Financial Corp | 0 | -100.00 | 0 | |||||
| 2025-08-11 | 13F | Aptus Capital Advisors, LLC | 9 | -66.67 | 0 | -100.00 | ||||
| 2025-08-29 | NP | N/A - Protective Life Dynamic Allocation Series - Conservative Portfolio | 19,304 | -7.87 | 1,052 | 3.24 | ||||
| 2025-03-12 | 13F/A | Private Capital Management Llc | 0 | -100.00 | 0 | -100.00 | ||||
| 2025-07-18 | 13F | Trust Co Of Vermont | 197 | 11 | ||||||
| 2025-07-30 | 13F | Crewe Advisors LLC | 1,653 | 0.00 | 90 | 12.50 | ||||
| 2025-08-14 | 13F | Douglass Winthrop Advisors, LLC | 0 | -100.00 | 0 | |||||
| 2025-08-11 | 13F | Dorsey & Whitney Trust CO LLC | 6,421 | 10.02 | 350 | 23.32 | ||||
| 2025-08-14 | 13F | Fmr Llc | 3,531 | -11.68 | 192 | -1.03 | ||||
| 2025-08-06 | 13F | AIA Group Ltd | 355,599 | 4.57 | 19,380 | 17.14 | ||||
| 2025-08-15 | 13F | Morgan Stanley | 282,971 | 8.75 | 15,422 | 21.83 | ||||
| 2025-08-01 | 13F | Gwn Securities Inc. | 0 | -100.00 | 0 | |||||
| 2025-04-23 | 13F | Financial Life Planners | 0 | -100.00 | 0 | |||||
| 2025-08-13 | 13F | Northwestern Mutual Wealth Management Co | 5,735 | 7.44 | 313 | 20.46 | ||||
| 2025-05-14 | 13F | Oarsman Capital, Inc. | 0 | -100.00 | 0 | |||||
| 2025-08-13 | 13F | Flow Traders U.s. Llc | 5,333 | 0 | ||||||
| 2025-04-29 | 13F | Chilton Capital Management Llc | 0 | -100.00 | 0 | |||||
| 2025-05-16 | 13F | Coppell Advisory Solutions LLC | 0 | -100.00 | 0 | |||||
| 2025-08-12 | 13F | Jpmorgan Chase & Co | 79,925,180 | -0.49 | 4,355,922 | 11.48 | ||||
| 2025-08-11 | 13F | Brown Brothers Harriman & Co | 6,330 | 281.56 | 345 | 330.00 | ||||
| 2025-07-15 | 13F | Fifth Third Bancorp | 496 | 27 | ||||||
| 2025-07-25 | 13F | waypoint wealth counsel | 4,453 | 0.00 | 243 | 12.04 | ||||
| 2025-08-12 | 13F | MAI Capital Management | 32 | 0.00 | 2 | 0.00 | ||||
| 2025-08-13 | 13F | Transce3nd, LLC | 97 | 0.00 | 5 | 25.00 | ||||
| 2025-04-22 | 13F | Synergy Financial Management, LLC | 0 | -100.00 | 0 | |||||
| 2025-07-28 | 13F | Frazier Financial Advisors, LLC | 6 | 0 | ||||||
| 2025-07-30 | 13F | Bogart Wealth, LLC | 44 | 0.00 | 2 | 0.00 | ||||
| 2025-07-24 | 13F | Blair William & Co/il | 7,904 | -0.08 | 431 | 11.98 | ||||
| 2025-07-24 | 13F | Robertson Stephens Wealth Management, LLC | 4,513 | 0.07 | 246 | 11.87 | ||||
| 2025-08-14 | 13F | McIlrath & Eck, LLC | 25 | 0.00 | 1 | 0.00 | ||||
| 2025-08-05 | 13F | Plante Moran Financial Advisors, LLC | 71 | 4 | ||||||
| 2025-04-21 | 13F | Nelson, Van Denburg & Campbell Wealth Management Group, LLC | 0 | -100.00 | 0 | |||||
| 2025-08-29 | NP | Clayton Street Trust - Protective Life Dynamic Allocation Series - Growth Portfolio | 35,383 | -14.23 | 1,928 | -3.94 | ||||
| 2025-08-29 | NP | Clayton Street Trust - Protective Life Dynamic Allocation Series - Moderate Portfolio | 434,809 | -8.19 | 23,697 | 2.86 | ||||
| 2025-07-24 | 13F | JNBA Financial Advisors | 17 | 1 | ||||||
| 2025-07-10 | 13F | Farmers & Merchants Trust Co of Chambersburg PA | 592 | 0.00 | 0 | |||||
| 2025-08-14 | 13F | Bank Of America Corp /de/ | 7,937,063 | -3.96 | 432,570 | 7.59 | ||||
| 2025-08-14 | 13F | Icon Wealth Advisors, LLC | 7,319 | 2.08 | 399 | 14.37 | ||||
| 2025-08-08 | 13F | Creative Planning | 7,205 | -25.94 | 393 | -17.12 | ||||
| 2025-08-08 | 13F | Avalon Trust Co | 690 | 38 | ||||||
| 2025-08-12 | 13F | SRS Capital Advisors, Inc. | 117 | 0.86 | 6 | 20.00 | ||||
| 2025-08-14 | 13F | Wells Fargo & Company/mn | 69,945 | -9.35 | 3,812 | 1.55 | ||||
| 2025-08-13 | 13F | Cerity Partners LLC | 6,119 | 333 | ||||||
| 2025-05-09 | 13F | Hemington Wealth Management | 0 | -100.00 | 0 | |||||
| 2025-08-04 | 13F | Center for Financial Planning, Inc. | 3 | 0 | ||||||
| 2025-08-19 | 13F | Delos Wealth Advisors, LLC | 191 | 10 | ||||||
| 2025-07-10 | 13F | Exchange Traded Concepts, Llc | 2,413 | 132 | ||||||
| 2025-07-25 | 13F | LRI Investments, LLC | 0 | -100.00 | 0 | |||||
| 2025-07-21 | 13F | Ameritas Advisory Services, LLC | 100 | 5 | ||||||
| 2025-04-28 | 13F | Coastline Trust Co | 0 | -100.00 | 0 | |||||
| 2025-07-17 | 13F | Sound Income Strategies, LLC | 40 | 2 | ||||||
| 2025-08-14 | 13F | CoreCap Advisors, LLC | 15 | -76.92 | 1 | -100.00 | ||||
| 2025-05-12 | 13F | Citigroup Inc | 0 | -100.00 | 0 | |||||
| 2025-07-15 | 13F | Mather Group, Llc. | 0 | -100.00 | 0 | |||||
| 2025-08-13 | 13F | Renaissance Technologies Llc | 9,000 | 490 | ||||||
| 2025-05-02 | 13F | Leo Wealth, LLC | 0 | -100.00 | 0 | |||||
| 2025-08-08 | 13F | Tortoise Investment Management, LLC | 0 | -100.00 | 0 | |||||
| 2025-08-14 | 13F | Qube Research & Technologies Ltd | 4,277 | 233 | ||||||
| 2025-04-21 | 13F | Beacon Capital Management, LLC | 0 | -100.00 | 0 | |||||
| 2025-08-04 | 13F | Assetmark, Inc | 9 | 50.00 | 0 | |||||
| 2025-08-14 | 13F | Janus Henderson Group Plc | 495,453 | -7.53 | 27,002 | 3.23 | ||||
| 2025-07-30 | 13F | Cullen/frost Bankers, Inc. | 196 | 11 | ||||||
| 2025-05-06 | 13F | Venturi Wealth Management, LLC | 0 | -100.00 | 0 | |||||
| 2025-05-13 | 13F | Franklin Resources Inc | 0 | -100.00 | 0 | |||||
| 2025-07-28 | 13F | BRYN MAWR TRUST Co | 9,854 | -5.89 | 537 | 5.50 | ||||
| 2025-08-01 | 13F | Bessemer Group Inc | 30 | 0 | ||||||
| 2025-08-08 | 13F | Pnc Financial Services Group, Inc. | 3,593 | 19.49 | 196 | 33.56 | ||||
| 2025-08-13 | 13F | EverSource Wealth Advisors, LLC | 10 | 0.00 | 1 | |||||
| 2025-05-15 | 13F | Proquility Private Wealth Partners, LLC | 167,548 | 21.43 | 8,151 | 21.19 | ||||
| 2025-08-14 | 13F | Granite FO LLC | 12 | 0.00 | 1 | |||||
| 2025-08-13 | 13F | Rsm Us Wealth Management Llc | 35,047 | -1.03 | 1,910 | 10.92 | ||||
| 2025-07-25 | 13F | Cwm, Llc | 44,085 | 6,326.38 | 2 | |||||
| 2025-08-12 | 13F | Atlas Capital Advisors Llc | 44,135 | 78.56 | 2,405 | 100.08 | ||||
| 2025-08-12 | 13F | Coldstream Capital Management Inc | 0 | -100.00 | 0 | |||||
| 2025-08-12 | 13F | LPL Financial LLC | 47,237 | 50.19 | 2,574 | 68.24 | ||||
| 2025-08-06 | 13F | Eukles Asset Management | 14 | 0.00 | 1 | |||||
| 2025-08-04 | 13F | Spire Wealth Management | 251 | 0.00 | 14 | 8.33 | ||||
| 2025-08-12 | 13F | Inscription Capital, LLC | 0 | -100.00 | 0 | |||||
| 2025-09-04 | 13F/A | Advisor Group Holdings, Inc. | 2,732 | 20.19 | 149 | 35.45 | ||||
| 2025-08-12 | 13F | Steward Partners Investment Advisory, Llc | 83 | -97.59 | 5 | -97.60 | ||||
| 2025-08-14 | 13F | Comerica Bank | 19,057 | -2.92 | 1,039 | 8.69 | ||||
| 2025-08-08 | 13F | Cetera Investment Advisers | 7,110 | 1.44 | 387 | 13.82 | ||||
| 2025-08-06 | 13F | AE Wealth Management LLC | 311 | -3.42 | 17 | 6.67 | ||||
| 2025-08-12 | 13F | Archer Investment Corp | 132 | 0.00 | 7 | 16.67 | ||||
| 2025-08-19 | 13F | Newbridge Financial Services Group, Inc. | 18 | 1 | ||||||
| 2025-04-04 | 13F | Webster Bank, N. A. | 0 | -100.00 | 0 | |||||
| 2025-07-31 | 13F | CVA Family Office, LLC | 128 | 0.00 | 7 | 0.00 | ||||
| 2025-08-06 | 13F | Legacy Wealth Managment, LLC/ID | 74 | 4 | ||||||
| 2025-08-13 | 13F | Twin Peaks Wealth Advisors, LLC | 111 | 6 | ||||||
| 2025-08-13 | 13F | Jones Financial Companies Lllp | 127 | 164.58 | 7 | 200.00 | ||||
| 2025-08-06 | 13F | Golden State Wealth Management, LLC | 0 | -100.00 | 0 | -100.00 | ||||
| 2025-08-12 | 13F | CIBC Private Wealth Group, LLC | 153 | 8 | ||||||
| 2025-05-02 | 13F | Larson Financial Group LLC | 0 | -100.00 | 0 | |||||
| 2025-08-07 | 13F | Resources Investment Advisors, LLC. | 24,815 | 1,352 | ||||||
| 2025-08-12 | 13F | Proequities, Inc. | 0 | 0 | ||||||
| 2025-08-14 | 13F | Stifel Financial Corp | 6,084 | -57.70 | 332 | -52.65 | ||||
| 2025-08-06 | 13F | Legacy Investment Solutions, LLC | 74 | 4 | ||||||
| 2025-08-12 | 13F | BlackRock, Inc. | 199 | 11 | ||||||
| 2025-08-14 | 13F | Ieq Capital, Llc | 4,505 | 246 | ||||||
| 2025-08-13 | 13F | Green Harvest Asset Management LLC | 60,238 | -0.74 | 3,283 | 11.18 | ||||
| 2025-08-14 | 13F/A | Rockefeller Capital Management L.P. | 18,384 | -37.75 | 1,002 | -30.29 | ||||
| 2025-07-15 | 13F | Financial Management Professionals, Inc. | 381 | 0.00 | 21 | 11.11 | ||||
| 2025-08-04 | 13F | Municipal Employees' Retirement System of Michigan | 298,785 | -67.17 | 16 | -63.64 | ||||
| 2025-08-04 | 13F | Migdal Insurance & Financial Holdings Ltd. | 145 | 0.00 | 0 | |||||
| 2025-08-14 | 13F | Jane Street Group, Llc | 177,416 | 95.88 | 9,669 | 119.45 | ||||
| 2025-08-08 | 13F | Fortis Group Advisors, LLC | 14 | 0.00 | 1 | |||||
| 2025-08-14 | 13F | Mml Investors Services, Llc | 30,735 | 6.87 | 2 | 0.00 | ||||
| 2025-07-22 | 13F | Old National Bancorp /in/ | 24,851 | 0.00 | 1,354 | 11.99 | ||||
| 2025-08-14 | 13F | Mariner, LLC | 4,122 | 225 | ||||||
| 2025-08-18 | 13F | Geneos Wealth Management Inc. | 23 | 0.00 | 1 | 0.00 | ||||
| 2025-08-14 | 13F | UBS Group AG | 76,920 | -10.84 | 4,192 | -0.12 | ||||
| 2025-08-12 | 13F | O'shaughnessy Asset Management, Llc | 726 | 40 | ||||||
| 2025-05-07 | 13F | Mb, Levis & Associates, Llc | 0 | -100.00 | 0 | -100.00 | ||||
| 2025-07-11 | 13F | Farther Finance Advisors, LLC | 94 | 5.62 | 5 | 25.00 | ||||
| 2025-08-05 | 13F | Bank Of Montreal /can/ | 45 | -67.63 | 2 | -66.67 | ||||
| 2025-07-15 | 13F | Ballentine Partners, LLC | 6,434 | -20.92 | 351 | -11.39 | ||||
| 2025-08-14 | 13F | Hrt Financial Lp | 0 | -100.00 | 0 | |||||
| 2025-07-31 | 13F | Orion Capital Management LLC | 274 | 0.00 | 15 | 7.69 | ||||
| 2025-08-05 | 13F | Huntington National Bank | 79 | 5.41 | ||||||
| 2025-08-04 | 13F | Simon Quick Advisors, Llc | 172,280 | 9,389 | ||||||
| 2025-08-11 | 13F | Strategic Wealth Partners, Ltd. | 61 | 3 | ||||||
| 2025-08-14 | 13F | Harwood Advisory Group, LLC | 8 | -83.33 | 0 | -100.00 | ||||
| 2025-08-14 | 13F | Raymond James Financial Inc | 5,293 | -13.12 | 288 | -2.70 | ||||
| 2025-08-14 | 13F | Quantinno Capital Management LP | 20,749 | 2.24 | 1,131 | 14.49 | ||||
| 2025-08-06 | 13F | Cloud Capital Management, LLC | 5,109 | 0.00 | 0 | |||||
| 2025-08-14 | 13F | Syon Capital Llc | 37,083 | -10.05 | 2,021 | 0.80 | ||||
| 2025-07-29 | 13F | Private Trust Co Na | 1,059 | -20.91 | 58 | -12.31 | ||||
| 2025-05-12 | 13F | Hantz Financial Services, Inc. | 0 | -100.00 | 0 | |||||
| 2025-07-24 | 13F | Ronald Blue Trust, Inc. | 173 | 0.00 | 9 | 12.50 | ||||
| 2025-08-08 | 13F | Gts Securities Llc | 3,848 | 210 | ||||||
| 2025-08-14 | 13F | BTG Pactual Asset Management US LLC | 178 | 10 | ||||||
| 2025-08-14 | 13F | Citadel Advisors Llc | Call | 0 | -100.00 | 0 | ||||
| 2025-07-16 | 13F | Badgley Phelps Wealth Managers, LLC | 243,473 | 0.33 | 13,269 | 12.40 | ||||
| 2025-08-11 | 13F | Covestor Ltd | 24 | -14.29 | 0 | |||||
| 2025-08-14 | 13F | Citadel Advisors Llc | 77,784 | 1,048.44 | 4,239 | 1,188.45 | ||||
| 2025-08-15 | 13F | Keel Point, LLC | 39,990 | -9.10 | 2,179 | 1.82 | ||||
| 2025-08-11 | 13F | Wealthspire Advisors, LLC | 0 | -100.00 | 0 | |||||
| 2025-07-25 | 13F | NorthRock Partners, LLC | 154 | -4.94 | 8 | 14.29 | ||||
| 2025-07-14 | 13F | AdvisorNet Financial, Inc | 39 | 0.00 | 2 | 100.00 | ||||
| 2025-07-14 | 13F | Armstrong Advisory Group, Inc | 1,366 | 0.00 | 74 | 12.12 | ||||
| 2025-08-14 | 13F | Susquehanna International Group, Llp | 57,006 | 3,107 | ||||||
| 2025-07-17 | 13F | Albion Financial Group /ut | 144 | 8 | ||||||
| 2025-08-28 | NP | Northern Lights Fund Trust - Ocean Park International ETF | 2,413 | 132 | ||||||
| 2025-08-14 | 13F | GWM Advisors LLC | 251 | -4.92 | 14 | 8.33 |
Other Listings
| MX:BBAX |