Mga Batayang Estadistika
| Pemilik Institusional | 113 total, 113 long only, 0 short only, 0 long/short - change of -4.20% MRQ |
| Alokasi Portofolio Rata-rata | 0.1082 % - change of -12.49% MRQ |
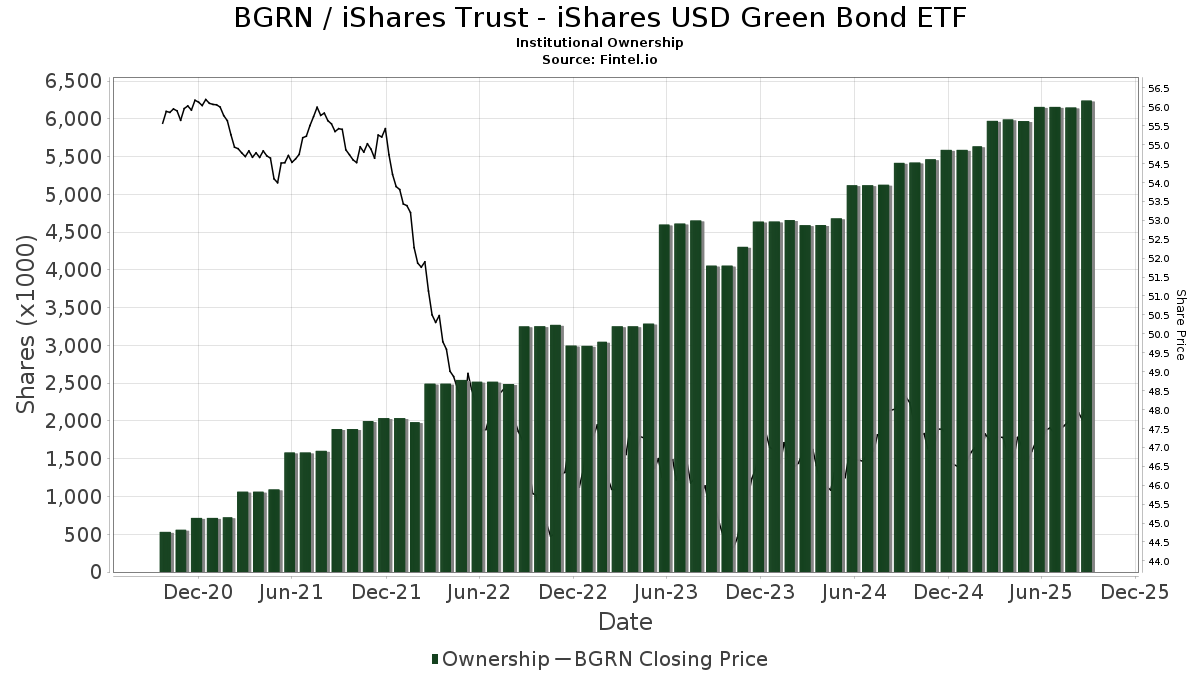
| Saham Institusional (Jangka Panjang) | 6,242,353 (ex 13D/G) - change of 0.08MM shares 1.36% MRQ |
| Nilai Institusional (Jangka Panjang) | $ 231,819 USD ($1000) |
Kepemilikan Institusional dan Pemegang Saham
iShares Trust - iShares USD Green Bond ETF (US:BGRN) memiliki 113 pemilik institusional dan pemegang saham yang telah mengajukan formulir 13D/G atau 13F kepada Komisi Bursa Efek (Securities Exchange Commission/SEC). Lembaga-lembaga ini memegang total 6,242,353 saham. Pemegang saham terbesar meliputi Betterment LLC, Empower Advisory Group, LLC, Mercer Global Advisors Inc /adv, Envestnet Asset Management Inc, Bank Of America Corp /de/, Francis Financial, Inc., Royal Bank Of Canada, LPL Financial LLC, Creative Planning, and Seeds Investor Llc .
Struktur kepemilikan institusional iShares Trust - iShares USD Green Bond ETF (NasdaqGM:BGRN) menunjukkan posisi terkini di perusahaan oleh institusi dan dana, serta perubahan terbaru dalam ukuran posisi. Pemegang saham utama dapat mencakup investor individu, reksa dana, dana lindung nilai, atau institusi. Jadwal 13D menunjukkan bahwa investor memegang (atau pernah memegang) lebih dari 5% saham perusahaan dan bermaksud (atau pernah bermaksud) untuk secara aktif mengejar perubahan strategi bisnis. Jadwal 13G menunjukkan investasi pasif lebih dari 5%.
The share price as of September 5, 2025 is 48.06 / share. Previously, on September 6, 2024, the share price was 48.08 / share. This represents a decline of 0.03% over that period.
Skor Sentimen Dana
Skor Sentimen Dana (sebelumnya dikenal sebagai Skor Akumulasi Kepemilikan) menemukan saham-saham yang paling banyak dibeli oleh dana. Ini adalah hasil dari model kuantitatif multi-faktor yang canggih yang mengidentifikasi perusahaan dengan tingkat akumulasi institusional tertinggi. Model penilaian menggunakan kombinasi dari total peningkatan pemilik yang diungkapkan, perubahan dalam alokasi portofolio pada pemilik tersebut, dan metrik lainnya. Angka berkisar dari 0 hingga 100, dengan angka yang lebih tinggi menunjukkan tingkat akumulasi yang lebih tinggi dibandingkan dengan perusahaan sejenisnya, dan 50 adalah rata-ratanya.
Frekuensi Pembaruan: Setiap Hari
Lihat Ownership Explorer, yang menyediakan daftar perusahaan dengan peringkat tertinggi.
Rasio Put/Call Institusional
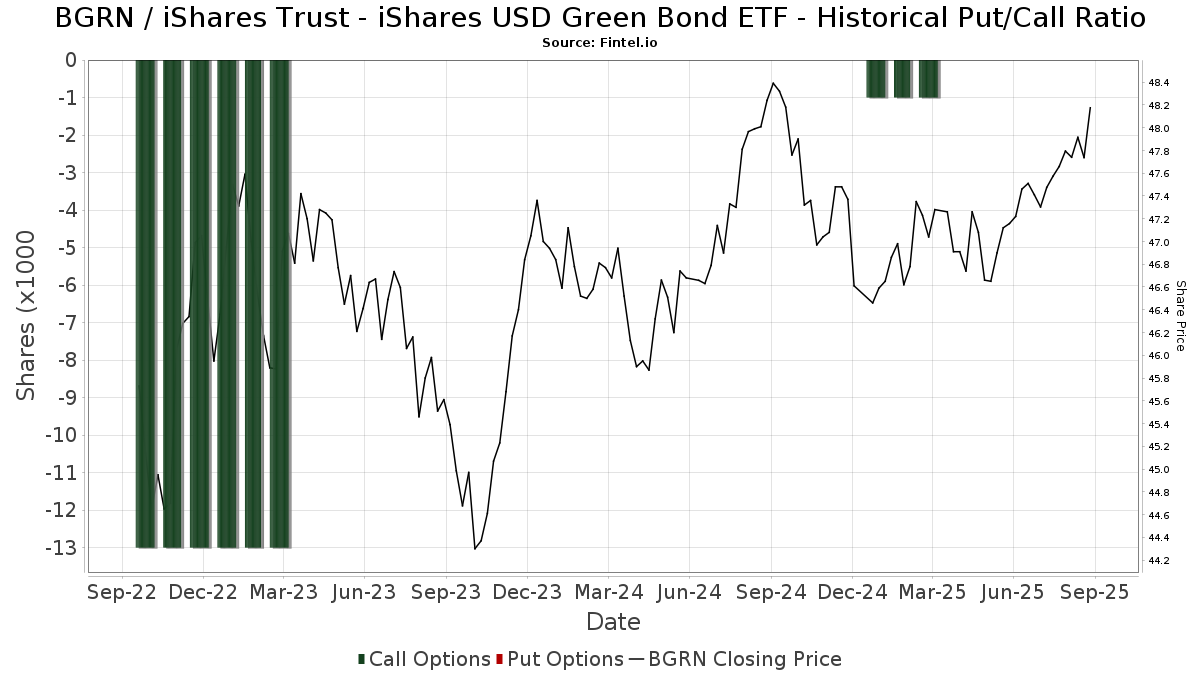
Selain melaporkan isu ekuitas dan utang standar, institusi dengan aset di bawah manajemen lebih dari 100 juta dolar AS juga harus mengungkapkan kepemilikan opsi put dan call mereka. Karena opsi put umumnya menunjukkan sentimen negatif, dan opsi call menunjukkan sentimen positif, kita dapat mengetahui sentimen institusional secara keseluruhan dengan memplot rasio put terhadap call. Grafik di sebelah kanan memplot rasio put/call historis untuk instrumen ini.
Menggunakan Rasio Put/Call sebagai indikator sentimen investor mengatasi salah satu kekurangan utama dari penggunaan total kepemilikan institusional, yaitu sejumlah besar aset yang dikelola diinvestasikan secara pasif untuk melacak indeks. Dana yang dikelola secara pasif biasanya tidak membeli opsi, sehingga indikator rasio put/call lebih akurat dalam melacak sentimen dana yang dikelola secara aktif.
Pengajuan 13F dan NPORT
Detail pada pengajuan 13F tersedia gratis. Detail pada pengajuan NP memerlukan keanggotaan premium. Baris berwarna hijau menunjukkan posisi baru. Baris berwarna merah menunjukkan posisi yang sudah ditutup. Klik tautan ini ikon untuk melihat riwayat transaksi selengkapnya.
Tingkatkan
untuk membuka data premium dan mengekspor ke Excel ![]() .
.
| Tanggal File | Sumber | Investor | Ketik | Presyo ng Avg (Silangan) |
Saham | Δ Saham (%) |
Dilaporkan Nilai ($1000) |
Nilai Δ (%) |
Alokasi Port (%) |
|
|---|---|---|---|---|---|---|---|---|---|---|
| 2025-08-12 | 13F | SRS Capital Advisors, Inc. | 14,272 | 680 | ||||||
| 2025-08-13 | 13F | Providence Capital Advisors, LLC | 126 | 6 | ||||||
| 2025-08-04 | 13F | Assetmark, Inc | 67,385 | 2.40 | 3,212 | 3.08 | ||||
| 2025-08-14 | 13F | Atomi Financial Group, Inc. | 13,199 | 1.21 | 629 | 1.94 | ||||
| 2025-07-31 | 13F | Cambridge Investment Research Advisors, Inc. | 0 | -100.00 | 0 | |||||
| 2025-08-07 | 13F | LFA - Lugano Financial Advisors SA | 0 | -100.00 | 0 | |||||
| 2025-08-11 | 13F | Johnson Financial Group, LLC | 14,028 | 0.00 | 669 | 0.60 | ||||
| 2025-08-15 | 13F | Morgan Stanley | 6,538 | -42.14 | 312 | -41.87 | ||||
| 2025-08-07 | 13F | Brio Consultants, LLC | 18,083 | 0.04 | 862 | 0.58 | ||||
| 2025-08-18 | 13F/A | National Bank Of Canada /fi/ | 738 | 0.00 | 35 | 2.94 | ||||
| 2025-08-05 | 13F | Bank of New York Mellon Corp | 84,609 | 1.89 | 4,033 | 2.57 | ||||
| 2025-04-24 | 13F | Trust Co Of Vermont | 0 | -100.00 | 0 | |||||
| 2025-08-14 | 13F | GWM Advisors LLC | 11,137 | 4.97 | 531 | 5.58 | ||||
| 2025-07-18 | 13F | Tanager Wealth Management LLP | 14,690 | 0.00 | 700 | 0.72 | ||||
| 2025-08-12 | 13F | Pathstone Holdings, LLC | 36,187 | 1,725 | ||||||
| 2025-07-21 | 13F | Ameritas Advisory Services, LLC | 2,346 | 112 | ||||||
| 2025-08-13 | 13F | Continuum Advisory, LLC | 0 | -100.00 | 0 | |||||
| 2025-07-24 | 13F | Morton Brown Family Wealth, LLC | 3,527 | 2.17 | 168 | 3.07 | ||||
| 2025-07-22 | 13F | Mascoma Wealth Management LLC | 108 | 0.00 | 5 | 0.00 | ||||
| 2025-07-16 | 13F | Perigon Wealth Management, LLC | 4,353 | 0.00 | 208 | 0.49 | ||||
| 2025-08-05 | 13F | GPS Wealth Strategies Group, LLC | 101 | 1.00 | 5 | 0.00 | ||||
| 2025-08-14 | 13F | Mml Investors Services, Llc | 7,898 | -2.07 | 0 | |||||
| 2025-09-04 | 13F/A | Advisor Group Holdings, Inc. | 13,551 | 20.89 | 645 | 21.47 | ||||
| 2025-08-14 | 13F | Smartleaf Asset Management LLC | 63 | -70.83 | 3 | -80.00 | ||||
| 2025-07-25 | 13F | Envestnet Portfolio Solutions, Inc. | 20,301 | -46.22 | 968 | -45.89 | ||||
| 2025-07-07 | 13F | Trust Co | 1,433 | -1.98 | 68 | -1.45 | ||||
| 2025-07-16 | 13F | Falcon Wealth Planning | 15,399 | 32.50 | 734 | 33.45 | ||||
| 2025-08-13 | 13F | Northwest & Ethical Investments L.P. | 910 | 4.12 | ||||||
| 2025-08-14 | 13F/A | Bank Julius Baer & Co. Ltd, Zurich | 42,700 | 37.10 | 2,036 | 22.08 | ||||
| 2025-08-12 | 13F | Foster Dykema Cabot & Partners, Llc | 4 | 0.00 | 0 | |||||
| 2025-08-12 | 13F | MAI Capital Management | 6,902 | 0.19 | 329 | 0.92 | ||||
| 2025-08-07 | 13F | Sound View Wealth Advisors Group, LLC | 12,614 | 7.60 | 601 | 8.29 | ||||
| 2025-08-05 | 13F | Scarborough Advisors, LLC | 425 | 20 | ||||||
| 2025-07-18 | 13F/A | MJT & Associates Financial Advisory Group, Inc. | 220 | -36.78 | 10 | -37.50 | ||||
| 2025-08-14 | 13F | Raymond James Financial Inc | 68,389 | 107.12 | 3,260 | 108.57 | ||||
| 2025-08-08 | 13F | JFG Wealth Management, LLC | 0 | -100.00 | 0 | |||||
| 2025-08-01 | 13F | Fort Vancouver Investment Management, LLC | 220 | 0.00 | 10 | 0.00 | ||||
| 2025-07-25 | 13F | Atria Wealth Solutions, Inc. | 0 | -100.00 | 0 | |||||
| 2025-08-14 | 13F | Stifel Financial Corp | 5,719 | 28.00 | 273 | 28.91 | ||||
| 2025-08-14 | 13F | Ameriprise Financial Inc | 13,383 | -2.14 | 638 | -1.55 | ||||
| 2025-08-14 | 13F | Federation des caisses Desjardins du Quebec | 1,718 | 4.56 | 82 | 5.19 | ||||
| 2025-08-08 | 13F | Hartland & Co., LLC | 0 | -100.00 | 0 | |||||
| 2025-08-08 | 13F | Creative Planning | 141,099 | 11.51 | 6,726 | 12.25 | ||||
| 2025-07-25 | 13F | LRI Investments, LLC | 3,099 | 0.00 | 148 | 0.68 | ||||
| 2025-08-12 | 13F | Coston, McIsaac & Partners | 40 | 0.00 | 0 | |||||
| 2025-08-12 | 13F | Steward Partners Investment Advisory, Llc | 1,448 | 1.76 | 69 | 2.99 | ||||
| 2025-07-11 | 13F | Westfuller Advisors, LLC | 8,101 | 0.19 | 386 | 1.05 | ||||
| 2025-08-13 | 13F | Lido Advisors, LLC | 7,283 | -16.82 | 347 | -16.18 | ||||
| 2025-08-11 | 13F | HighTower Advisors, LLC | 20,344 | -23.46 | 970 | -22.97 | ||||
| 2025-07-24 | 13F | Financial Connections Group, Inc. | 1,034 | 0 | ||||||
| 2025-07-23 | 13F | Sachetta, LLC | 2,572 | 7.30 | 123 | 7.96 | ||||
| 2025-07-25 | 13F | PrairieView Partners, LLC | 14,915 | 3.15 | 1 | |||||
| 2025-07-24 | 13F | IFP Advisors, Inc | 307 | -1.29 | 15 | 0.00 | ||||
| 2025-07-09 | 13F | Fermata Advisors, LLC | 0 | -100.00 | 0 | |||||
| 2025-08-08 | 13F | Laurel Wealth Planning LLC | 63,416 | 6.94 | 3,023 | 7.66 | ||||
| 2025-08-26 | 13F/A | Thrivent Financial For Lutherans | 7,045 | 0 | ||||||
| 2025-08-13 | 13F | Twin Peaks Wealth Advisors, LLC | 97 | 5 | ||||||
| 2025-08-14 | 13F | Mercer Global Advisors Inc /adv | 747,624 | 14.42 | 35,639 | 15.17 | ||||
| 2025-08-14 | 13F | Royal Bank Of Canada | 224,446 | 3.27 | 10,699 | 3.94 | ||||
| 2025-08-01 | 13F | Equita Financial Network, Inc. | 12,408 | 46.48 | 591 | 47.38 | ||||
| 2025-04-22 | 13F | Synergy Financial Management, LLC | 0 | -100.00 | 0 | |||||
| 2025-08-13 | 13F | KilterHowling LLC | 5,529 | 0.36 | 264 | 1.94 | ||||
| 2025-08-14 | 13F | Susquehanna International Group, Llp | 0 | -100.00 | 0 | |||||
| 2025-08-14 | 13F | Fmr Llc | 43 | 2 | ||||||
| 2025-08-13 | 13F | Ally Invest Advisors Inc. | 0 | -100.00 | 0 | |||||
| 2025-08-07 | 13F | Kestra Private Wealth Services, Llc | 9,373 | 0.56 | 447 | 1.13 | ||||
| 2025-07-07 | 13F | Shotwell Rutter Baer Inc | 15,693 | -0.98 | 744 | -0.67 | ||||
| 2025-05-08 | 13F | Harbour Investments, Inc. | 0 | -100.00 | 0 | |||||
| 2025-08-12 | 13F | Proequities, Inc. | 0 | 0 | ||||||
| 2025-07-08 | 13F | Parallel Advisors, LLC | 2,378 | 0.00 | 113 | 0.89 | ||||
| 2025-08-11 | 13F | Birchbrook, Inc. | 466 | -2.71 | 22 | 0.00 | ||||
| 2025-04-25 | 13F | JNBA Financial Advisors | 0 | -100.00 | 0 | |||||
| 2025-07-18 | 13F | Bartlett & Co. Wealth Management Llc | 115 | 0.00 | 5 | 0.00 | ||||
| 2025-08-14 | 13F | Bank Of America Corp /de/ | 299,337 | 16.11 | 14,269 | 16.87 | ||||
| 2025-08-14 | 13F | Aprio Wealth Management, LLC | 14,051 | 3.94 | 670 | 4.53 | ||||
| 2025-08-14 | 13F | Modern Wealth Management, LLC | 30,718 | 78.71 | 1,464 | 79.85 | ||||
| 2025-04-24 | 13F | Elevated Capital Advisors, LLC | 0 | -100.00 | 0 | |||||
| 2025-08-13 | 13F | Jones Financial Companies Lllp | 4,554 | 17.83 | 216 | 18.68 | ||||
| 2025-08-14 | 13F | Wells Fargo & Company/mn | 34,825 | 17,758.97 | 1,660 | 18,344.44 | ||||
| 2025-04-22 | 13F | PFG Investments, LLC | 0 | -100.00 | 0 | |||||
| 2025-08-05 | 13F | Dunhill Financial, LLC | 84 | 0.00 | 4 | 33.33 | ||||
| 2025-08-05 | 13F | Bank Of Montreal /can/ | 3,332 | 0.00 | 159 | 0.64 | ||||
| 2025-07-17 | 13F | XY Planning Network, Inc. | 5,386 | 2.73 | 257 | 3.23 | ||||
| 2025-07-09 | 13F | Archer Investment Management, LLC | 11,149 | 0.00 | 531 | 0.57 | ||||
| 2025-07-15 | 13F | Carr Financial Group Corp | 0 | -100.00 | 0 | |||||
| 2025-08-12 | 13F | Ameritas Investment Partners, Inc. | 9,469 | 4.05 | 451 | 4.88 | ||||
| 2025-08-14 | 13F | UBS Group AG | 71,932 | -3.44 | 3,429 | -2.81 | ||||
| 2025-07-08 | 13F | First National Corp /ma/ /adv | 5,604 | 3.09 | 267 | 3.89 | ||||
| 2025-05-15 | 13F | Tower Research Capital LLC (TRC) | 0 | -100.00 | 0 | |||||
| 2025-07-14 | 13F | Pacifica Partners Inc. | 417 | 0.00 | 20 | 0.00 | ||||
| 2025-07-16 | 13F | Signature Resources Capital Management, LLC | 73 | 114.71 | 3 | 200.00 | ||||
| 2025-08-05 | 13F | Plante Moran Financial Advisors, LLC | 65 | 3 | ||||||
| 2025-07-23 | 13F | 1 North Wealth Services Llc | 85 | 0.00 | 4 | 0.00 | ||||
| 2025-08-11 | 13F | Citigroup Inc | 9,943 | -10.06 | 474 | -9.56 | ||||
| 2025-08-08 | 13F | Empower Advisory Group, LLC | 1,062,274 | 1.13 | 50,639 | 1.79 | ||||
| 2025-08-08 | 13F | Emerald Investment Partners, Llc | 2,359 | -0.42 | 112 | 0.00 | ||||
| 2025-08-12 | 13F | LPL Financial LLC | 141,492 | 18.25 | 6,745 | 19.03 | ||||
| 2025-08-08 | 13F | Omega Financial Group, LLC | 18,062 | 1.99 | 861 | 2.74 | ||||
| 2025-07-25 | 13F | Richardson Financial Services Inc. | 785 | 0.00 | 37 | 0.00 | ||||
| 2025-08-11 | 13F | CBIZ Investment Advisory Services, LLC | 1,080 | 1.12 | 51 | 2.00 | ||||
| 2025-08-08 | 13F | Smithfield Trust Co | 920 | 0.00 | 0 | |||||
| 2025-07-29 | 13F | Private Wealth Management Group, LLC | 24,969 | -0.99 | 1,190 | -0.34 | ||||
| 2025-08-14 | 13F | Jane Street Group, Llc | 0 | -100.00 | 0 | |||||
| 2025-04-17 | 13F | Stewardship Advisors, LLC | 0 | -100.00 | 0 | |||||
| 2025-07-11 | 13F | Farther Finance Advisors, LLC | 0 | -100.00 | 0 | |||||
| 2025-07-09 | 13F | Dynamic Advisor Solutions LLC | 16,959 | 3.86 | 808 | 4.53 | ||||
| 2025-08-08 | 13F | Cetera Investment Advisers | 51,807 | -43.88 | 2,470 | -43.53 | ||||
| 2025-07-31 | 13F | Wealthfront Advisers Llc | 24,602 | 26.35 | 1,173 | 27.11 | ||||
| 2025-05-02 | 13F | Invera Wealth Advisors, LLC | 22,758 | 12.07 | 1,078 | 13.85 | ||||
| 2025-07-28 | 13F | DORVAL Corp | 5,738 | 0.00 | 274 | 0.37 | ||||
| 2025-08-08 | 13F | Francis Financial, Inc. | 253,244 | -31.51 | 12,072 | -31.06 | ||||
| 2025-08-12 | 13F | Archer Investment Corp | 463 | 0.00 | 22 | 4.76 | ||||
| 2025-08-12 | 13F | CIBC Private Wealth Group, LLC | 4,070 | 0.00 | 194 | 2.65 | ||||
| 2025-08-06 | 13F | Walkner Condon Financial Advisors LLC | 20,600 | -12.13 | 982 | -11.53 | ||||
| 2025-04-18 | 13F | Halbert Hargrove Global Advisors, Llc | 0 | -100.00 | 0 | -100.00 | ||||
| 2025-07-30 | 13F | Financial Perspectives, Inc | 355 | 0.85 | 17 | 0.00 | ||||
| 2025-08-11 | 13F | Plum Street Advisors, LLC | 29,569 | -4.78 | 1,410 | -4.15 | ||||
| 2025-08-14 | 13F | Colony Group, LLC | 4,238 | 202 | ||||||
| 2025-08-05 | 13F | Blue Barn Wealth, LLC | 21,188 | 3.74 | 1,010 | 4.45 | ||||
| 2025-08-08 | 13F | Larson Financial Group LLC | 76 | 72.73 | 4 | 50.00 | ||||
| 2025-08-08 | 13F | Better Money Decisions, LLC | 16,112 | 2.30 | 768 | 3.09 | ||||
| 2025-08-15 | 13F | Kestra Advisory Services, LLC | 8,025 | 30.76 | 383 | 31.72 | ||||
| 2025-08-14 | 13F | Betterment LLC | 1,310,676 | -0.82 | 62 | 0.00 | ||||
| 2025-08-12 | 13F | Jpmorgan Chase & Co | 0 | -100.00 | 0 | |||||
| 2025-07-21 | 13F | Cliftonlarsonallen Wealth Advisors, Llc | 39,105 | -1.08 | 1,864 | -0.43 | ||||
| 2025-05-14 | 13F | Hsbc Holdings Plc | 0 | -100.00 | 0 | |||||
| 2025-08-14 | 13F | Clarity Asset Management, Inc. | 1,489 | 0.13 | 71 | 1.43 | ||||
| 2025-07-25 | 13F | Cwm, Llc | 1,495 | 0.20 | 0 | |||||
| 2025-08-11 | 13F | Principal Securities, Inc. | 8,668 | 25.44 | 413 | 28.26 | ||||
| 2025-08-14 | 13F | Lavaca Capital Llc | Call | 0 | -100.00 | 0 | ||||
| 2025-08-13 | 13F | Congress Wealth Management LLC / DE / | 5,423 | 21.84 | 259 | 22.86 | ||||
| 2025-07-23 | 13F | Vontobel Holding Ltd. | 11,786 | 0.00 | 562 | 0.54 | ||||
| 2025-08-01 | 13F | Envestnet Asset Management Inc | 659,577 | 3.58 | 31,442 | 4.26 | ||||
| 2025-05-02 | 13F | BlackRock, Inc. | 0 | -100.00 | 0 | |||||
| 2025-08-15 | 13F | WFA of San Diego, LLC | 1,341 | 0.00 | 64 | -1.56 | ||||
| 2025-08-07 | 13F | Allworth Financial LP | 119 | 0.00 | 6 | 0.00 | ||||
| 2025-08-06 | 13F | Commonwealth Equity Services, Llc | 35,426 | 12.39 | 2 | 0.00 | ||||
| 2025-07-31 | 13F | Cardinal Point Capital Management, ULC | 12,154 | 37.50 | 579 | 38.52 | ||||
| 2025-08-12 | 13F | Seeds Investor Llc | 112,730 | -4.96 | 5,374 | -4.34 | ||||
| 2025-08-12 | 13F | Franklin Resources Inc | 18,354 | 1.07 | 875 | 1.63 | ||||
| 2025-04-21 | 13F | Nelson, Van Denburg & Campbell Wealth Management Group, LLC | 0 | -100.00 | 0 | |||||
| 2025-08-14 | 13F | Citadel Advisors Llc | 0 | -100.00 | 0 |