Mga Batayang Estadistika
| Pemilik Institusional | 129 total, 129 long only, 0 short only, 0 long/short - change of 4.00% MRQ |
| Alokasi Portofolio Rata-rata | 0.5069 % - change of 8.69% MRQ |
| Saham Institusional (Jangka Panjang) | 11,488,097 (ex 13D/G) - change of 2.09MM shares 22.21% MRQ |
| Nilai Institusional (Jangka Panjang) | $ 515,090 USD ($1000) |
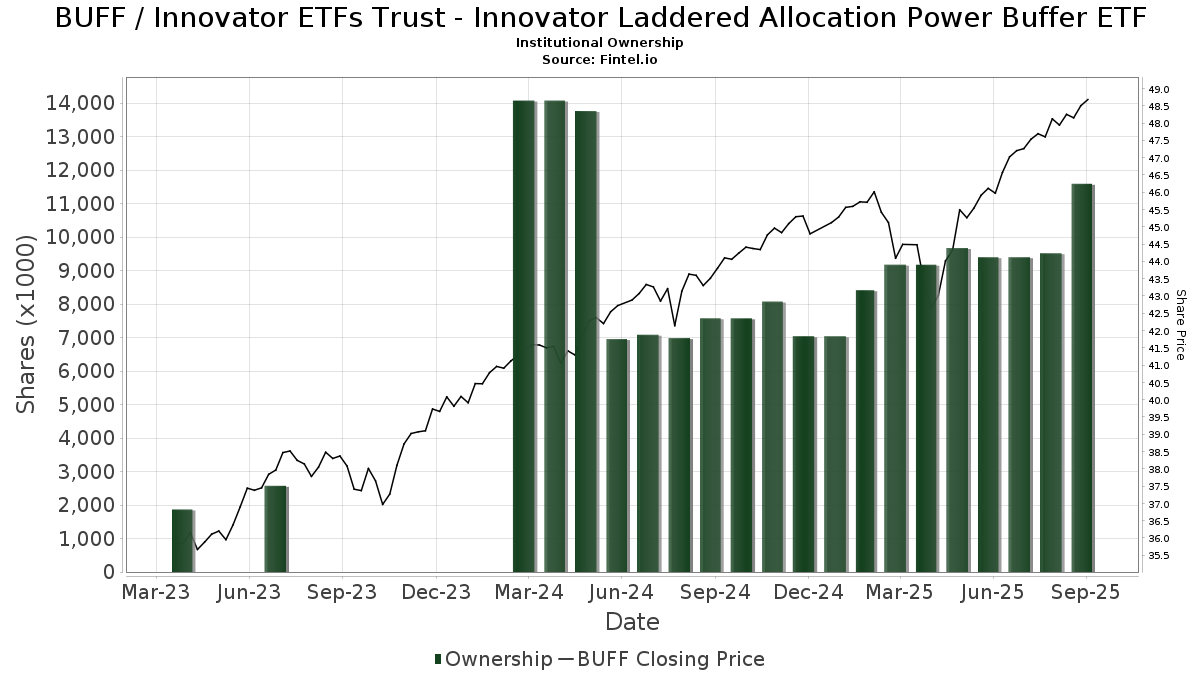
Kepemilikan Institusional dan Pemegang Saham
Innovator ETFs Trust - Innovator Laddered Allocation Power Buffer ETF (US:BUFF) memiliki 129 pemilik institusional dan pemegang saham yang telah mengajukan formulir 13D/G atau 13F kepada Komisi Bursa Efek (Securities Exchange Commission/SEC). Lembaga-lembaga ini memegang total 11,488,097 saham. Pemegang saham terbesar meliputi LPL Financial LLC, Envestnet Asset Management Inc, GGM Financials LLC, Kingsview Wealth Management, LLC, Kfg Wealth Management, Llc, Cetera Investment Advisers, Advisor Group Holdings, Inc., Prasad Wealth Partners, LLC, Holos Integrated Wealth LLC, and Raymond James Financial Inc .
Struktur kepemilikan institusional Innovator ETFs Trust - Innovator Laddered Allocation Power Buffer ETF (BATS:BUFF) menunjukkan posisi terkini di perusahaan oleh institusi dan dana, serta perubahan terbaru dalam ukuran posisi. Pemegang saham utama dapat mencakup investor individu, reksa dana, dana lindung nilai, atau institusi. Jadwal 13D menunjukkan bahwa investor memegang (atau pernah memegang) lebih dari 5% saham perusahaan dan bermaksud (atau pernah bermaksud) untuk secara aktif mengejar perubahan strategi bisnis. Jadwal 13G menunjukkan investasi pasif lebih dari 5%.
The share price as of September 3, 2025 is 48.20 / share. Previously, on September 4, 2024, the share price was 43.30 / share. This represents an increase of 11.32% over that period.
Skor Sentimen Dana
Skor Sentimen Dana (sebelumnya dikenal sebagai Skor Akumulasi Kepemilikan) menemukan saham-saham yang paling banyak dibeli oleh dana. Ini adalah hasil dari model kuantitatif multi-faktor yang canggih yang mengidentifikasi perusahaan dengan tingkat akumulasi institusional tertinggi. Model penilaian menggunakan kombinasi dari total peningkatan pemilik yang diungkapkan, perubahan dalam alokasi portofolio pada pemilik tersebut, dan metrik lainnya. Angka berkisar dari 0 hingga 100, dengan angka yang lebih tinggi menunjukkan tingkat akumulasi yang lebih tinggi dibandingkan dengan perusahaan sejenisnya, dan 50 adalah rata-ratanya.
Frekuensi Pembaruan: Setiap Hari
Lihat Ownership Explorer, yang menyediakan daftar perusahaan dengan peringkat tertinggi.
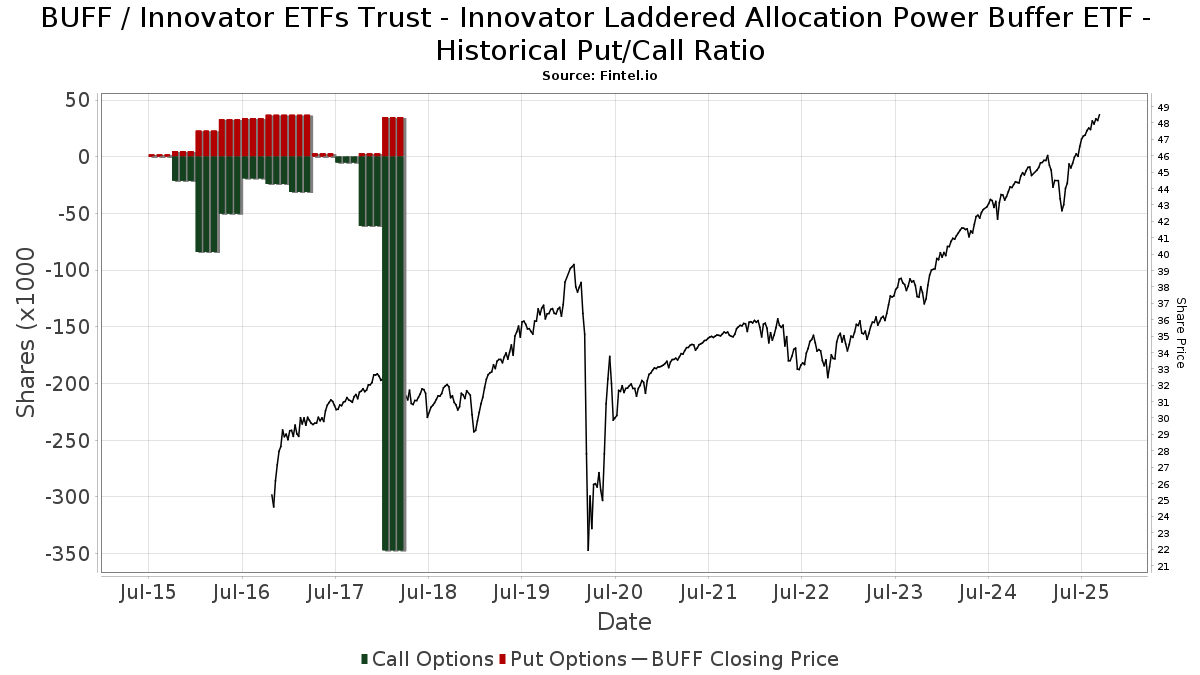
Rasio Put/Call Institusional
Selain melaporkan isu ekuitas dan utang standar, institusi dengan aset di bawah manajemen lebih dari 100 juta dolar AS juga harus mengungkapkan kepemilikan opsi put dan call mereka. Karena opsi put umumnya menunjukkan sentimen negatif, dan opsi call menunjukkan sentimen positif, kita dapat mengetahui sentimen institusional secara keseluruhan dengan memplot rasio put terhadap call. Grafik di sebelah kanan memplot rasio put/call historis untuk instrumen ini.
Menggunakan Rasio Put/Call sebagai indikator sentimen investor mengatasi salah satu kekurangan utama dari penggunaan total kepemilikan institusional, yaitu sejumlah besar aset yang dikelola diinvestasikan secara pasif untuk melacak indeks. Dana yang dikelola secara pasif biasanya tidak membeli opsi, sehingga indikator rasio put/call lebih akurat dalam melacak sentimen dana yang dikelola secara aktif.
Pengajuan 13F dan NPORT
Detail pada pengajuan 13F tersedia gratis. Detail pada pengajuan NP memerlukan keanggotaan premium. Baris berwarna hijau menunjukkan posisi baru. Baris berwarna merah menunjukkan posisi yang sudah ditutup. Klik tautan ini ikon untuk melihat riwayat transaksi selengkapnya.
Tingkatkan
untuk membuka data premium dan mengekspor ke Excel ![]() .
.
| Tanggal File | Sumber | Investor | Ketik | Presyo ng Avg (Silangan) |
Saham | Δ Saham (%) |
Dilaporkan Nilai ($1000) |
Nilai Δ (%) |
Alokasi Port (%) |
|
|---|---|---|---|---|---|---|---|---|---|---|
| 2025-07-25 | 13F | Hazlett, Burt & Watson, Inc. | 26,702 | 3,503.51 | 1 | |||||
| 2025-07-22 | 13F | Wealthcare Advisory Partners LLC | 40,409 | 94.77 | 1,899 | 107.77 | ||||
| 2025-08-07 | 13F | Sound View Wealth Advisors Group, LLC | 30,370 | -1.10 | 1,427 | 5.47 | ||||
| 2025-07-14 | 13F | Buska Wealth Management, LLC | 231,838 | 114.03 | 10,896 | 128.19 | ||||
| 2025-07-25 | 13F | Atria Wealth Solutions, Inc. | 53,914 | -11.66 | 2,534 | -5.84 | ||||
| 2025-08-01 | 13F/A | GGM Financials LLC | 504,153 | 3.59 | 23,695 | 10.43 | ||||
| 2025-08-12 | 13F | J.w. Cole Advisors, Inc. | 14,951 | 0.00 | 703 | 6.53 | ||||
| 2025-07-30 | 13F | Caliber Wealth Management, LLC / KS | 10,247 | 482 | ||||||
| 2025-04-17 | 13F | Atlas Private Wealth Advisors | 0 | -100.00 | 0 | |||||
| 2025-07-21 | 13F | Seros Financial, LLC | 74,894 | 1.36 | 3,520 | 8.07 | ||||
| 2025-07-22 | 13F | Merit Financial Group, LLC | 71,361 | 12.70 | 3,354 | 20.14 | ||||
| 2025-07-25 | 13F | Cwm, Llc | 346 | -34.59 | 0 | |||||
| 2025-07-31 | 13F | Cambridge Investment Research Advisors, Inc. | 169,334 | -0.34 | 8 | 0.00 | ||||
| 2025-08-14 | 13F | Wells Fargo & Company/mn | 0 | 0 | ||||||
| 2025-08-05 | 13F | Bank of New York Mellon Corp | 13,392 | 0.01 | 629 | 6.61 | ||||
| 2025-07-10 | 13F | Sovran Advisors, LLC | 20,919 | -77.47 | 985 | -75.15 | ||||
| 2025-07-30 | 13F | IMG Wealth Management, Inc. | 6,953 | 0.00 | 327 | 6.54 | ||||
| 2025-08-11 | 13F | Principal Securities, Inc. | 24,618 | 222.61 | 1,157 | 238.30 | ||||
| 2025-04-22 | 13F | Castleview Partners, Llc | 0 | -100.00 | 0 | |||||
| 2025-08-04 | 13F | Atria Investments Llc | 19,333 | -1.86 | 909 | 4.61 | ||||
| 2025-08-12 | 13F | LPL Financial LLC | 2,790,469 | 224.86 | 131,152 | 246.30 | ||||
| 2025-08-08 | 13F | Collaborative Wealth Managment Inc. | 28,927 | 8.65 | 1,360 | 15.86 | ||||
| 2025-08-12 | 13F | Change Path, LLC | 67,615 | 8.98 | 3,178 | 16.16 | ||||
| 2025-07-22 | 13F | Siligmueller & Norvid Wealth Advisors LLC | 13,829 | 102.50 | 654 | 116.94 | ||||
| 2025-08-13 | 13F | BCJ Capital Management, LLC | 10,115 | 5.57 | 475 | 12.56 | ||||
| 2025-07-30 | 13F | Onyx Bridge Wealth Group LLC | 9,750 | 0.00 | 458 | 6.76 | ||||
| 2025-07-17 | 13F | Applied Capital LLC | 5,225 | -42.07 | 246 | -38.29 | ||||
| 2025-08-06 | 13F | AE Wealth Management LLC | 2,150 | -96.74 | 101 | -96.53 | ||||
| 2025-07-15 | 13F | Armis Advisers, LLC | 33,894 | 0.00 | 1,593 | 6.63 | ||||
| 2025-07-30 | 13F | Brookstone Capital Management | 132,342 | 5.98 | 6,220 | 12.99 | ||||
| 2025-08-14 | 13F | Planwiser Financial, Llc | 45,422 | -29.00 | 2,169 | -23.53 | ||||
| 2025-08-11 | 13F | HighTower Advisors, LLC | 161,890 | 9.50 | 7,609 | 16.72 | ||||
| 2025-07-18 | 13F | Trilogy Capital Inc. | 0 | -100.00 | 0 | |||||
| 2025-08-15 | 13F | Kestra Advisory Services, LLC | 93,213 | 104.22 | 4,381 | 117.74 | ||||
| 2025-07-10 | 13F | Atticus Wealth Management, Llc | 520 | 24 | ||||||
| 2025-08-14 | 13F | Garden State Investment Advisory Services LLC | 104,439 | -2.50 | 4,909 | 3.94 | ||||
| 2025-07-30 | 13F | Capstone Triton Financial Group, LLC | 6,853 | 26.98 | 322 | 33.06 | ||||
| 2025-08-12 | 13F | MAI Capital Management | 137 | 0.00 | 6 | 0.00 | ||||
| 2025-08-13 | 13F | Holos Integrated Wealth LLC | 308,564 | 5.78 | 14,765 | 14.81 | ||||
| 2025-08-08 | 13F | Cetera Investment Advisers | 400,966 | 4.81 | 18,845 | 11.72 | ||||
| 2025-08-05 | 13F | Sigma Planning Corp | 4,824 | -30.66 | 227 | -26.14 | ||||
| 2025-08-13 | 13F | Townsquare Capital Llc | 0 | -100.00 | 0 | |||||
| 2025-07-30 | 13F | Strategic Blueprint, LLC | 18,436 | 45.57 | 866 | 55.20 | ||||
| 2025-07-30 | 13F | LifeWealth Investments, LLC | 227,813 | 27.67 | 10,707 | 36.10 | ||||
| 2025-07-16 | 13F | Vestia Personal Wealth Advisors | 36,352 | -2.92 | 1,709 | 3.45 | ||||
| 2025-08-08 | 13F | Avantax Advisory Services, Inc. | 111,783 | 10.75 | 5,254 | 18.04 | ||||
| 2025-08-11 | 13F | Bellwether Advisors, LLC | 8,396 | -20.76 | 395 | -15.63 | ||||
| 2025-07-21 | 13F | DHJJ Financial Advisors, Ltd. | 6,799 | -7.05 | 320 | -0.93 | ||||
| 2025-07-03 | 13F | City Center Advisors, LLC | 18,884 | -13.87 | 888 | -8.18 | ||||
| 2025-07-28 | 13F | Mutual Advisors, LLC | 199,053 | 2.25 | 9,499 | 11.60 | ||||
| 2025-08-25 | 13F | BLVD Private Wealth, LLC | 6,590 | 310 | ||||||
| 2025-08-14 | 13F | Susquehanna International Group, Llp | 35,418 | -69.30 | 1,665 | -67.28 | ||||
| 2025-08-14 | 13F | Mml Investors Services, Llc | 91,966 | 2.66 | 4 | 33.33 | ||||
| 2025-08-13 | 13F | Colonial Trust Co / SC | 629 | 0.00 | 30 | 7.41 | ||||
| 2025-07-25 | 13F | Concurrent Investment Advisors, LLC | 12,599 | 592 | ||||||
| 2025-08-14 | 13F | Jane Street Group, Llc | 109,591 | 402.46 | 5,151 | 435.90 | ||||
| 2025-08-13 | 13F | VestGen Advisors, LLC | 8,384 | 399 | ||||||
| 2025-08-04 | 13F | JDM Financial Group LLC | 40,843 | 0.30 | 1,920 | 6.91 | ||||
| 2025-07-28 | 13F | BRYN MAWR TRUST Co | 758 | 0.00 | 36 | 6.06 | ||||
| 2025-07-08 | 13F | Nbc Securities, Inc. | 934 | 0.00 | 0 | |||||
| 2025-07-16 | 13F | Southern Capital Advisors, Llc | 12,675 | -9.88 | 596 | -4.03 | ||||
| 2025-07-01 | 13F | Harbor Investment Advisory, Llc | 3,230 | 0.00 | 152 | 6.34 | ||||
| 2025-08-14 | 13F | Mpwm Advisory Solutions, Llc | 15,360 | 0.00 | 722 | 6.50 | ||||
| 2025-08-04 | 13F | Assetmark, Inc | 0 | -100.00 | 0 | |||||
| 2025-07-10 | 13F | Signal Advisors Wealth, LLC | 6,742 | 317 | ||||||
| 2025-08-14 | 13F | CoreCap Advisors, LLC | 11,446 | 18.07 | 538 | 25.76 | ||||
| 2025-04-24 | 13F | Philip James Wealth Mangement, LLC | 0 | -100.00 | 0 | |||||
| 2025-08-14 | 13F | Old Mission Capital Llc | 12,603 | 592 | ||||||
| 2025-08-12 | 13F | Steward Partners Investment Advisory, Llc | 19,208 | 2.92 | 903 | 9.73 | ||||
| 2025-07-31 | 13F | Stegent Equity Advisors, Inc. | 10,326 | 0.00 | 485 | 6.59 | ||||
| 2025-08-12 | 13F | Maripau Wealth Management Llc | 5,616 | 264 | ||||||
| 2025-08-14 | 13F | Harvest Investment Services, LLC | 6,900 | 0.00 | 324 | 6.58 | ||||
| 2025-07-14 | 13F | Kfg Wealth Management, Llc | 422,151 | 3.76 | 19,841 | 10.61 | ||||
| 2025-08-12 | 13F | Weaver Consulting Group | 16,718 | 9.94 | 786 | 17.16 | ||||
| 2025-08-04 | 13F | Creative Financial Designs Inc /adv | 0 | -100.00 | 0 | |||||
| 2025-07-31 | 13F | Guardian Financial Partners, LLC | 0 | -100.00 | 0 | |||||
| 2025-07-21 | 13F | Andina Capital Management, LLC | 55,161 | 35.08 | 2,593 | 44.00 | ||||
| 2025-07-16 | 13F | Arlington Capital Management, Inc. | 0 | -100.00 | 0 | |||||
| 2025-08-11 | 13F | Private Advisor Group, LLC | 29,280 | 13.40 | 1,376 | 20.91 | ||||
| 2025-07-30 | 13F | Red Crane Wealth Management, Llc | 6,020 | -4.28 | 283 | 1.81 | ||||
| 2025-08-05 | 13F | Milestone Asset Management, Llc | 48,599 | -1.46 | 2,284 | 5.06 | ||||
| 2025-08-14 | 13F | Diversify Wealth Management, Llc | 33,248 | 11.93 | 1,595 | 22.41 | ||||
| 2025-05-15 | 13F | Integrated Wealth Concepts LLC | 0 | -100.00 | 0 | |||||
| 2025-05-15 | 13F | Citadel Advisors Llc | 0 | -100.00 | 0 | |||||
| 2025-08-14 | 13F | Visionary Wealth Advisors | 89,776 | -2.94 | 4,219 | 3.46 | ||||
| 2025-07-14 | 13F | AdvisorNet Financial, Inc | 9,837 | -11.19 | 462 | -5.33 | ||||
| 2025-07-22 | 13F | Comprehensive Financial Consultants Institutional, Inc. | 36,574 | -0.67 | 1,719 | 5.85 | ||||
| 2025-08-08 | 13F | Kingsview Wealth Management, LLC | 497,538 | -8.27 | 23,384 | -2.22 | ||||
| 2025-07-14 | 13F | Southland Equity Partners LLC | 52,378 | -0.58 | 2,462 | 5.99 | ||||
| 2025-07-17 | 13F | Janney Montgomery Scott LLC | 5,339 | 0.00 | 0 | |||||
| 2025-07-10 | 13F | Focus Financial Network, Inc. | 53,810 | -10.50 | 2,529 | -4.57 | ||||
| 2025-07-28 | 13F | Harbour Investments, Inc. | 164,210 | 1.07 | 7,718 | 7.73 | ||||
| 2025-07-29 | 13F | Stratos Wealth Partners, LTD. | 59,156 | 100.22 | 2,780 | 113.52 | ||||
| 2025-08-12 | 13F | Bedel Financial Consulting, Inc. | 4,568 | -20.03 | 215 | -15.08 | ||||
| 2025-07-23 | 13F | Prasad Wealth Partners, LLC | 371,690 | -5.58 | 17,469 | 0.65 | ||||
| 2025-08-04 | 13F | AlphaStar Capital Management, LLC | 10,330 | 24.91 | 486 | 33.24 | ||||
| 2025-08-06 | 13F | Soltis Investment Advisors LLC | 29,819 | 0.23 | 1,401 | 6.86 | ||||
| 2025-08-05 | 13F | GPS Wealth Strategies Group, LLC | 11,994 | 7.39 | 564 | 14.43 | ||||
| 2025-08-11 | 13F | Capital Square, LLC | 8,768 | 13.96 | 413 | 21.83 | ||||
| 2025-08-15 | 13F | Morgan Stanley | 3,295 | 0.00 | 155 | 6.21 | ||||
| 2025-08-04 | 13F | IFG Advisory, LLC | 59,285 | 0.73 | 2,786 | 7.40 | ||||
| 2025-08-12 | 13F | Proequities, Inc. | 0 | 0 | ||||||
| 2025-08-06 | 13F | Commonwealth Equity Services, Llc | 229,662 | -1.24 | 11 | 0.00 | ||||
| 2025-08-13 | 13F | Ofc Financial Planning, Llc | 22,396 | 1.32 | 1,053 | 8.01 | ||||
| 2025-08-08 | 13F | Davies Financial Advisors, Inc. | 5,269 | 0.00 | 248 | 6.47 | ||||
| 2025-07-09 | 13F | Channel Wealth Llc | 42,954 | -55.37 | 2,019 | -52.44 | ||||
| 2025-07-22 | 13F | Diligent Investors, LLC | 42,895 | 0.01 | 2,016 | 6.61 | ||||
| 2025-07-07 | 13F | Thurston, Springer, Miller, Herd & Titak, Inc. | 1,025 | 48 | ||||||
| 2025-08-14 | 13F | Financial Network Wealth Advisors LLC | 46,767 | -6.50 | 2,198 | -0.32 | ||||
| 2025-07-29 | 13F | BKD Wealth Advisors, LLC | 142,715 | 46.16 | 6,708 | 55.80 | ||||
| 2025-08-13 | 13F | Advisor Group Holdings, Inc. | 400,801 | -31.56 | 18,060 | -30.06 | ||||
| 2025-08-06 | 13F | Founders Financial Securities Llc | 10,949 | -1.04 | 515 | 5.98 | ||||
| 2025-08-08 | 13F | Pnc Financial Services Group, Inc. | 0 | -100.00 | 0 | |||||
| 2025-07-22 | 13F | Beacon Financial Advisory LLC | 13,832 | 650 | ||||||
| 2025-08-01 | 13F | Integral Investment Advisors, Inc. | 8,229 | -2.20 | 387 | 4.32 | ||||
| 2025-08-11 | 13F | Blue Bell Private Wealth Management, Llc | 820 | 0.00 | 39 | 5.56 | ||||
| 2025-04-29 | 13F | 4J Wealth Management LLC | 0 | -100.00 | 0 | |||||
| 2025-07-21 | 13F | Ameritas Advisory Services, LLC | 1,005 | 47 | ||||||
| 2025-07-18 | 13F | Truist Financial Corp | 10,228 | 6.66 | 481 | 13.74 | ||||
| 2025-08-13 | 13F | Cheviot Value Management, LLC | 244 | 0.00 | 12 | 10.00 | ||||
| 2025-08-14 | 13F | Acas, Llc | 28,821 | -1.94 | 1,387 | 6.70 | ||||
| 2025-07-24 | 13F | Capital Advisors, Ltd. LLC | 285 | 0.00 | 0 | |||||
| 2025-08-07 | 13F | Resources Investment Advisors, LLC. | 13,656 | 642 | ||||||
| 2025-08-08 | 13F | Capital Investment Advisory Services, LLC | 3,385 | -43.00 | 159 | -39.08 | ||||
| 2025-08-11 | 13F | Advisor Resource Council | 14,008 | 18.88 | 658 | 26.78 | ||||
| 2025-07-24 | 13F | Columbia Advisory Partners Llc | 12,104 | 569 | ||||||
| 2025-08-01 | 13F | Gwn Securities Inc. | 107,795 | 11.21 | 5,066 | 18.56 | ||||
| 2025-08-12 | 13F | Global Retirement Partners, LLC | 719 | -25.80 | 34 | -23.26 | ||||
| 2025-08-19 | 13F | Advisory Services Network, LLC | 43,430 | 8.36 | 2,068 | 17.03 | ||||
| 2025-08-14 | 13F | Raymond James Financial Inc | 240,737 | -3.02 | 11,315 | 3.38 | ||||
| 2025-08-14 | 13F | GWM Advisors LLC | 9,091 | -8.78 | 427 | -2.73 | ||||
| 2025-07-28 | 13F | Axxcess Wealth Management, Llc | 33,868 | 197.19 | 1,592 | 216.93 | ||||
| 2025-07-29 | 13F | Private Trust Co Na | 0 | -100.00 | 0 | |||||
| 2025-08-12 | 13F | Jpmorgan Chase & Co | 1,473 | -0.81 | 69 | 6.15 | ||||
| 2025-07-21 | 13F | Patriot Financial Group Insurance Agency, LLC | 29,300 | 6.45 | 1,377 | 13.52 | ||||
| 2025-07-24 | 13F | IFP Advisors, Inc | 6,788 | 15.46 | 319 | 23.17 | ||||
| 2025-08-14 | 13F | Glen Eagle Advisors, LLC | 54,173 | -3.24 | 2,546 | 3.16 | ||||
| 2025-08-06 | 13F | Golden State Wealth Management, LLC | 555 | 0.00 | 26 | 8.33 | ||||
| 2025-08-15 | 13F | Captrust Financial Advisors | 18,126 | 16.86 | 852 | 24.60 | ||||
| 2025-07-10 | 13F | Wealth Enhancement Advisory Services, Llc | 50,275 | 5.86 | 2,375 | 13.43 | ||||
| 2025-04-10 | 13F | Sugar Maple Asset Management, LLC | 0 | -100.00 | 0 | |||||
| 2025-07-09 | 13F | Lineweaver Wealth Advisors, LLC | 40,821 | 6.69 | 1,919 | 13.76 | ||||
| 2025-08-01 | 13F | Envestnet Asset Management Inc | 1,048,774 | -1.85 | 49,292 | 4.63 | ||||
| 2025-08-13 | 13F | SageView Advisory Group, LLC | 86,937 | -28.24 | 4,151 | -22.28 | ||||
| 2025-08-15 | 13F | Chapman Financial Group, Llc | 8,371 | 204.84 | 393 | 219.51 | ||||
| 2025-08-18 | 13F | Geneos Wealth Management Inc. | 1,058 | 39.21 | 50 | 48.48 |