Mga Batayang Estadistika
| Pemilik Institusional | 100 total, 100 long only, 0 short only, 0 long/short - change of -5.61% MRQ |
| Alokasi Portofolio Rata-rata | 0.2928 % - change of -8.85% MRQ |
| Saham Institusional (Jangka Panjang) | 7,674,534 (ex 13D/G) - change of -0.24MM shares -3.09% MRQ |
| Nilai Institusional (Jangka Panjang) | $ 445,906 USD ($1000) |
Kepemilikan Institusional dan Pemegang Saham
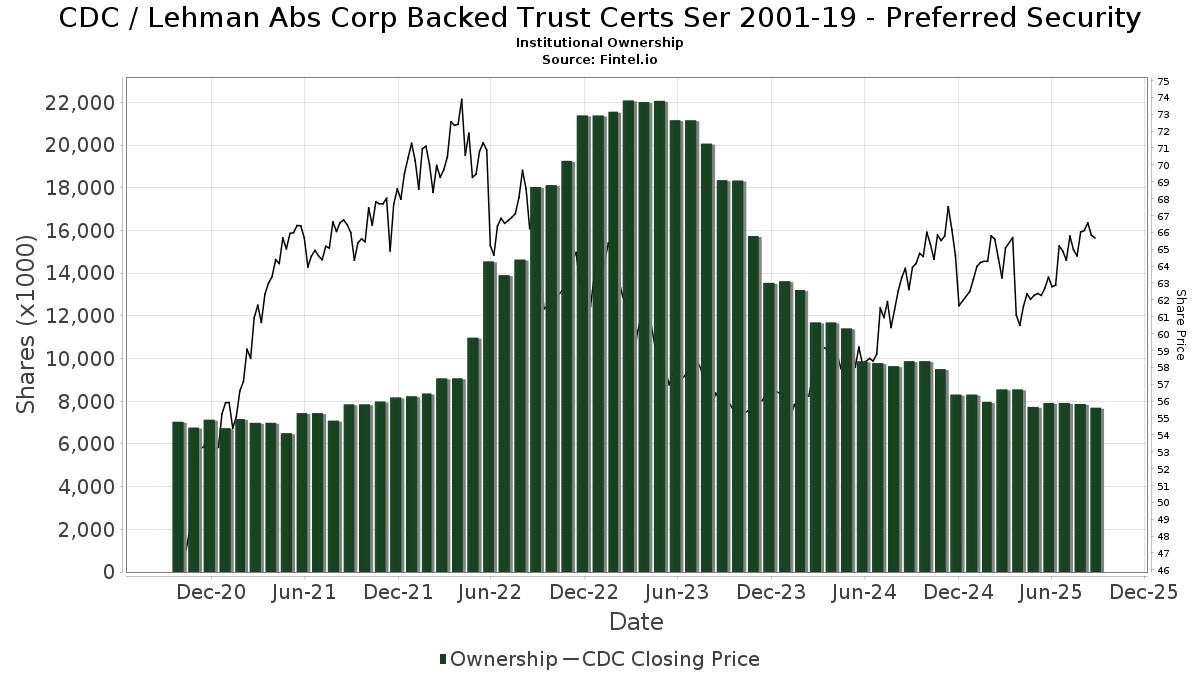
Lehman Abs Corp Backed Trust Certs Ser 2001-19 - Preferred Security (US:CDC) memiliki 100 pemilik institusional dan pemegang saham yang telah mengajukan formulir 13D/G atau 13F kepada Komisi Bursa Efek (Securities Exchange Commission/SEC). Lembaga-lembaga ini memegang total 7,674,534 saham. Pemegang saham terbesar meliputi Morgan Stanley, Raymond James Financial Inc, LPL Financial LLC, Bank Of America Corp /de/, Northwestern Mutual Wealth Management Co, SILVER OAK SECURITIES, Inc, Atlantic Family Wealth, Llc, Cwm, Llc, Royal Bank Of Canada, and Wells Fargo & Company/mn .
Struktur kepemilikan institusional Lehman Abs Corp Backed Trust Certs Ser 2001-19 - Preferred Security (OTCPK:CDC) menunjukkan posisi terkini di perusahaan oleh institusi dan dana, serta perubahan terbaru dalam ukuran posisi. Pemegang saham utama dapat mencakup investor individu, reksa dana, dana lindung nilai, atau institusi. Jadwal 13D menunjukkan bahwa investor memegang (atau pernah memegang) lebih dari 5% saham perusahaan dan bermaksud (atau pernah bermaksud) untuk secara aktif mengejar perubahan strategi bisnis. Jadwal 13G menunjukkan investasi pasif lebih dari 5%.
The share price as of September 3, 2025 is 65.80 / share. Previously, on September 4, 2024, the share price was 63.86 / share. This represents an increase of 3.04% over that period.
Skor Sentimen Dana
Skor Sentimen Dana (sebelumnya dikenal sebagai Skor Akumulasi Kepemilikan) menemukan saham-saham yang paling banyak dibeli oleh dana. Ini adalah hasil dari model kuantitatif multi-faktor yang canggih yang mengidentifikasi perusahaan dengan tingkat akumulasi institusional tertinggi. Model penilaian menggunakan kombinasi dari total peningkatan pemilik yang diungkapkan, perubahan dalam alokasi portofolio pada pemilik tersebut, dan metrik lainnya. Angka berkisar dari 0 hingga 100, dengan angka yang lebih tinggi menunjukkan tingkat akumulasi yang lebih tinggi dibandingkan dengan perusahaan sejenisnya, dan 50 adalah rata-ratanya.
Frekuensi Pembaruan: Setiap Hari
Lihat Ownership Explorer, yang menyediakan daftar perusahaan dengan peringkat tertinggi.
Rasio Put/Call Institusional
Selain melaporkan isu ekuitas dan utang standar, institusi dengan aset di bawah manajemen lebih dari 100 juta dolar AS juga harus mengungkapkan kepemilikan opsi put dan call mereka. Karena opsi put umumnya menunjukkan sentimen negatif, dan opsi call menunjukkan sentimen positif, kita dapat mengetahui sentimen institusional secara keseluruhan dengan memplot rasio put terhadap call. Grafik di sebelah kanan memplot rasio put/call historis untuk instrumen ini.
Menggunakan Rasio Put/Call sebagai indikator sentimen investor mengatasi salah satu kekurangan utama dari penggunaan total kepemilikan institusional, yaitu sejumlah besar aset yang dikelola diinvestasikan secara pasif untuk melacak indeks. Dana yang dikelola secara pasif biasanya tidak membeli opsi, sehingga indikator rasio put/call lebih akurat dalam melacak sentimen dana yang dikelola secara aktif.
Pengajuan 13F dan NPORT
Detail pada pengajuan 13F tersedia gratis. Detail pada pengajuan NP memerlukan keanggotaan premium. Baris berwarna hijau menunjukkan posisi baru. Baris berwarna merah menunjukkan posisi yang sudah ditutup. Klik tautan ini ikon untuk melihat riwayat transaksi selengkapnya.
Tingkatkan
untuk membuka data premium dan mengekspor ke Excel ![]() .
.
| Tanggal File | Sumber | Investor | Ketik | Presyo ng Avg (Silangan) |
Saham | Δ Saham (%) |
Dilaporkan Nilai ($1000) |
Nilai Δ (%) |
Alokasi Port (%) |
|
|---|---|---|---|---|---|---|---|---|---|---|
| 2025-08-05 | 13F | Tiaa Trust, National Association | 3,556 | 227 | ||||||
| 2025-08-11 | 13F | HighTower Advisors, LLC | 32,324 | 3.81 | 2,059 | 0.64 | ||||
| 2025-07-22 | 13F | Unique Wealth, Llc | 7,573 | -33.03 | 482 | -35.13 | ||||
| 2025-08-12 | 13F | Proequities, Inc. | 0 | 0 | ||||||
| 2025-08-18 | 13F | Pacific Center for Financial Services | 227 | 0.00 | 14 | 0.00 | ||||
| 2025-07-31 | 13F | Brinker Capital Investments, LLC | 0 | -100.00 | 0 | -100.00 | ||||
| 2025-08-05 | 13F | Integrity Financial Corp /WA | 3,556 | 0.03 | 227 | -3.00 | ||||
| 2025-07-25 | 13F | Atria Wealth Solutions, Inc. | 7,442 | 474 | ||||||
| 2025-08-01 | 13F | Envestnet Asset Management Inc | 167,067 | -3.36 | 10,644 | -6.31 | ||||
| 2025-08-14 | 13F | Wiley Bros.-aintree Capital, Llc | 47,032 | -0.14 | 3,018 | -1.31 | ||||
| 2025-08-15 | 13F | Equitable Holdings, Inc. | 8,364 | -0.05 | 533 | -3.10 | ||||
| 2025-08-07 | 13F | PFG Advisors | 27,684 | 7.47 | 1,764 | 4.20 | ||||
| 2025-08-14 | 13F | Ameriprise Financial Inc | 143,382 | -12.49 | 9,139 | -15.15 | ||||
| 2025-07-15 | 13F | Axis Wealth Partners, LLC | 13,063 | -0.99 | 832 | -4.04 | ||||
| 2025-08-13 | 13F | EverSource Wealth Advisors, LLC | 384 | -83.28 | 24 | -84.00 | ||||
| 2025-08-13 | 13F | Advisor Group Holdings, Inc. | 57,862 | -8.37 | 3,623 | -12.74 | ||||
| 2025-07-09 | 13F | Dynamic Advisor Solutions LLC | 4,211 | 4.39 | 268 | 1.13 | ||||
| 2025-07-24 | 13F | IFP Advisors, Inc | 3,647 | -4.25 | 232 | -7.20 | ||||
| 2025-04-21 | 13F | Nelson, Van Denburg & Campbell Wealth Management Group, LLC | 0 | -100.00 | 0 | |||||
| 2025-08-08 | 13F | Gts Securities Llc | 7,771 | 495 | ||||||
| 2025-07-30 | 13F | Smith Thornton Advisors LLC | 8,480 | -1.17 | 540 | -4.09 | ||||
| 2025-08-08 | 13F | Larson Financial Group LLC | 69 | 0.00 | 4 | 0.00 | ||||
| 2025-08-14 | 13F | Royal Bank Of Canada | 310,273 | 2.05 | 19,768 | -1.07 | ||||
| 2025-08-06 | 13F | Commonwealth Equity Services, Llc | 181,300 | -0.45 | 12 | 0.00 | ||||
| 2025-08-12 | 13F | Garrett Wealth Advisory Group, LLC | 121,243 | -0.58 | 7,724 | -3.62 | ||||
| 2025-04-30 | 13F | Alpha Cubed Investments, LLC | 0 | -100.00 | 0 | -100.00 | ||||
| 2025-08-12 | 13F | one8zero8, LLC | 3,300 | -35.42 | 210 | -37.31 | ||||
| 2025-07-21 | 13F | Patriot Financial Group Insurance Agency, LLC | 7,901 | 0.43 | 503 | -2.71 | ||||
| 2025-07-31 | 13F | Cambridge Investment Research Advisors, Inc. | 170,500 | -19.20 | 11 | -23.08 | ||||
| 2025-08-11 | 13F | Private Advisor Group, LLC | 93,487 | -1.72 | 5,956 | -4.72 | ||||
| 2025-08-01 | 13F | Advisory Alpha, LLC | 4,598 | -0.07 | 293 | -3.31 | ||||
| 2025-08-08 | 13F | Comprehensive Financial Planning, Inc./PA | 7,304 | 0.93 | 465 | -2.11 | ||||
| 2025-04-15 | 13F | Noble Wealth Management PBC | 980 | -3.64 | 64 | 1.59 | ||||
| 2025-07-25 | 13F | Cwm, Llc | 318,509 | 6.73 | 20 | 5.26 | ||||
| 2025-08-14 | 13F | Citadel Advisors Llc | 41,620 | 1,062.25 | 2,652 | 1,028.09 | ||||
| 2025-08-08 | 13F | Avantax Advisory Services, Inc. | 24,647 | -19.33 | 1,570 | -21.77 | ||||
| 2025-08-14 | 13F | Goldman Sachs Group Inc | 60,972 | 16.84 | 3,885 | 13.27 | ||||
| 2025-04-23 | 13F | Crewe Advisors LLC | 0 | -100.00 | 0 | |||||
| 2025-08-12 | 13F | J.w. Cole Advisors, Inc. | 20,698 | -22.30 | 1,319 | -24.69 | ||||
| 2025-08-06 | 13F | Rps Advisory Solutions Llc | 4,373 | -17.51 | 279 | -20.11 | ||||
| 2025-07-15 | 13F | Mather Group, Llc. | 37,805 | -0.84 | 2,409 | -3.87 | ||||
| 2025-07-29 | 13F | Private Trust Co Na | 2,200 | 0.00 | 140 | -2.78 | ||||
| 2025-08-01 | 13F | Bessemer Group Inc | 0 | -100.00 | 0 | |||||
| 2025-08-13 | 13F | Russell Investments Group, Ltd. | 11,040 | 703 | ||||||
| 2025-08-11 | 13F | Beta Wealth Group, Inc. | 0 | -100.00 | 0 | |||||
| 2025-07-28 | 13F | Harbour Investments, Inc. | 158 | 0.00 | 10 | 0.00 | ||||
| 2025-08-14 | 13F | Money Concepts Capital Corp | 51,550 | -7.05 | 3,284 | -9.88 | ||||
| 2025-08-14 | 13F | Comerica Bank | 3,203 | -0.25 | 204 | -3.32 | ||||
| 2025-07-21 | 13F | DHJJ Financial Advisors, Ltd. | 901 | 0.00 | 57 | -3.39 | ||||
| 2025-08-15 | 13F | Keel Point, LLC | 0 | -100.00 | 0 | |||||
| 2025-08-14 | 13F | UBS Group AG | 106,084 | -24.40 | 6,759 | -26.71 | ||||
| 2025-08-14 | 13F | Fmr Llc | 434 | -32.50 | 28 | -35.71 | ||||
| 2025-08-05 | 13F | Huntington National Bank | 72 | -4.05 | ||||||
| 2025-08-13 | 13F | Northwestern Mutual Wealth Management Co | 507,659 | -1.88 | 32,343 | -4.88 | ||||
| 2025-05-12 | 13F | Independent Advisor Alliance | 0 | -100.00 | 0 | |||||
| 2025-08-14 | 13F | Jane Street Group, Llc | 9,456 | 132.56 | 602 | 125.47 | ||||
| 2025-07-25 | 13F | NorthRock Partners, LLC | 2,023 | 0.00 | 129 | -3.03 | ||||
| 2025-08-15 | 13F | Morgan Stanley | 1,258,993 | -2.55 | 80,211 | -5.53 | ||||
| 2025-07-16 | 13F | Signaturefd, Llc | 0 | -100.00 | 0 | |||||
| 2025-08-19 | 13F | Newbridge Financial Services Group, Inc. | 200 | 0.00 | 13 | -7.69 | ||||
| 2025-08-12 | 13F | LPL Financial LLC | 599,519 | -2.90 | 38,195 | -5.87 | ||||
| 2025-08-14 | 13F | Operose Advisors LLC | 136 | 0.00 | 9 | 0.00 | ||||
| 2025-08-15 | 13F | Koesten, Hirschmann & Crabtree, INC. | 24 | 0.00 | 2 | 0.00 | ||||
| 2025-07-29 | 13F | Salus Financial Advisors, LLC | 18,037 | -0.62 | 1,149 | -3.61 | ||||
| 2025-08-12 | 13F | CIBC Private Wealth Group, LLC | 300 | 0.00 | 19 | 11.76 | ||||
| 2025-08-14 | 13F | Susquehanna International Group, Llp | 27,693 | 90.82 | 1,764 | 85.10 | ||||
| 2025-07-29 | 13F | Stratos Wealth Partners, LTD. | 11,364 | -4.98 | 724 | -7.77 | ||||
| 2025-08-14 | 13F | Wells Fargo & Company/mn | 238,715 | -0.53 | 15,209 | -3.57 | ||||
| 2025-07-23 | 13F | Prime Capital Investment Advisors, LLC | 0 | -100.00 | 0 | |||||
| 2025-08-14 | 13F | Old Mission Capital Llc | 4,634 | 295 | ||||||
| 2025-08-07 | 13F | Allworth Financial LP | 4,303 | 0.00 | 274 | 3.01 | ||||
| 2025-08-12 | 13F | Steward Partners Investment Advisory, Llc | 5,427 | -3.67 | 346 | -6.76 | ||||
| 2025-08-14 | 13F/A | Rockefeller Capital Management L.P. | 21,978 | -6.88 | 1,400 | -9.74 | ||||
| 2025-08-15 | 13F | Tower Research Capital LLC (TRC) | 17 | -29.17 | 1 | 0.00 | ||||
| 2025-08-11 | 13F | Advisor Resource Council | 0 | -100.00 | 0 | |||||
| 2025-03-17 | 13F/A | Wealth Enhancement Advisory Services, Llc | 0 | -100.00 | 0 | |||||
| 2025-08-12 | 13F | NWF Advisory Services Inc. | 0 | -100.00 | 0 | |||||
| 2025-08-06 | 13F | Vantage Financial Partners, LLC | 6,595 | -26.86 | 420 | -29.05 | ||||
| 2025-07-14 | 13F | Strategic Planning Group, Llc | 22,367 | 9.43 | 1,425 | 6.11 | ||||
| 2025-07-21 | 13F | Ameritas Advisory Services, LLC | 637 | 41 | ||||||
| 2025-08-12 | 13F | Park Square Financial Group, LLC | 34 | 0.00 | 2 | 0.00 | ||||
| 2025-08-14 | 13F | Bank Of America Corp /de/ | 577,860 | 1.03 | 36,815 | -2.06 | ||||
| 2025-08-14 | 13F | Sunbelt Securities, Inc. | 313 | 66.49 | 20 | 58.33 | ||||
| 2025-08-08 | 13F | Cetera Investment Advisers | 50,661 | 3.59 | 3,228 | 0.40 | ||||
| 2025-08-07 | 13F | Kestra Private Wealth Services, Llc | 9,124 | 0.39 | 581 | -2.68 | ||||
| 2025-08-11 | 13F | Aptus Capital Advisors, LLC | 248 | 0.81 | 16 | -6.25 | ||||
| 2025-08-15 | 13F | First Heartland Consultants, Inc. | 5,474 | 0.00 | 349 | -3.06 | ||||
| 2025-08-13 | 13F | Rsm Us Wealth Management Llc | 5,491 | 0.00 | 350 | -3.06 | ||||
| 2025-08-14 | 13F | Two Sigma Investments, Lp | 0 | -100.00 | 0 | |||||
| 2025-07-30 | 13F | Strategic Blueprint, LLC | 54,597 | 0.98 | 3,478 | -2.11 | ||||
| 2025-08-14 | 13F | Great Valley Advisor Group, Inc. | 9,758 | -18.59 | 622 | -21.09 | ||||
| 2025-07-30 | 13F/A | KPP Advisory Services LLC | 25,207 | -1.83 | 1,606 | -4.86 | ||||
| 2025-08-14 | 13F | Integrated Wealth Concepts LLC | 113,394 | -2.69 | 7,224 | -5.67 | ||||
| 2025-07-11 | 13F | Farther Finance Advisors, LLC | 413 | 0.00 | 26 | -3.70 | ||||
| 2025-08-14 | 13F | Becker Capital Management Inc | 0 | -100.00 | 0 | |||||
| 2025-07-11 | 13F | SILVER OAK SECURITIES, Inc | 499,265 | -2.64 | 31,808 | -4.46 | ||||
| 2025-08-14 | 13F | CoreCap Advisors, LLC | 6,789 | -2.05 | 433 | -5.05 | ||||
| 2025-08-14 | 13F | Mariner, LLC | 6,108 | 0.59 | 389 | -2.51 | ||||
| 2025-08-05 | 13F | GPS Wealth Strategies Group, LLC | 11,919 | -0.96 | 759 | -3.92 | ||||
| 2025-08-12 | 13F | Jpmorgan Chase & Co | 241 | -61.38 | 15 | -63.41 | ||||
| 2025-07-21 | 13F | Ameriflex Group, Inc. | 6,096 | 0.25 | 386 | -3.26 | ||||
| 2025-08-12 | 13F | Global Retirement Partners, LLC | 5,404 | -0.07 | 344 | 1.78 | ||||
| 2025-08-12 | 13F | Atlantic Family Wealth, Llc | 374,605 | 1.09 | 23,866 | -1.85 | ||||
| 2025-08-13 | 13F | StoneX Group Inc. | 12,570 | -0.56 | 801 | -3.61 | ||||
| 2025-08-13 | 13F | Keystone Financial Group | 33,906 | -3.97 | 2,160 | -6.90 | ||||
| 2025-08-14 | 13F | Hrt Financial Lp | 5,455 | 77.11 | 0 | |||||
| 2025-08-14 | 13F | GWM Advisors LLC | 41,889 | -4.96 | 2,669 | -7.87 | ||||
| 2025-07-08 | 13F | Nbc Securities, Inc. | 400 | 0.00 | 0 | |||||
| 2025-08-12 | 13F | Calton & Associates, Inc. | 6,161 | -7.17 | 393 | -10.09 | ||||
| 2025-07-24 | 13F | Capital Advisors, Ltd. LLC | 162 | 0.00 | 0 | |||||
| 2025-08-04 | 13F | Atria Investments Llc | 0 | -100.00 | 0 | |||||
| 2025-08-04 | 13F | Flagship Harbor Advisors, Llc | 8,571 | 0.86 | 546 | -2.15 | ||||
| 2025-08-14 | 13F | Stifel Financial Corp | 72,661 | 4.39 | 4,629 | 1.20 | ||||
| 2025-08-18 | 13F | Geneos Wealth Management Inc. | 2,682 | 22.30 | 171 | 18.06 | ||||
| 2025-05-12 | 13F | Claro Advisors LLC | 0 | -100.00 | 0 | -100.00 | ||||
| 2025-08-14 | 13F | Raymond James Financial Inc | 758,693 | -9.09 | 48,336 | -11.87 | ||||
| 2025-08-15 | 13F | Kestra Advisory Services, LLC | 18,321 | 15.07 | 1,167 | 11.57 | ||||
| 2025-05-15 | 13F | CAPROCK Group, Inc. | 43,162 | 0.33 | 2,837 | 5.35 | ||||
| 2025-07-18 | 13F | Truist Financial Corp | 38,049 | -1.24 | 2,424 | -4.23 |