Mga Batayang Estadistika
| Pemilik Institusional | 80 total, 80 long only, 0 short only, 0 long/short - change of 2.56% MRQ |
| Alokasi Portofolio Rata-rata | 0.3254 % - change of -8.64% MRQ |
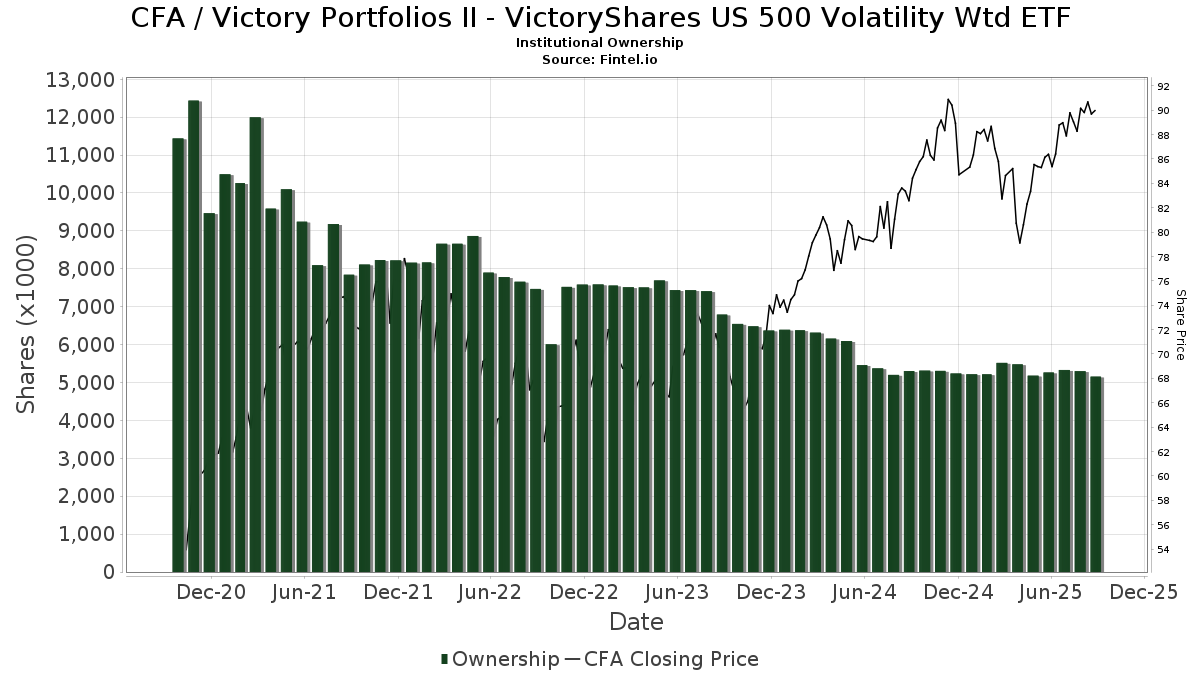
| Saham Institusional (Jangka Panjang) | 5,155,047 (ex 13D/G) - change of -0.11MM shares -2.07% MRQ |
| Nilai Institusional (Jangka Panjang) | $ 430,877 USD ($1000) |
Kepemilikan Institusional dan Pemegang Saham
Victory Portfolios II - VictoryShares US 500 Volatility Wtd ETF (US:CFA) memiliki 80 pemilik institusional dan pemegang saham yang telah mengajukan formulir 13D/G atau 13F kepada Komisi Bursa Efek (Securities Exchange Commission/SEC). Lembaga-lembaga ini memegang total 5,155,047 saham. Pemegang saham terbesar meliputi Morgan Stanley, URFRX - Target Retirement 2040 Fund, Bank Of America Corp /de/, Raymond James Financial Inc, Northwestern Mutual Wealth Management Co, URFFX - Target Retirement 2050 Fund, Wells Fargo & Company/mn, Comerica Bank, URTRX - Target Retirement 2030 Fund, and UBS Group AG .
Struktur kepemilikan institusional Victory Portfolios II - VictoryShares US 500 Volatility Wtd ETF (NasdaqGM:CFA) menunjukkan posisi terkini di perusahaan oleh institusi dan dana, serta perubahan terbaru dalam ukuran posisi. Pemegang saham utama dapat mencakup investor individu, reksa dana, dana lindung nilai, atau institusi. Jadwal 13D menunjukkan bahwa investor memegang (atau pernah memegang) lebih dari 5% saham perusahaan dan bermaksud (atau pernah bermaksud) untuk secara aktif mengejar perubahan strategi bisnis. Jadwal 13G menunjukkan investasi pasif lebih dari 5%.
The share price as of September 5, 2025 is 90.34 / share. Previously, on September 6, 2024, the share price was 81.89 / share. This represents an increase of 10.31% over that period.
Skor Sentimen Dana
Skor Sentimen Dana (sebelumnya dikenal sebagai Skor Akumulasi Kepemilikan) menemukan saham-saham yang paling banyak dibeli oleh dana. Ini adalah hasil dari model kuantitatif multi-faktor yang canggih yang mengidentifikasi perusahaan dengan tingkat akumulasi institusional tertinggi. Model penilaian menggunakan kombinasi dari total peningkatan pemilik yang diungkapkan, perubahan dalam alokasi portofolio pada pemilik tersebut, dan metrik lainnya. Angka berkisar dari 0 hingga 100, dengan angka yang lebih tinggi menunjukkan tingkat akumulasi yang lebih tinggi dibandingkan dengan perusahaan sejenisnya, dan 50 adalah rata-ratanya.
Frekuensi Pembaruan: Setiap Hari
Lihat Ownership Explorer, yang menyediakan daftar perusahaan dengan peringkat tertinggi.
Rasio Put/Call Institusional
Selain melaporkan isu ekuitas dan utang standar, institusi dengan aset di bawah manajemen lebih dari 100 juta dolar AS juga harus mengungkapkan kepemilikan opsi put dan call mereka. Karena opsi put umumnya menunjukkan sentimen negatif, dan opsi call menunjukkan sentimen positif, kita dapat mengetahui sentimen institusional secara keseluruhan dengan memplot rasio put terhadap call. Grafik di sebelah kanan memplot rasio put/call historis untuk instrumen ini.
Menggunakan Rasio Put/Call sebagai indikator sentimen investor mengatasi salah satu kekurangan utama dari penggunaan total kepemilikan institusional, yaitu sejumlah besar aset yang dikelola diinvestasikan secara pasif untuk melacak indeks. Dana yang dikelola secara pasif biasanya tidak membeli opsi, sehingga indikator rasio put/call lebih akurat dalam melacak sentimen dana yang dikelola secara aktif.
Pengajuan 13F dan NPORT
Detail pada pengajuan 13F tersedia gratis. Detail pada pengajuan NP memerlukan keanggotaan premium. Baris berwarna hijau menunjukkan posisi baru. Baris berwarna merah menunjukkan posisi yang sudah ditutup. Klik tautan ini ikon untuk melihat riwayat transaksi selengkapnya.
Tingkatkan
untuk membuka data premium dan mengekspor ke Excel ![]() .
.
| Tanggal File | Sumber | Investor | Ketik | Presyo ng Avg (Silangan) |
Saham | Δ Saham (%) |
Dilaporkan Nilai ($1000) |
Nilai Δ (%) |
Alokasi Port (%) |
|
|---|---|---|---|---|---|---|---|---|---|---|
| 2025-08-14 | 13F | Mpwm Advisory Solutions, Llc | 5,039 | 0.00 | 443 | 4.24 | ||||
| 2025-08-14 | 13F | Susquehanna International Group, Llp | 6,949 | 142.97 | 611 | 153.53 | ||||
| 2025-08-14 | 13F | Wells Fargo & Company/mn | 270,283 | -1.48 | 23,774 | 2.63 | ||||
| 2025-06-26 | NP | URFRX - Target Retirement 2040 Fund | 553,927 | 38.30 | 43,206 | 41.18 | ||||
| 2025-07-08 | 13F | Parallel Advisors, LLC | 250 | -44.44 | 22 | -43.24 | ||||
| 2025-05-19 | 13F/A | Jane Street Group, Llc | 0 | -100.00 | 0 | -100.00 | ||||
| 2025-07-25 | 13F | Cwm, Llc | 963 | 0.00 | 0 | |||||
| 2025-08-26 | NP | EVTTX - The E-Valuator Conservative/Moderate (30%-50%) RMS Fund Service Class Shares | 3,508 | 9.56 | 294 | 16.67 | ||||
| 2025-08-12 | 13F | Proequities, Inc. | 0 | 0 | ||||||
| 2025-08-11 | 13F | HighTower Advisors, LLC | 4,265 | 18.90 | 375 | 24.17 | ||||
| 2025-06-26 | NP | URFFX - Target Retirement 2050 Fund | 281,624 | 0.00 | 21,519 | -12.24 | ||||
| 2025-08-05 | 13F | Westside Investment Management, Inc. | 1,077 | -61.37 | 95 | -60.00 | ||||
| 2025-09-04 | 13F/A | Advisor Group Holdings, Inc. | 48,151 | -10.65 | 4,236 | -6.92 | ||||
| 2025-08-08 | 13F | Good Life Advisors, LLC | 2,934 | 0.00 | 258 | 4.45 | ||||
| 2025-07-25 | 13F | Atria Wealth Solutions, Inc. | 2,960 | 0.00 | 260 | 4.42 | ||||
| 2025-08-01 | 13F | Envestnet Asset Management Inc | 111,614 | -0.12 | 9,818 | 4.05 | ||||
| 2025-08-15 | 13F | Tower Research Capital LLC (TRC) | 7 | 75.00 | 1 | |||||
| 2025-08-14 | 13F | Ameriprise Financial Inc | 45,541 | -24.35 | 4,005 | -21.22 | ||||
| 2025-05-28 | 13F | Intrua Financial, LLC | 0 | -100.00 | 0 | -100.00 | ||||
| 2025-08-14 | 13F | Citadel Advisors Llc | 0 | -100.00 | 0 | |||||
| 2025-08-14 | 13F | Bank Of America Corp /de/ | 380,214 | -3.15 | 33,444 | 0.88 | ||||
| 2025-07-15 | 13F | Mather Group, Llc. | 0 | -100.00 | 0 | |||||
| 2025-08-05 | 13F | Key FInancial Inc | 400 | 0.00 | 35 | 6.06 | ||||
| 2025-08-26 | NP | EVGLX - The E-Valuator Growth (70%-85%) RMS Fund Service Class Shares | 45,443 | -0.25 | 3,813 | 6.30 | ||||
| 2025-05-06 | 13F | Wedbush Securities Inc | 0 | -100.00 | 0 | |||||
| 2025-08-05 | 13F | Claro Advisors LLC | 4,652 | 409 | ||||||
| 2025-07-24 | 13F | IFP Advisors, Inc | 2,143 | 0.14 | 188 | 4.44 | ||||
| 2025-08-26 | NP | EVAGX - The E-Valuator Aggressive Growth (85%-99%) RMS Fund Service Class Shares | 48,398 | 14.42 | 4,061 | 21.95 | ||||
| 2025-08-08 | 13F | Cetera Investment Advisers | 4,857 | -3.84 | 427 | 0.23 | ||||
| 2025-04-21 | 13F | Nelson, Van Denburg & Campbell Wealth Management Group, LLC | 0 | -100.00 | 0 | |||||
| 2025-08-13 | 13F | Level Four Advisory Services, Llc | 34,426 | -0.44 | 3,028 | 3.73 | ||||
| 2025-07-30 | 13F | Smith Thornton Advisors LLC | 9,899 | -14.46 | 871 | -10.95 | ||||
| 2025-08-14 | 13F | Royal Bank Of Canada | 66,342 | 4.23 | 5,835 | 8.56 | ||||
| 2025-08-11 | 13F | Private Advisor Group, LLC | 133,771 | -0.34 | 11,766 | 3.82 | ||||
| 2025-06-26 | NP | URINX - Target Retirement Income Fund | 106,772 | 27.41 | 8,158 | 24.82 | ||||
| 2025-08-13 | 13F | Summit Financial, LLC | 86,218 | 3.66 | 7,584 | 7.97 | ||||
| 2025-07-31 | 13F | Cambridge Investment Research Advisors, Inc. | 28,566 | 0.04 | 3 | 0.00 | ||||
| 2025-08-14 | 13F | Goldman Sachs Group Inc | 66,718 | 15.50 | 5,869 | 20.32 | ||||
| 2025-08-12 | 13F | NWF Advisory Services Inc. | 7,659 | 647 | ||||||
| 2025-08-06 | 13F | Commonwealth Equity Services, Llc | 50,192 | -1.07 | 4 | 0.00 | ||||
| 2025-08-08 | 13F | Creative Planning | 8,977 | 0.74 | 790 | 4.92 | ||||
| 2025-08-12 | 13F | Global Retirement Partners, LLC | 60 | 5 | ||||||
| 2025-08-11 | 13F | Aptus Capital Advisors, LLC | 131 | 0.00 | 12 | 0.00 | ||||
| 2025-07-21 | 13F | Patriot Financial Group Insurance Agency, LLC | 4,675 | 0.00 | 411 | 4.31 | ||||
| 2025-07-29 | 13F | Signature Estate & Investment Advisors Llc | 3,091 | 0.29 | 272 | 4.23 | ||||
| 2025-08-08 | 13F | Larson Financial Group LLC | 49,279 | -0.58 | 4,335 | 3.56 | ||||
| 2025-06-26 | NP | URSIX - Target Retirement 2060 Fund | 54,930 | -14.97 | 4,197 | -16.69 | ||||
| 2025-08-13 | 13F | Seven Springs Wealth Group, LLC | 2,277 | 200 | ||||||
| 2025-07-15 | 13F | Fifth Third Bancorp | 172 | 0.00 | 15 | 7.14 | ||||
| 2025-08-14 | 13F | Great Valley Advisor Group, Inc. | 5,351 | -1.04 | 471 | 3.07 | ||||
| 2025-07-25 | NP | UCEQX - Cornerstone Equity Fund | 149,156 | -11.82 | 12,205 | -14.04 | ||||
| 2025-08-12 | 13F | Pathstone Holdings, LLC | 7,967 | 0.35 | 701 | 4.48 | ||||
| 2025-08-26 | NP | EVVLX - The E-Valuator Very Conservative (0%-15%) RMS Fund Service Class Shares | 930 | 212.08 | 78 | 239.13 | ||||
| 2025-08-08 | 13F | Avantax Advisory Services, Inc. | 2,505 | 0.00 | 220 | 4.27 | ||||
| 2025-08-13 | 13F | Northern Trust Corp | 7,837 | 0.00 | 689 | 4.24 | ||||
| 2025-08-14 | 13F | Integrated Wealth Concepts LLC | 19,018 | 6.87 | 1,673 | 11.32 | ||||
| 2025-08-13 | 13F | Jones Financial Companies Lllp | 35,895 | 29.96 | 3,135 | 35.48 | ||||
| 2025-05-13 | 13F | Nations Financial Group Inc, /ia/ /adv | 0 | -100.00 | 0 | |||||
| 2025-07-11 | 13F | SILVER OAK SECURITIES, Inc | 121,488 | -1.17 | 10,686 | 3.74 | ||||
| 2025-08-05 | 13F | GPS Wealth Strategies Group, LLC | 1,352 | 0.15 | 119 | 4.42 | ||||
| 2025-08-12 | 13F | Jpmorgan Chase & Co | 2,130 | 571.92 | 187 | 619.23 | ||||
| 2025-08-14 | 13F | IHT Wealth Management, LLC | 8,719 | -0.84 | 767 | 3.23 | ||||
| 2025-08-26 | NP | EVMLX - The E-Valuator Moderate (50%-70%) RMS Fund Service Class Shares | 24,148 | 6.84 | 2,026 | 13.88 | ||||
| 2025-08-26 | NP | EVCLX - The E-Valuator Conservative (15%-30%) RMS Fund Service Class Shares | 3,060 | 11.84 | 257 | 19.07 | ||||
| 2025-08-08 | 13F | Pnc Financial Services Group, Inc. | 3,743 | 329 | ||||||
| 2025-08-12 | 13F | Calton & Associates, Inc. | 0 | -100.00 | 0 | |||||
| 2025-06-26 | NP | URTRX - Target Retirement 2030 Fund | 244,422 | 0.00 | 18,676 | -12.24 | ||||
| 2025-08-15 | 13F | Morgan Stanley | 661,840 | -4.80 | 58,216 | -0.83 | ||||
| 2025-07-01 | 13F | Private Client Services, Llc | 0 | -100.00 | 0 | |||||
| 2025-07-25 | 13F | Allspring Global Investments Holdings, LLC | 13,600 | 0.00 | 1,203 | 4.07 | ||||
| 2025-08-14 | 13F | Money Concepts Capital Corp | 13,538 | -4.67 | 1,191 | -0.75 | ||||
| 2025-07-08 | 13F | Nbc Securities, Inc. | 956 | 65.68 | 0 | |||||
| 2025-08-07 | 13F | Rossmore Private Capital | 17,850 | -11.85 | 1,570 | -8.13 | ||||
| 2025-08-14 | 13F | Comerica Bank | 255,932 | -1.74 | 22,512 | 2.36 | ||||
| 2025-07-15 | 13F | Financial Management Professionals, Inc. | 1,711 | 150 | ||||||
| 2025-08-13 | 13F | Keystone Financial Group | 22,603 | -4.87 | 1,988 | -0.90 | ||||
| 2025-08-14 | 13F | UBS Group AG | 168,385 | -0.28 | 14,811 | 3.87 | ||||
| 2025-08-06 | 13F | OneAscent Family Office, LLC | 4,368 | 0.00 | 0 | |||||
| 2025-08-13 | 13F | EverSource Wealth Advisors, LLC | 437 | 0.23 | 38 | 5.56 | ||||
| 2025-08-13 | 13F | Northwestern Mutual Wealth Management Co | 288,239 | 2.10 | 25,354 | 6.36 | ||||
| 2025-08-14 | 13F | Quantinno Capital Management LP | 3,361 | 296 | ||||||
| 2025-08-06 | 13F | Golden State Wealth Management, LLC | 11,123 | -2.74 | 978 | 1.35 | ||||
| 2025-07-07 | 13F | TruWealth Advisors, LLC | 4,343 | 0.00 | 382 | 4.37 | ||||
| 2025-07-25 | 13F | Concurrent Investment Advisors, LLC | 3,339 | 294 | ||||||
| 2025-08-14 | 13F | Stifel Financial Corp | 57,022 | -1.21 | 5,016 | 2.89 | ||||
| 2025-07-25 | NP | USCCX - Cornerstone Conservative Fund | 18,550 | 0.00 | 1,503 | -1.70 | ||||
| 2025-08-14 | 13F | Raymond James Financial Inc | 300,080 | -0.90 | 26,395 | 3.23 | ||||
| 2025-07-17 | 13F | TBH Global Asset Management, LLC | 10,333 | 0.00 | 909 | 4.13 | ||||
| 2025-08-12 | 13F | LPL Financial LLC | 119,159 | -1.06 | 10,481 | 3.07 | ||||
| 2025-08-14 | 13F | Fmr Llc | 1,203 | -14.56 | 106 | -11.02 |