Mga Batayang Estadistika
| Pemilik Institusional | 115 total, 115 long only, 0 short only, 0 long/short - change of 43.75% MRQ |
| Alokasi Portofolio Rata-rata | 0.3221 % - change of 180.01% MRQ |
| Saham Institusional (Jangka Panjang) | 20,784,662 (ex 13D/G) - change of 12.51MM shares 151.13% MRQ |
| Nilai Institusional (Jangka Panjang) | $ 310,781 USD ($1000) |
Kepemilikan Institusional dan Pemegang Saham
First Trust Exchange-Traded Fund II - First Trust STOXX European Select Dividend Index Fund (US:FDD) memiliki 115 pemilik institusional dan pemegang saham yang telah mengajukan formulir 13D/G atau 13F kepada Komisi Bursa Efek (Securities Exchange Commission/SEC). Lembaga-lembaga ini memegang total 20,784,662 saham. Pemegang saham terbesar meliputi Morgan Stanley, Wells Fargo & Company/mn, Raymond James Financial Inc, Manchester Financial Inc, SMI Advisory Services, LLC, UBS Group AG, LPL Financial LLC, ODonnell Financial Services, LLC, Ameriprise Financial Inc, and Intellectus Partners, LLC .
Struktur kepemilikan institusional First Trust Exchange-Traded Fund II - First Trust STOXX European Select Dividend Index Fund (ARCA:FDD) menunjukkan posisi terkini di perusahaan oleh institusi dan dana, serta perubahan terbaru dalam ukuran posisi. Pemegang saham utama dapat mencakup investor individu, reksa dana, dana lindung nilai, atau institusi. Jadwal 13D menunjukkan bahwa investor memegang (atau pernah memegang) lebih dari 5% saham perusahaan dan bermaksud (atau pernah bermaksud) untuk secara aktif mengejar perubahan strategi bisnis. Jadwal 13G menunjukkan investasi pasif lebih dari 5%.
The share price as of September 5, 2025 is 15.99 / share. Previously, on September 6, 2024, the share price was 12.19 / share. This represents an increase of 31.17% over that period.

Skor Sentimen Dana
Skor Sentimen Dana (sebelumnya dikenal sebagai Skor Akumulasi Kepemilikan) menemukan saham-saham yang paling banyak dibeli oleh dana. Ini adalah hasil dari model kuantitatif multi-faktor yang canggih yang mengidentifikasi perusahaan dengan tingkat akumulasi institusional tertinggi. Model penilaian menggunakan kombinasi dari total peningkatan pemilik yang diungkapkan, perubahan dalam alokasi portofolio pada pemilik tersebut, dan metrik lainnya. Angka berkisar dari 0 hingga 100, dengan angka yang lebih tinggi menunjukkan tingkat akumulasi yang lebih tinggi dibandingkan dengan perusahaan sejenisnya, dan 50 adalah rata-ratanya.
Frekuensi Pembaruan: Setiap Hari
Lihat Ownership Explorer, yang menyediakan daftar perusahaan dengan peringkat tertinggi.
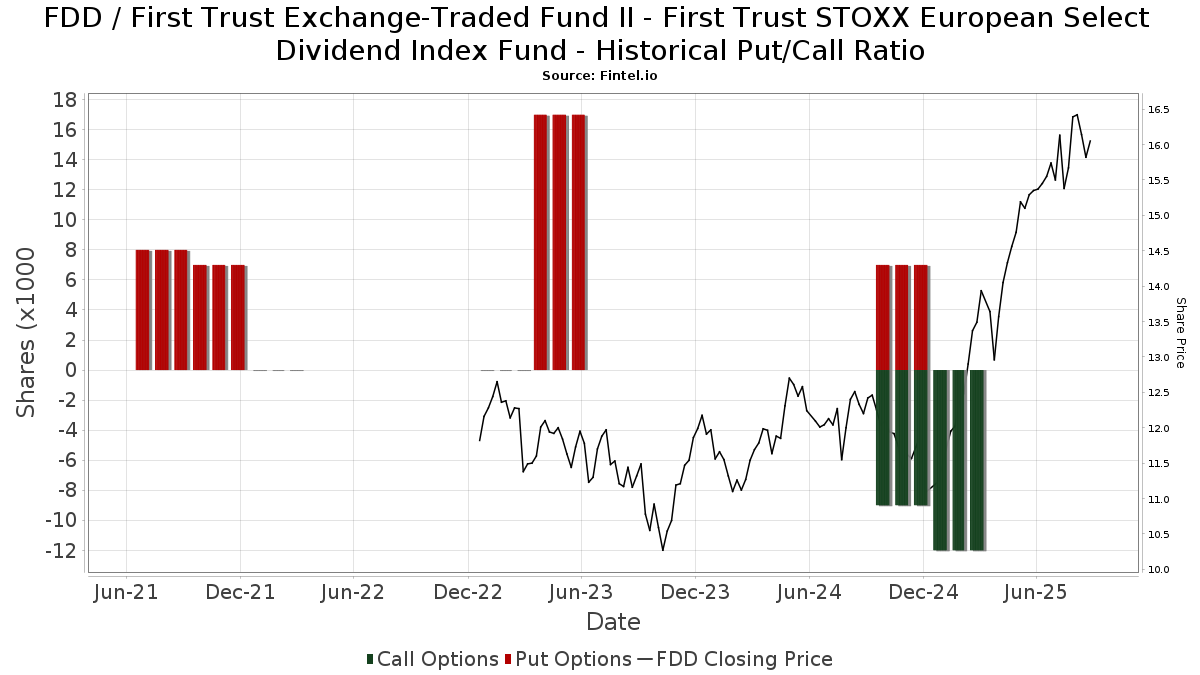
Rasio Put/Call Institusional
Selain melaporkan isu ekuitas dan utang standar, institusi dengan aset di bawah manajemen lebih dari 100 juta dolar AS juga harus mengungkapkan kepemilikan opsi put dan call mereka. Karena opsi put umumnya menunjukkan sentimen negatif, dan opsi call menunjukkan sentimen positif, kita dapat mengetahui sentimen institusional secara keseluruhan dengan memplot rasio put terhadap call. Grafik di sebelah kanan memplot rasio put/call historis untuk instrumen ini.
Menggunakan Rasio Put/Call sebagai indikator sentimen investor mengatasi salah satu kekurangan utama dari penggunaan total kepemilikan institusional, yaitu sejumlah besar aset yang dikelola diinvestasikan secara pasif untuk melacak indeks. Dana yang dikelola secara pasif biasanya tidak membeli opsi, sehingga indikator rasio put/call lebih akurat dalam melacak sentimen dana yang dikelola secara aktif.
Pengajuan 13F dan NPORT
Detail pada pengajuan 13F tersedia gratis. Detail pada pengajuan NP memerlukan keanggotaan premium. Baris berwarna hijau menunjukkan posisi baru. Baris berwarna merah menunjukkan posisi yang sudah ditutup. Klik tautan ini ikon untuk melihat riwayat transaksi selengkapnya.
Tingkatkan
untuk membuka data premium dan mengekspor ke Excel ![]() .
.
| Tanggal File | Sumber | Investor | Ketik | Presyo ng Avg (Silangan) |
Saham | Δ Saham (%) |
Dilaporkan Nilai ($1000) |
Nilai Δ (%) |
Alokasi Port (%) |
|
|---|---|---|---|---|---|---|---|---|---|---|
| 2025-08-06 | 13F | Wedbush Securities Inc | 25,055 | 0.00 | 0 | |||||
| 2025-08-14 | 13F | Raymond James Financial Inc | 1,491,557 | 609.22 | 23,179 | 712.41 | ||||
| 2025-08-14 | 13F | Susquehanna International Group, Llp | 29,323 | 456 | ||||||
| 2025-07-08 | 13F | Nbc Securities, Inc. | 2,192 | 0.00 | 0 | |||||
| 2025-08-06 | 13F | Commonwealth Equity Services, Llc | 100,802 | -29.70 | 2 | 0.00 | ||||
| 2025-07-17 | 13F | Forefront Wealth Management Inc. | 157,967 | 2,455 | ||||||
| 2025-08-14 | 13F | Treasure Coast Financial Planning | 13,493 | 7.75 | 210 | 23.67 | ||||
| 2025-06-30 | NP | SMIFX - Sound Mind Investing Fund | 427,620 | 6,128 | ||||||
| 2025-08-05 | 13F | Ciovacco Capital Management LLC | 34,994 | 544 | ||||||
| 2025-08-27 | 13F/A | Brinker Capital Investments, LLC | 32,600 | -30.87 | 507 | -20.81 | ||||
| 2025-07-31 | 13F | Topsail Wealth Management, LLC | 14,060 | 218 | ||||||
| 2025-08-14 | 13F | Wells Fargo & Company/mn | 2,494,548 | 474.53 | 38,765 | 558.04 | ||||
| 2025-07-17 | 13F | Sound Income Strategies, LLC | 87 | 1 | ||||||
| 2025-08-04 | 13F | Spire Wealth Management | 0 | -100.00 | 0 | |||||
| 2025-08-12 | 13F | Proequities, Inc. | 0 | 0 | ||||||
| 2025-08-08 | 13F | Cetera Investment Advisers | 57,259 | 178.40 | 890 | 218.64 | ||||
| 2025-08-13 | 13F | Flow Traders U.s. Llc | 32,694 | 1 | ||||||
| 2025-08-14 | 13F | Goldman Sachs Group Inc | 16,304 | 253 | ||||||
| 2025-07-25 | 13F | Envestnet Portfolio Solutions, Inc. | 47,936 | -7.26 | 745 | 6.13 | ||||
| 2025-08-04 | 13F | Integrity Alliance, Llc. | 29,086 | 452 | ||||||
| 2025-08-06 | 13F | Strategic Financial Partners, Ltd. | 14,910 | 0.17 | 232 | 14.93 | ||||
| 2025-08-11 | 13F | Principal Securities, Inc. | 14,086 | -25.14 | 219 | 3.32 | ||||
| 2025-08-18 | 13F | Geneos Wealth Management Inc. | 750 | -48.28 | 12 | -42.11 | ||||
| 2025-05-15 | 13F/A | Orion Portfolio Solutions, LLC | 47,160 | -3.89 | 640 | 15.76 | ||||
| 2025-05-12 | 13F | Virtu Financial LLC | 0 | -100.00 | 0 | |||||
| 2025-07-24 | 13F | Blair William & Co/il | 3,000 | 47 | ||||||
| 2025-07-29 | 13F | International Assets Investment Management, Llc | 44,010 | 684 | ||||||
| 2025-08-14 | 13F/A | Rockefeller Capital Management L.P. | 114,170 | 26.49 | 1,774 | 44.93 | ||||
| 2025-08-06 | 13F | Prospera Financial Services Inc | 156,115 | 2,426 | ||||||
| 2025-07-18 | 13F | SMI Advisory Services, LLC | 1,247,631 | 19,338 | ||||||
| 2025-07-18 | 13F | Truist Financial Corp | 120,316 | 620.15 | 1,870 | 726.99 | ||||
| 2025-07-17 | 13F | Janney Montgomery Scott LLC | 380,881 | 93.91 | 6 | 150.00 | ||||
| 2025-08-06 | 13F | Moors & Cabot, Inc. | 22,366 | 348 | ||||||
| 2025-08-14 | 13F | Susquehanna International Group, Llp | Call | 0 | -100.00 | 0 | ||||
| 2025-08-14 | 13F | Benjamin Edwards Inc | 20,521 | -11.76 | 319 | 0.95 | ||||
| 2025-08-08 | 13F | SBI Securities Co., Ltd. | 6,438 | 137.04 | 100 | 177.78 | ||||
| 2025-08-01 | 13F | Rossby Financial, LCC | 401 | 0.00 | 6 | 20.00 | ||||
| 2025-07-29 | 13F | Balboa Wealth Partners | 32,459 | 171.35 | 504 | 211.11 | ||||
| 2025-08-12 | 13F | Change Path, LLC | 20,361 | -23.72 | 316 | -12.71 | ||||
| 2025-08-13 | 13F | Continuum Advisory, LLC | 0 | -100.00 | 0 | |||||
| 2025-08-13 | 13F | BlackDiamond Wealth Management Inc. | 10,952 | -1.32 | 170 | 4.94 | ||||
| 2025-07-24 | 13F | IFP Advisors, Inc | 342,112 | 14,748.61 | 5,316 | 17,048.39 | ||||
| 2025-09-04 | 13F/A | Advisor Group Holdings, Inc. | 569,857 | 6,008.45 | 8,855 | 6,927.78 | ||||
| 2025-07-11 | 13F | Pinnacle Bancorp, Inc. | 104 | 0.00 | 2 | 0.00 | ||||
| 2025-07-16 | 13F | Owen LaRue, LLC | 151,421 | -61.65 | 2,353 | -56.08 | ||||
| 2025-08-04 | 13F | Atria Investments Llc | 414,962 | 3,906.97 | 6,449 | 4,505.71 | ||||
| 2025-07-31 | 13F | Hobart Private Capital, LLC | 154,669 | 11.65 | 2,404 | 27.89 | ||||
| 2025-08-13 | 13F | Jones Financial Companies Lllp | 71,719 | 940.46 | 1,110 | 1,080.85 | ||||
| 2025-07-21 | 13F | J2 Capital Management Inc | 41,716 | 648 | ||||||
| 2025-07-14 | 13F | GAMMA Investing LLC | 2,775 | 0.00 | 43 | 16.22 | ||||
| 2025-08-14 | 13F | UBS Group AG | 1,154,637 | 81.04 | 17,943 | 107.34 | ||||
| 2025-08-12 | 13F | LPL Financial LLC | 749,713 | 58.93 | 11,651 | 82.00 | ||||
| 2025-07-28 | 13F | BRYN MAWR TRUST Co | 4,300 | 67 | ||||||
| 2025-07-30 | 13F | BlueChip Wealth Advisors LLC | 63,436 | -5.08 | 986 | 8.72 | ||||
| 2025-08-18 | 13F/A | National Bank Of Canada /fi/ | 1,200 | 71.43 | 19 | 100.00 | ||||
| 2025-07-28 | 13F | Harbour Investments, Inc. | 155,443 | -4.72 | 2,416 | 9.13 | ||||
| 2025-07-08 | 13F | Next Level Private LLC | 163,272 | 0.71 | 2,537 | 15.32 | ||||
| 2025-08-07 | 13F | Kestra Private Wealth Services, Llc | 75,227 | -2.28 | 1,169 | 11.97 | ||||
| 2025-08-14 | 13F | Comerica Bank | 46,757 | -6.70 | 727 | 6.76 | ||||
| 2025-07-29 | 13F | Stephens Inc /ar/ | 35,758 | -0.56 | 556 | 13.96 | ||||
| 2025-08-13 | 13F | Twin Peaks Wealth Advisors, LLC | 4,216 | 68 | ||||||
| 2025-08-14 | 13F | Integrated Wealth Concepts LLC | 94,796 | 4.38 | 1,473 | 19.56 | ||||
| 2025-05-15 | 13F | Hrt Financial Lp | 0 | -100.00 | 0 | |||||
| 2025-08-14 | 13F | Mml Investors Services, Llc | 109,515 | 886.62 | 2 | |||||
| 2025-08-05 | 13F | Intellectus Partners, LLC | 632,650 | 2.76 | 9,831 | 17.68 | ||||
| 2025-08-15 | 13F | Fsb Premier Wealth Management, Inc. | 11,116 | 0.22 | 173 | 14.67 | ||||
| 2025-08-13 | 13F | Gateway Wealth Partners, LLC | 28,588 | 29.94 | 444 | 48.99 | ||||
| 2025-07-31 | 13F | Oppenheimer & Co Inc | 10,000 | 155 | ||||||
| 2025-08-15 | 13F | Kestra Advisory Services, LLC | 57,099 | 167.89 | 887 | 206.92 | ||||
| 2025-07-23 | 13F | Tcfg Wealth Management, Llc | 103,350 | -0.42 | 1,606 | 14.06 | ||||
| 2025-08-01 | 13F | Envestnet Asset Management Inc | 255,278 | 57.84 | 3,967 | 80.81 | ||||
| 2025-07-16 | 13F | ORG Partners LLC | 28,500 | 466 | ||||||
| 2025-08-08 | 13F | Pnc Financial Services Group, Inc. | 3,793 | -15.20 | 59 | -3.33 | ||||
| 2025-07-22 | 13F | Belpointe Asset Management LLC | 22,905 | 356 | ||||||
| 2025-08-14 | 13F | Colony Group, LLC | 39,343 | -12.56 | 611 | 0.16 | ||||
| 2025-08-14 | 13F | Ameriprise Financial Inc | 650,174 | 53.73 | 10,081 | 75.66 | ||||
| 2025-08-14 | 13F | Harwood Advisory Group, LLC | 2,157 | -5.48 | 34 | 32.00 | ||||
| 2025-08-19 | 13F | Advisory Services Network, LLC | 15,493 | 237 | ||||||
| 2025-07-09 | 13F | Murphy, Middleton, Hinkle & Parker, Inc. | 107,446 | 0.00 | 1,458 | 0.00 | ||||
| 2025-08-15 | 13F | Tower Research Capital LLC (TRC) | 0 | -100.00 | 0 | |||||
| 2025-07-11 | 13F | Farther Finance Advisors, LLC | 1,792 | 3.76 | 28 | 17.39 | ||||
| 2025-08-13 | 13F | Baird Financial Group, Inc. | 20,153 | 56.80 | 313 | 79.89 | ||||
| 2025-08-05 | 13F | Prosperity Wealth Management, Inc. | 14,600 | 227 | ||||||
| 2025-08-12 | 13F | Steward Partners Investment Advisory, Llc | 164,659 | 3,531.65 | 2,559 | 4,093.44 | ||||
| 2025-08-14 | 13F | GWM Advisors LLC | 14,105 | 219 | ||||||
| 2025-08-19 | 13F | Newbridge Financial Services Group, Inc. | 13,879 | 216 | ||||||
| 2025-07-16 | 13F | Register Financial Advisors LLC | 12,719 | 198 | ||||||
| 2025-08-08 | 13F | MTM Investment Management, LLC | 1,500 | 23 | ||||||
| 2025-08-14 | 13F | Fmr Llc | 5,716 | 89 | ||||||
| 2025-07-29 | 13F | ODonnell Financial Services, LLC | 747,517 | 11,616 | ||||||
| 2025-08-14 | 13F | Royal Bank Of Canada | 110,349 | 333.95 | 1,715 | 395.66 | ||||
| 2025-05-15 | 13F | Citadel Advisors Llc | Put | 0 | -100.00 | 0 | -100.00 | |||
| 2025-08-14 | 13F | Atomi Financial Group, Inc. | 13,879 | 216 | ||||||
| 2025-05-08 | 13F | Armis Advisers, LLC | 0 | -100.00 | 0 | |||||
| 2025-07-11 | 13F | SILVER OAK SECURITIES, Inc | 20,056 | 25.37 | 312 | 42.66 | ||||
| 2025-08-07 | 13F | Private Advisory Group LLC | 92,110 | 1,431 | ||||||
| 2025-07-21 | 13F | Ameritas Advisory Services, LLC | 209 | 3 | ||||||
| 2025-07-17 | 13F | Raleigh Capital Management Inc. | 783 | 1.42 | 12 | 20.00 | ||||
| 2025-08-14 | 13F | Jane Street Group, Llc | 400,000 | 161.23 | 6,216 | 199.28 | ||||
| 2025-08-14 | 13F | Bank Of America Corp /de/ | 273,362 | -16.36 | 4,248 | -4.22 | ||||
| 2025-08-12 | 13F | Global Retirement Partners, LLC | 5,843 | 1,603.50 | 91 | 2,900.00 | ||||
| 2025-07-23 | 13F | Foresight Capital Management Advisors, Inc. | 195,185 | 3,033 | ||||||
| 2025-07-31 | 13F | Cambridge Investment Research Advisors, Inc. | 60,260 | 10.88 | 1 | |||||
| 2025-07-10 | 13F | Wealth Enhancement Advisory Services, Llc | 24,946 | 389 | ||||||
| 2025-07-29 | 13F | Manchester Financial Inc | 1,382,182 | 21,479 | ||||||
| 2025-07-29 | 13F | Cottonwood Capital Advisors, Llc | 33,170 | -0.18 | 515 | 14.44 | ||||
| 2025-08-14 | 13F | Citadel Advisors Llc | Call | 0 | -100.00 | 0 | ||||
| 2025-04-30 | 13F | Allworth Financial LP | 0 | -100.00 | 0 | |||||
| 2025-08-01 | 13F | Liberty Wealth Management Llc | 14,770 | 1.29 | 230 | 16.24 | ||||
| 2025-08-12 | 13F | Jaffetilchin Investment Partners, LLC | 0 | -100.00 | 0 | |||||
| 2025-07-22 | 13F | Berger Financial Group, Inc | 16,543 | 4.21 | 257 | 19.53 | ||||
| 2025-08-12 | 13F | Wisconsin Wealth Advisors, LLC | 52,722 | 819 | ||||||
| 2025-08-12 | 13F | Jpmorgan Chase & Co | 1,772 | 28 | ||||||
| 2025-08-14 | 13F | Snowden Capital Advisors LLC | 30,012 | 52.64 | 466 | 75.19 | ||||
| 2025-08-14 | 13F | Citadel Advisors Llc | 50,089 | 109.35 | 778 | 140.12 | ||||
| 2025-08-15 | 13F | Morgan Stanley | 2,689,945 | 28.45 | 41,802 | 47.10 | ||||
| 2025-08-04 | 13F | Flagship Harbor Advisors, Llc | 198,437 | 3,084 | ||||||
| 2025-06-30 | NP | SMILX - SMI 50/40/10 Fund | 114,510 | 1,641 | ||||||
| 2025-07-17 | 13F | Lee Johnson Capital Management, Llc | 22,640 | 352 | ||||||
| 2025-07-25 | 13F | Concurrent Investment Advisors, LLC | 28,514 | 97.62 | 443 | 127.18 | ||||
| 2025-08-15 | 13F | Equitable Holdings, Inc. | 181,155 | 47.82 | 2,815 | 69.27 | ||||
| 2025-08-05 | 13F | Sigma Planning Corp | 17,416 | 2.65 | 271 | 17.39 | ||||
| 2025-08-14 | 13F | Stifel Financial Corp | 40,752 | 27.75 | 633 | 46.53 | ||||
| 2025-08-12 | 13F | MAI Capital Management | 120 | 0.00 | 2 | 0.00 | ||||
| 2025-07-15 | 13F | Elevated Capital Advisors, LLC | 49,419 | 0.00 | 671 | 0.00 | ||||
| 2025-07-23 | 13F | Bellevue Asset Management, Llc | 1,202 | 0.59 | 19 | 12.50 | ||||
| 2025-08-20 | 13F/A | Coppell Advisory Solutions LLC | 26,069 | 96.29 | 404 | 110.42 |
Other Listings
| MX:FDD |