Mga Batayang Estadistika
| Pemilik Institusional | 98 total, 98 long only, 0 short only, 0 long/short - change of 3.09% MRQ |
| Alokasi Portofolio Rata-rata | 0.0802 % - change of 0.34% MRQ |
| Saham Institusional (Jangka Panjang) | 4,786,203 (ex 13D/G) - change of -0.38MM shares -7.32% MRQ |
| Nilai Institusional (Jangka Panjang) | $ 146,269 USD ($1000) |
Kepemilikan Institusional dan Pemegang Saham
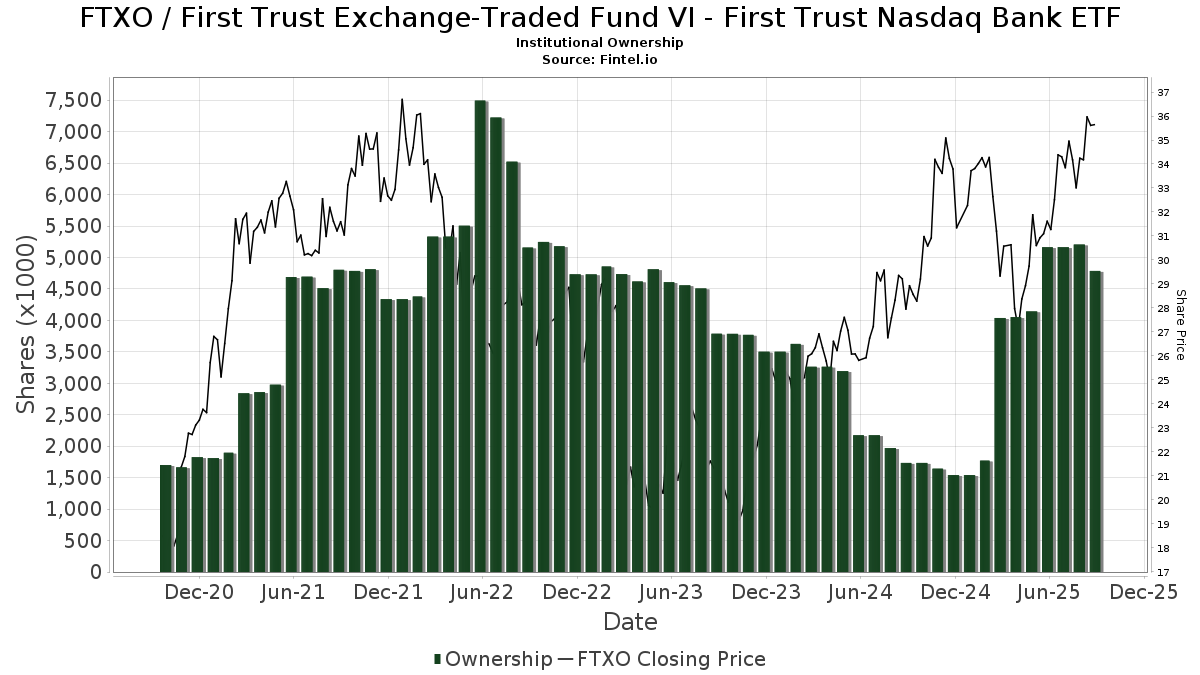
First Trust Exchange-Traded Fund VI - First Trust Nasdaq Bank ETF (US:FTXO) memiliki 98 pemilik institusional dan pemegang saham yang telah mengajukan formulir 13D/G atau 13F kepada Komisi Bursa Efek (Securities Exchange Commission/SEC). Lembaga-lembaga ini memegang total 4,786,203 saham. Pemegang saham terbesar meliputi LPL Financial LLC, Morgan Stanley, Envestnet Asset Management Inc, Wells Fargo & Company/mn, UBS Group AG, TradeWell Securities, LLC., Wagner Wealth Management, Llc, Royal Bank Of Canada, Raymond James Financial Inc, and Bank Of America Corp /de/ .
Struktur kepemilikan institusional First Trust Exchange-Traded Fund VI - First Trust Nasdaq Bank ETF (NasdaqGM:FTXO) menunjukkan posisi terkini di perusahaan oleh institusi dan dana, serta perubahan terbaru dalam ukuran posisi. Pemegang saham utama dapat mencakup investor individu, reksa dana, dana lindung nilai, atau institusi. Jadwal 13D menunjukkan bahwa investor memegang (atau pernah memegang) lebih dari 5% saham perusahaan dan bermaksud (atau pernah bermaksud) untuk secara aktif mengejar perubahan strategi bisnis. Jadwal 13G menunjukkan investasi pasif lebih dari 5%.
The share price as of September 5, 2025 is 35.56 / share. Previously, on September 9, 2024, the share price was 28.65 / share. This represents an increase of 24.12% over that period.
Skor Sentimen Dana
Skor Sentimen Dana (sebelumnya dikenal sebagai Skor Akumulasi Kepemilikan) menemukan saham-saham yang paling banyak dibeli oleh dana. Ini adalah hasil dari model kuantitatif multi-faktor yang canggih yang mengidentifikasi perusahaan dengan tingkat akumulasi institusional tertinggi. Model penilaian menggunakan kombinasi dari total peningkatan pemilik yang diungkapkan, perubahan dalam alokasi portofolio pada pemilik tersebut, dan metrik lainnya. Angka berkisar dari 0 hingga 100, dengan angka yang lebih tinggi menunjukkan tingkat akumulasi yang lebih tinggi dibandingkan dengan perusahaan sejenisnya, dan 50 adalah rata-ratanya.
Frekuensi Pembaruan: Setiap Hari
Lihat Ownership Explorer, yang menyediakan daftar perusahaan dengan peringkat tertinggi.
Rasio Put/Call Institusional
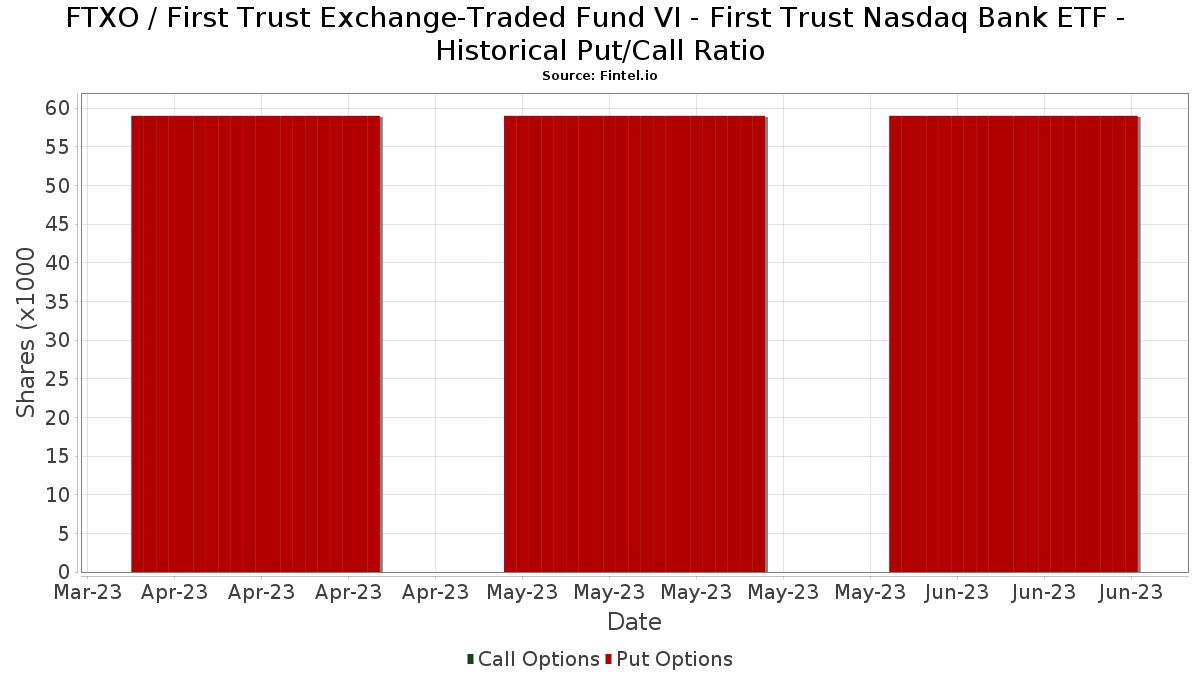
Selain melaporkan isu ekuitas dan utang standar, institusi dengan aset di bawah manajemen lebih dari 100 juta dolar AS juga harus mengungkapkan kepemilikan opsi put dan call mereka. Karena opsi put umumnya menunjukkan sentimen negatif, dan opsi call menunjukkan sentimen positif, kita dapat mengetahui sentimen institusional secara keseluruhan dengan memplot rasio put terhadap call. Grafik di sebelah kanan memplot rasio put/call historis untuk instrumen ini.
Menggunakan Rasio Put/Call sebagai indikator sentimen investor mengatasi salah satu kekurangan utama dari penggunaan total kepemilikan institusional, yaitu sejumlah besar aset yang dikelola diinvestasikan secara pasif untuk melacak indeks. Dana yang dikelola secara pasif biasanya tidak membeli opsi, sehingga indikator rasio put/call lebih akurat dalam melacak sentimen dana yang dikelola secara aktif.
Pengajuan 13F dan NPORT
Detail pada pengajuan 13F tersedia gratis. Detail pada pengajuan NP memerlukan keanggotaan premium. Baris berwarna hijau menunjukkan posisi baru. Baris berwarna merah menunjukkan posisi yang sudah ditutup. Klik tautan ini ikon untuk melihat riwayat transaksi selengkapnya.
Tingkatkan
untuk membuka data premium dan mengekspor ke Excel ![]() .
.
| Tanggal File | Sumber | Investor | Ketik | Presyo ng Avg (Silangan) |
Saham | Δ Saham (%) |
Dilaporkan Nilai ($1000) |
Nilai Δ (%) |
Alokasi Port (%) |
|
|---|---|---|---|---|---|---|---|---|---|---|
| 2025-08-15 | 13F | Morgan Stanley | 611,211 | -33.12 | 20,188 | -27.33 | ||||
| 2025-08-11 | 13F | Principal Securities, Inc. | 5,016 | 12.92 | 166 | 17.02 | ||||
| 2025-08-13 | 13F | Transce3nd, LLC | 89 | 0.00 | 3 | 0.00 | ||||
| 2025-08-08 | 13F | Hartland & Co., LLC | 3,077 | 102 | ||||||
| 2025-07-17 | 13F | Wagner Wealth Management, Llc | 166,630 | 4.98 | 5,504 | 14.05 | ||||
| 2025-07-31 | 13F | Cambridge Investment Research Advisors, Inc. | 112,216 | 29.49 | 4 | 50.00 | ||||
| 2025-08-12 | 13F | LPL Financial LLC | 617,552 | 17.27 | 20,398 | 27.42 | ||||
| 2025-08-27 | 13F/A | Brinker Capital Investments, LLC | 26,115 | -1.17 | 863 | 7.35 | ||||
| 2025-07-31 | 13F | Topsail Wealth Management, LLC | 400 | -33.33 | 13 | -27.78 | ||||
| 2025-08-11 | 13F | Citigroup Inc | 700 | 23 | ||||||
| 2025-08-04 | 13F | Creative Financial Designs Inc /adv | 3,613 | 6.14 | 119 | 15.53 | ||||
| 2025-05-15 | 13F/A | Orion Portfolio Solutions, LLC | 26,424 | 0.48 | 803 | -3.95 | ||||
| 2025-08-06 | 13F | Commonwealth Equity Services, Llc | 19,719 | 16.72 | 1 | |||||
| 2025-08-13 | 13F | Virtue Capital Management, LLC | 0 | -100.00 | 0 | |||||
| 2025-05-14 | 13F | Bnp Paribas Arbitrage, Sa | 0 | -100.00 | 0 | |||||
| 2025-08-14 | 13F | Citadel Advisors Llc | 13,443 | 444 | ||||||
| 2025-07-08 | 13F | Nbc Securities, Inc. | 1,334 | -4.58 | 0 | |||||
| 2025-08-13 | 13F | Icapital Wealth Llc | 7,361 | 0.00 | 243 | 8.97 | ||||
| 2025-08-14 | 13F | Sherman Asset Management, Inc. | 870 | 0.00 | 29 | 7.69 | ||||
| 2025-07-28 | 13F | RFG Advisory, LLC | 7,359 | 2.12 | 243 | 10.96 | ||||
| 2025-08-12 | 13F | CIBC Private Wealth Group, LLC | 53 | 2 | ||||||
| 2025-08-12 | 13F | Proequities, Inc. | 0 | 0 | ||||||
| 2025-07-08 | 13F | Arlington Trust Co LLC | 0 | -100.00 | 0 | |||||
| 2025-08-12 | 13F | OneAscent Financial Services LLC | 23,477 | 7.47 | 1 | |||||
| 2025-08-14 | 13F | Guardian Wealth Advisors, Llc / Nc | 40 | 0.00 | 1 | 0.00 | ||||
| 2025-08-07 | 13F | Private Advisory Group LLC | 0 | -100.00 | 0 | |||||
| 2025-07-25 | 13F | Atria Wealth Solutions, Inc. | 12,332 | -22.98 | 407 | -16.26 | ||||
| 2025-07-31 | 13F | Nilsine Partners, LLC | 38,540 | 1.24 | 1,273 | 9.94 | ||||
| 2025-08-14 | 13F | Royal Bank Of Canada | 162,608 | -25.59 | 5,371 | -19.15 | ||||
| 2025-08-01 | 13F | Envestnet Asset Management Inc | 360,429 | 0.90 | 11,905 | 9.62 | ||||
| 2025-08-14 | 13F | UBS Group AG | 239,481 | -15.61 | 7,910 | -8.31 | ||||
| 2025-08-13 | 13F/A | StoneX Group Inc. | 7,283 | -50.81 | 212 | -46.17 | ||||
| 2025-08-06 | 13F | Prospera Financial Services Inc | 51,896 | 0.07 | 1,714 | 8.76 | ||||
| 2025-08-04 | 13F | Pensionmark Financial Group, Llc | 37,450 | 19.62 | 1,237 | 29.97 | ||||
| 2025-04-28 | 13F | DAVENPORT & Co LLC | 0 | -100.00 | 0 | |||||
| 2025-08-04 | 13F | Spire Wealth Management | 50 | 0.00 | 2 | 0.00 | ||||
| 2025-08-14 | 13F | Wells Fargo & Company/mn | 277,505 | -19.66 | 9,166 | -12.70 | ||||
| 2025-07-17 | 13F | Janney Montgomery Scott LLC | 107,053 | -7.71 | 4 | 0.00 | ||||
| 2025-08-14 | 13F | Comerica Bank | 962 | 4.34 | 32 | 10.71 | ||||
| 2025-08-14 | 13F | Raymond James Financial Inc | 162,326 | -34.33 | 5,362 | -28.64 | ||||
| 2025-08-13 | 13F | Continuum Advisory, LLC | 0 | -100.00 | 0 | |||||
| 2025-08-14 | 13F | Susquehanna International Group, Llp | 9,579 | -82.80 | 316 | -81.33 | ||||
| 2025-08-12 | 13F | SRS Capital Advisors, Inc. | 100 | 0.00 | 3 | 0.00 | ||||
| 2025-05-09 | 13F | CoreCap Advisors, LLC | 0 | -100.00 | 0 | |||||
| 2025-08-06 | 13F | RFG - Bristol Wealth Advisors, LLC | 0 | -100.00 | 0 | |||||
| 2025-08-15 | 13F | Tower Research Capital LLC (TRC) | 13,397 | 602.52 | 443 | 675.44 | ||||
| 2025-09-04 | 13F/A | Advisor Group Holdings, Inc. | 38,805 | 8.96 | 1,267 | 17.10 | ||||
| 2025-07-24 | 13F | IFP Advisors, Inc | 39,926 | -2.30 | 1,319 | 6.12 | ||||
| 2025-07-28 | 13F | BRYN MAWR TRUST Co | 207 | 0.00 | 7 | 0.00 | ||||
| 2025-08-11 | 13F | NewEdge Wealth, LLC | 18,772 | -2.33 | 614 | 4.97 | ||||
| 2025-08-11 | 13F | Aptus Capital Advisors, LLC | 40 | 0.00 | 1 | 0.00 | ||||
| 2025-07-02 | 13F | HBW Advisory Services LLC | 7,888 | 5.72 | 261 | 15.04 | ||||
| 2025-08-08 | 13F | Avantax Advisory Services, Inc. | 15,563 | 514 | ||||||
| 2025-08-18 | 13F | Geneos Wealth Management Inc. | 1,212 | 0.00 | 40 | 11.11 | ||||
| 2025-07-18 | 13F | Truist Financial Corp | 106,834 | 0.05 | 3,529 | 8.72 | ||||
| 2025-07-30 | 13F | BlueChip Wealth Advisors LLC | 6,764 | 0.00 | 223 | 8.78 | ||||
| 2025-08-05 | 13F | Bank of New York Mellon Corp | 36,500 | -1.68 | 1,206 | 6.83 | ||||
| 2025-08-14 | 13F | Goldman Sachs Group Inc | 22,821 | 13.54 | 754 | 23.24 | ||||
| 2025-08-07 | 13F | Resources Investment Advisors, LLC. | 0 | -100.00 | 0 | |||||
| 2025-08-14 | 13F | Fmr Llc | 55 | 0.00 | 2 | 0.00 | ||||
| 2025-05-02 | 13F | Capital A Wealth Management, LLC | 0 | -100.00 | 0 | |||||
| 2025-08-12 | 13F | Steward Partners Investment Advisory, Llc | 1,378 | 135.96 | 46 | 164.71 | ||||
| 2025-08-12 | 13F | MAI Capital Management | 460 | 0.00 | 15 | 15.38 | ||||
| 2025-08-13 | 13F | Gateway Wealth Partners, LLC | 28,750 | -2.66 | 950 | 5.80 | ||||
| 2025-08-20 | 13F/A | Coppell Advisory Solutions LLC | 19,000 | -44.01 | 624 | -36.97 | ||||
| 2025-08-15 | 13F | Equitable Holdings, Inc. | 13,121 | -12.05 | 433 | -4.42 | ||||
| 2025-07-21 | 13F | Ameritas Advisory Services, LLC | 184 | 6 | ||||||
| 2025-08-06 | 13F | AE Wealth Management LLC | 35,922 | -19.61 | 1,187 | -12.67 | ||||
| 2025-08-13 | 13F | Flow Traders U.s. Llc | 60,055 | 2 | ||||||
| 2025-08-14 | 13F | Stifel Financial Corp | 25,761 | -13.68 | 851 | -6.28 | ||||
| 2025-07-16 | 13F | American National Bank | 94 | 0.00 | 3 | 50.00 | ||||
| 2025-07-28 | 13F | Harbour Investments, Inc. | 10,762 | 4.78 | 355 | 13.78 | ||||
| 2025-07-23 | 13F | Element Wealth, LLC | 21,905 | 724 | ||||||
| 2025-08-14 | 13F | Transamerica Financial Advisors, Inc. | 152 | 0.00 | 5 | |||||
| 2025-05-16 | 13F/A | Kestra Investment Management, LLC | 0 | -100.00 | 0 | |||||
| 2025-08-14 | 13F | Pinnacle Family Advisors, LLC | 6,605 | 218 | ||||||
| 2025-08-14 | 13F | Mpwm Advisory Solutions, Llc | 0 | 0 | ||||||
| 2025-07-24 | 13F | Us Bancorp \de\ | 6,396 | 211 | ||||||
| 2025-07-15 | 13F | FLP Wealth Management, LLC | 0 | -100.00 | 0 | |||||
| 2025-08-15 | 13F | Puff Wealth Management, Llc | 28,465 | -11.46 | 940 | -3.79 | ||||
| 2025-07-14 | 13F | AdvisorNet Financial, Inc | 158 | 37.39 | 5 | 66.67 | ||||
| 2025-08-04 | 13F | Assetmark, Inc | 141,526 | 21.95 | 4,675 | 32.52 | ||||
| 2025-07-15 | 13F | Traction Financial Partners, LLC | 6,663 | 220 | ||||||
| 2025-04-30 | 13F | TradeWell Securities, LLC. | 218,597 | -3.22 | 6,645 | -7.50 | ||||
| 2025-08-06 | 13F | First Horizon Advisors, Inc. | 676 | 0.00 | 22 | 10.00 | ||||
| 2025-08-11 | 13F | Synergy Investment Management, LLC | 0 | -100.00 | 0 | |||||
| 2025-08-14 | 13F | Benjamin Edwards Inc | 45,491 | 21.57 | 1,503 | 32.10 | ||||
| 2025-07-07 | 13F | Thurston, Springer, Miller, Herd & Titak, Inc. | 1,065 | -21.98 | 35 | -14.63 | ||||
| 2025-08-14 | 13F | GWM Advisors LLC | 23,915 | 13.48 | 790 | 23.28 | ||||
| 2025-08-05 | 13F | Sigma Planning Corp | 0 | -100.00 | 0 | |||||
| 2025-07-29 | 13F | International Assets Investment Management, Llc | 9,688 | -0.41 | 320 | 8.14 | ||||
| 2025-08-05 | 13F | EPG Wealth Management LLC | 0 | -100.00 | 0 | -100.00 | ||||
| 2025-08-14 | 13F | Bank Of America Corp /de/ | 158,051 | -27.80 | 5,220 | -21.55 | ||||
| 2025-08-14 | 13F | Snowden Capital Advisors LLC | 32,942 | -6.42 | 1,088 | 1.68 | ||||
| 2025-07-10 | 13F | Wealth Enhancement Advisory Services, Llc | 11,781 | -12.60 | 409 | 0.00 | ||||
| 2025-08-07 | 13F | PFG Advisors | 65,703 | 22.56 | 2,170 | 33.21 | ||||
| 2025-07-25 | 13F | Cwm, Llc | 439 | 36.34 | 0 | |||||
| 2025-08-08 | 13F | Cetera Investment Advisers | 148,399 | 11.94 | 4,902 | 21.61 | ||||
| 2025-07-25 | 13F | Envestnet Portfolio Solutions, Inc. | 17,003 | -32.69 | 562 | -26.86 | ||||
| 2025-05-14 | 13F | Huntington National Bank | 2 | 0.00 | ||||||
| 2025-08-05 | 13F | Key FInancial Inc | 82 | 0.00 | 3 | 0.00 | ||||
| 2025-08-14 | 13F | Mml Investors Services, Llc | 12,002 | -19.76 | 0 | |||||
| 2025-07-30 | 13F | D.a. Davidson & Co. | 17,678 | 0.86 | 584 | 9.59 | ||||
| 2025-08-13 | 13F | Baird Financial Group, Inc. | 0 | -100.00 | 0 | |||||
| 2025-08-15 | 13F | Kestra Advisory Services, LLC | 60,839 | 6.26 | 2,009 | 15.46 | ||||
| 2025-07-17 | 13F | Sound Income Strategies, LLC | 0 | 0 | ||||||
| 2025-04-10 | 13F | Secure Asset Management, LLC | 0 | -100.00 | 0 | -100.00 | ||||
| 2025-08-12 | 13F | Global Retirement Partners, LLC | 6,413 | 758.50 | 212 | 817.39 | ||||
| 2025-08-04 | 13F | Atria Investments Llc | 31,134 | 9.67 | 1,028 | 19.12 | ||||
| 2025-07-14 | 13F | Park Avenue Securities Llc | 0 | -100.00 | 0 | |||||
| 2025-07-14 | 13F | Iams Wealth Management, Llc | 35,836 | -3.78 | 1,184 | 4.51 | ||||
| 2025-08-05 | 13F | GPS Wealth Strategies Group, LLC | 530 | 0.00 | 18 | 6.25 | ||||
| 2025-08-08 | 13F | Larson Financial Group LLC | 1,638 | 0.18 | 54 | 10.20 | ||||
| 2025-05-12 | 13F | Independent Advisor Alliance | 0 | -100.00 | 0 | |||||
| 2025-08-08 | 13F | Emerald Investment Partners, Llc | 440 | 0.00 | 15 | 7.69 | ||||
| 2025-08-01 | 13F | Rossby Financial, LCC | 348 | 3.26 | 11 | 22.22 | ||||
| 2025-05-14 | 13F | Jane Street Group, Llc | 0 | -100.00 | 0 | |||||
| 2025-08-14 | 13F | Two Sigma Investments, Lp | 45,100 | 1,490 | ||||||
| 2025-08-14 | 13F | Great Valley Advisor Group, Inc. | 9,479 | 4.18 | 313 | 13.41 | ||||
| 2025-08-06 | 13F | Decker Retirement Planning Inc. | 4 | 0.00 | 0 | |||||
| 2025-08-14 | 13F | Qube Research & Technologies Ltd | 46 | 0.00 | 2 | 0.00 | ||||
| 2025-08-13 | 13F | Alerus Financial Na | 450 | 15 |