Mga Batayang Estadistika
| Pemilik Institusional | 100 total, 100 long only, 0 short only, 0 long/short - change of -4.76% MRQ |
| Alokasi Portofolio Rata-rata | 0.1094 % - change of 0.04% MRQ |
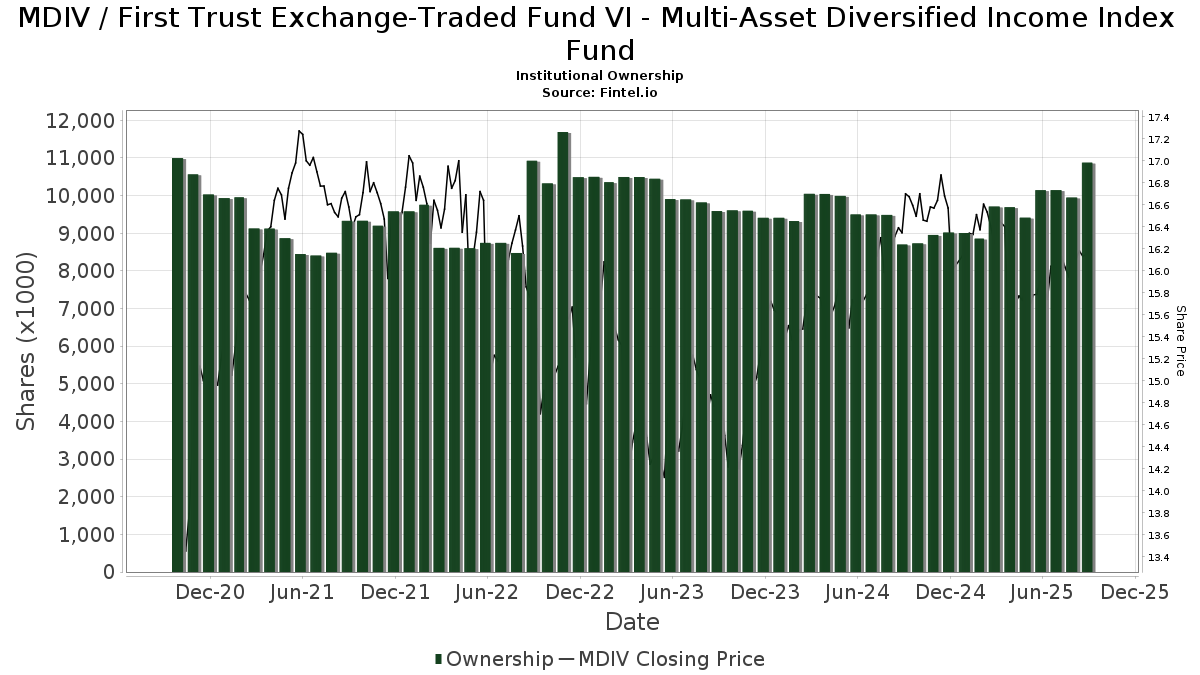
| Saham Institusional (Jangka Panjang) | 10,874,360 (ex 13D/G) - change of 0.73MM shares 7.20% MRQ |
| Nilai Institusional (Jangka Panjang) | $ 156,084 USD ($1000) |
Kepemilikan Institusional dan Pemegang Saham
First Trust Exchange-Traded Fund VI - Multi-Asset Diversified Income Index Fund (US:MDIV) memiliki 100 pemilik institusional dan pemegang saham yang telah mengajukan formulir 13D/G atau 13F kepada Komisi Bursa Efek (Securities Exchange Commission/SEC). Lembaga-lembaga ini memegang total 10,874,360 saham. Pemegang saham terbesar meliputi Flaharty Asset Management, LLC, Ameriprise Financial Inc, LPL Financial LLC, Morgan Stanley, Commonwealth Equity Services, Llc, Bank Of America Corp /de/, Harbour Investments, Inc., Wells Fargo & Company/mn, Royal Bank Of Canada, and Raymond James Financial Inc .
Struktur kepemilikan institusional First Trust Exchange-Traded Fund VI - Multi-Asset Diversified Income Index Fund (NasdaqGM:MDIV) menunjukkan posisi terkini di perusahaan oleh institusi dan dana, serta perubahan terbaru dalam ukuran posisi. Pemegang saham utama dapat mencakup investor individu, reksa dana, dana lindung nilai, atau institusi. Jadwal 13D menunjukkan bahwa investor memegang (atau pernah memegang) lebih dari 5% saham perusahaan dan bermaksud (atau pernah bermaksud) untuk secara aktif mengejar perubahan strategi bisnis. Jadwal 13G menunjukkan investasi pasif lebih dari 5%.
The share price as of September 5, 2025 is 16.21 / share. Previously, on September 9, 2024, the share price was 16.32 / share. This represents a decline of 0.67% over that period.
Skor Sentimen Dana
Skor Sentimen Dana (sebelumnya dikenal sebagai Skor Akumulasi Kepemilikan) menemukan saham-saham yang paling banyak dibeli oleh dana. Ini adalah hasil dari model kuantitatif multi-faktor yang canggih yang mengidentifikasi perusahaan dengan tingkat akumulasi institusional tertinggi. Model penilaian menggunakan kombinasi dari total peningkatan pemilik yang diungkapkan, perubahan dalam alokasi portofolio pada pemilik tersebut, dan metrik lainnya. Angka berkisar dari 0 hingga 100, dengan angka yang lebih tinggi menunjukkan tingkat akumulasi yang lebih tinggi dibandingkan dengan perusahaan sejenisnya, dan 50 adalah rata-ratanya.
Frekuensi Pembaruan: Setiap Hari
Lihat Ownership Explorer, yang menyediakan daftar perusahaan dengan peringkat tertinggi.
Rasio Put/Call Institusional
Selain melaporkan isu ekuitas dan utang standar, institusi dengan aset di bawah manajemen lebih dari 100 juta dolar AS juga harus mengungkapkan kepemilikan opsi put dan call mereka. Karena opsi put umumnya menunjukkan sentimen negatif, dan opsi call menunjukkan sentimen positif, kita dapat mengetahui sentimen institusional secara keseluruhan dengan memplot rasio put terhadap call. Grafik di sebelah kanan memplot rasio put/call historis untuk instrumen ini.
Menggunakan Rasio Put/Call sebagai indikator sentimen investor mengatasi salah satu kekurangan utama dari penggunaan total kepemilikan institusional, yaitu sejumlah besar aset yang dikelola diinvestasikan secara pasif untuk melacak indeks. Dana yang dikelola secara pasif biasanya tidak membeli opsi, sehingga indikator rasio put/call lebih akurat dalam melacak sentimen dana yang dikelola secara aktif.
Pengajuan 13F dan NPORT
Detail pada pengajuan 13F tersedia gratis. Detail pada pengajuan NP memerlukan keanggotaan premium. Baris berwarna hijau menunjukkan posisi baru. Baris berwarna merah menunjukkan posisi yang sudah ditutup. Klik tautan ini ikon untuk melihat riwayat transaksi selengkapnya.
Tingkatkan
untuk membuka data premium dan mengekspor ke Excel ![]() .
.
| Tanggal File | Sumber | Investor | Ketik | Presyo ng Avg (Silangan) |
Saham | Δ Saham (%) |
Dilaporkan Nilai ($1000) |
Nilai Δ (%) |
Alokasi Port (%) |
|
|---|---|---|---|---|---|---|---|---|---|---|
| 2025-08-11 | 13F | Aptus Capital Advisors, LLC | 20,470 | -6.43 | 324 | -9.52 | ||||
| 2025-07-29 | 13F | Kraft, Davis & Associates, LLC | 10,420 | 0.00 | 167 | 3.09 | ||||
| 2025-08-06 | 13F | Wedbush Securities Inc | 82,555 | 0.17 | 1 | 0.00 | ||||
| 2025-08-08 | 13F | Flaharty Asset Management, LLC | 1,611,174 | 2.52 | 25,473 | -0.88 | ||||
| 2025-08-14 | 13F | Icon Wealth Advisors, LLC | 7,946 | 1.26 | 126 | -2.34 | ||||
| 2025-07-25 | 13F | Stephens Consulting, LLC | 200 | 0.00 | 3 | 0.00 | ||||
| 2025-08-11 | 13F | Synergy Investment Management, LLC | 0 | -100.00 | 0 | |||||
| 2025-08-12 | 13F | LPL Financial LLC | 1,196,971 | 0.74 | 18,924 | -2.59 | ||||
| 2025-08-04 | 13F | Arbor Capital Management Inc /adv | 16,008 | 18.44 | 255 | 15.38 | ||||
| 2025-08-11 | 13F | Principal Securities, Inc. | 380 | -3.31 | 6 | 0.00 | ||||
| 2025-08-12 | 13F | Cornerstone Wealth Management, LLC | 57,839 | 1.17 | 914 | -2.14 | ||||
| 2025-08-14 | 13F | Wiley Bros.-aintree Capital, Llc | 48,042 | 760 | ||||||
| 2025-08-15 | 13F | Morgan Stanley | 863,071 | 0.32 | 13,645 | -3.00 | ||||
| 2025-08-11 | 13F | Citigroup Inc | 2,000 | 0.00 | 32 | -3.12 | ||||
| 2025-08-14 | 13F | Citadel Advisors Llc | 10,659 | -75.72 | 169 | -76.57 | ||||
| 2025-08-14 | 13F/A | Rockefeller Capital Management L.P. | 151,455 | 29.37 | 2,395 | 25.08 | ||||
| 2025-08-14 | 13F | Harvest Investment Services, LLC | 107,125 | 1.86 | 1,694 | -1.51 | ||||
| 2025-08-06 | 13F | Commonwealth Equity Services, Llc | 702,944 | -1.37 | 11 | 0.00 | ||||
| 2025-09-04 | 13F/A | Advisor Group Holdings, Inc. | 138,292 | -5.81 | 2,186 | -8.92 | ||||
| 2025-08-11 | 13F | Cornerstone Planning Group LLC | 328 | 1.86 | 5 | 0.00 | ||||
| 2025-08-14 | 13F | Guardian Wealth Advisors, Llc / Nc | 2,572 | 0.00 | 41 | -4.76 | ||||
| 2025-08-14 | 13F | Snowden Capital Advisors LLC | 11,803 | -0.01 | 187 | -3.63 | ||||
| 2025-07-07 | 13F | Thurston, Springer, Miller, Herd & Titak, Inc. | 1,441 | 1.62 | 23 | -4.35 | ||||
| 2025-08-14 | 13F | Bank Of America Corp /de/ | 530,942 | -2.15 | 8,394 | -5.39 | ||||
| 2025-08-19 | 13F | Advisory Services Network, LLC | 11,633 | 6.19 | 185 | 3.35 | ||||
| 2025-07-08 | 13F | Nbc Securities, Inc. | 2,438 | 0.00 | 0 | |||||
| 2025-07-31 | 13F | Cambridge Investment Research Advisors, Inc. | 149,886 | -13.37 | 2 | 0.00 | ||||
| 2025-08-04 | 13F | L.m. Kohn & Company | 0 | -100.00 | 0 | |||||
| 2025-08-08 | 13F | Pnc Financial Services Group, Inc. | 655 | 0.00 | 10 | 0.00 | ||||
| 2025-05-14 | 13F | Northwestern Mutual Wealth Management Co | 0 | -100.00 | 0 | |||||
| 2025-07-25 | 13F | Atria Wealth Solutions, Inc. | 26,605 | 0.44 | 421 | -3.00 | ||||
| 2025-05-13 | 13F | Thrivent Financial For Lutherans | 0 | -100.00 | 0 | |||||
| 2025-07-24 | 13F | IFP Advisors, Inc | 20,669 | -5.27 | 327 | -8.43 | ||||
| 2025-08-13 | 13F | Rockport Wealth LLC | 234,411 | 3.95 | 3,706 | 0.52 | ||||
| 2025-08-12 | 13F | Jaffetilchin Investment Partners, LLC | 41,925 | -2.65 | 663 | -5.97 | ||||
| 2025-08-14 | 13F | UBS Group AG | 73,456 | -1.84 | 1,161 | -5.07 | ||||
| 2025-05-12 | 13F | Independent Advisor Alliance | 0 | -100.00 | 0 | |||||
| 2025-07-28 | 13F | Harbour Investments, Inc. | 360,401 | 12.98 | 5,698 | 9.22 | ||||
| 2025-08-08 | 13F | Fortis Group Advisors, LLC | 51,095 | 814 | ||||||
| 2025-08-06 | 13F | Prospera Financial Services Inc | 15,508 | 245 | ||||||
| 2025-08-18 | 13F/A | National Bank Of Canada /fi/ | 1,543 | 0.00 | 24 | -4.00 | ||||
| 2025-07-11 | 13F | Farther Finance Advisors, LLC | 15,522 | -8.03 | 245 | -11.23 | ||||
| 2025-08-13 | 13F | RPg Family Wealth Advisory, LLC | 20,450 | 0.00 | 323 | -3.29 | ||||
| 2025-08-08 | 13F | Larson Financial Group LLC | 36,835 | -1.34 | 582 | -4.59 | ||||
| 2025-08-14 | 13F | Raymond James Financial Inc | 280,114 | -0.49 | 4,429 | -3.80 | ||||
| 2025-07-21 | 13F | Ameritas Advisory Services, LLC | 22,208 | -3.19 | 351 | -5.14 | ||||
| 2025-07-25 | 13F | Endowment Wealth Management, Inc. | 38,716 | 10.63 | 612 | 6.99 | ||||
| 2025-08-14 | 13F | Comerica Bank | 11,394 | 0.00 | 180 | -3.23 | ||||
| 2025-07-11 | 13F | Pinnacle Bancorp, Inc. | 1,000 | 0.00 | 16 | -6.25 | ||||
| 2025-08-13 | 13F | StoneX Group Inc. | 11,993 | -32.17 | 190 | -34.60 | ||||
| 2025-08-08 | 13F | Capital Investment Advisory Services, LLC | 200,879 | -8.08 | 3,176 | -11.14 | ||||
| 2025-07-16 | 13F | ORG Partners LLC | 5,000 | 0.00 | 80 | -3.66 | ||||
| 2025-07-18 | 13F | Truist Financial Corp | 23,300 | -21.42 | 368 | -23.97 | ||||
| 2025-08-13 | 13F | Millstone Evans Group, LLC | 310 | 0.00 | 5 | -20.00 | ||||
| 2025-07-31 | 13F | Moloney Securities Asset Management, LLC | 0 | -100.00 | 0 | |||||
| 2025-07-29 | 13F | Elevation Capital Advisory, LLC | 0 | -100.00 | 0 | |||||
| 2025-08-13 | 13F | Jones Financial Companies Lllp | 57,483 | 11.07 | 906 | 7.35 | ||||
| 2025-08-14 | 13F | Wells Fargo & Company/mn | 353,567 | -16.86 | 5,590 | -19.63 | ||||
| 2025-07-17 | 13F | Sound Income Strategies, LLC | 0 | -100.00 | 0 | |||||
| 2025-08-12 | 13F | Park Square Financial Group, LLC | 278 | 0.00 | 4 | 0.00 | ||||
| 2025-07-17 | 13F | Janney Montgomery Scott LLC | 51,001 | -13.00 | 1 | |||||
| 2025-08-18 | 13F | Geneos Wealth Management Inc. | 2,515 | 0.00 | 40 | -4.88 | ||||
| 2025-08-14 | 13F | Stifel Financial Corp | 60,756 | -0.16 | 961 | -3.52 | ||||
| 2025-07-21 | 13F | DHJJ Financial Advisors, Ltd. | 30 | 0.00 | 0 | |||||
| 2025-07-03 | 13F | TrueWealth Advisors, LLC | 53,350 | -21.01 | 843 | -23.64 | ||||
| 2025-08-18 | 13F | Second Line Capital, LLC | 17,898 | -7.29 | 283 | -10.48 | ||||
| 2025-08-12 | 13F | PSI Advisors, LLC | 32,851 | 47.61 | 519 | 42.98 | ||||
| 2025-08-19 | 13F | Newbridge Financial Services Group, Inc. | 2,536 | -45.05 | 40 | -46.67 | ||||
| 2025-08-06 | 13F | AE Wealth Management LLC | 0 | -100.00 | 0 | |||||
| 2025-08-12 | 13F | Jpmorgan Chase & Co | 1,000 | 16 | ||||||
| 2025-08-14 | 13F | Susquehanna International Group, Llp | 0 | -100.00 | 0 | |||||
| 2025-08-14 | 13F | Freedom Financial Partners LLC | 33,832 | -3.88 | 535 | -7.13 | ||||
| 2025-05-12 | 13F | Richard W. Paul & Associates, LLC | 0 | -100.00 | 0 | |||||
| 2025-08-11 | 13F | HighTower Advisors, LLC | 32,014 | -11.44 | 506 | -14.38 | ||||
| 2025-08-08 | 13F | Intrua Financial, LLC | 25,495 | 0.00 | 403 | -3.12 | ||||
| 2025-07-23 | 13F | Tcfg Wealth Management, Llc | 61,357 | 0.21 | 970 | -3.10 | ||||
| 2025-08-05 | 13F | Sigma Planning Corp | 50,786 | -31.04 | 803 | -33.39 | ||||
| 2025-08-12 | 13F | MAI Capital Management | 6,094 | -3.05 | 96 | -5.88 | ||||
| 2025-08-13 | 13F | Baird Financial Group, Inc. | 14,134 | 17.78 | 223 | 13.78 | ||||
| 2025-08-04 | 13F | IFG Advisory, LLC | 0 | -100.00 | 0 | |||||
| 2025-08-12 | 13F | Steward Partners Investment Advisory, Llc | 1,898 | -0.68 | 30 | -3.23 | ||||
| 2025-08-14 | 13F | Fmr Llc | 197 | 3 | ||||||
| 2025-08-11 | 13F | Private Advisor Group, LLC | 53,774 | -4.50 | 850 | -7.61 | ||||
| 2025-08-14 | 13F | Royal Bank Of Canada | 344,627 | 4.17 | 5,449 | 0.72 | ||||
| 2025-07-24 | 13F | Us Bancorp \de\ | 1,800 | 0.00 | 28 | -3.45 | ||||
| 2025-08-14 | 13F | GWM Advisors LLC | 17,310 | 3.56 | 274 | 0.00 | ||||
| 2025-08-01 | 13F | Envestnet Asset Management Inc | 45,202 | -24.10 | 715 | -26.62 | ||||
| 2025-07-29 | 13F | Huntleigh Advisors, Inc. | 10,051 | 0.14 | 159 | -3.66 | ||||
| 2025-08-14 | 13F | Ameriprise Financial Inc | 1,538,244 | 147.05 | 24,348 | 139.15 | ||||
| 2025-04-17 | 13F | Authentikos Wealth Advisory, LLC | 0 | -100.00 | 0 | |||||
| 2025-07-10 | 13F | Wealth Enhancement Advisory Services, Llc | 19,764 | 0.38 | 317 | -1.56 | ||||
| 2025-07-29 | 13F | Cottonwood Capital Advisors, Llc | 66,592 | -0.02 | 1,053 | -3.40 | ||||
| 2025-05-09 | 13F | GeoWealth Management, LLC | 0 | -100.00 | 0 | |||||
| 2025-07-16 | 13F/A | CX Institutional | 851 | -0.23 | 0 | |||||
| 2025-08-08 | 13F | Cetera Investment Advisers | 269,657 | 5.74 | 4,263 | 2.23 | ||||
| 2025-08-12 | 13F | Global Retirement Partners, LLC | 7,778 | 0.00 | 123 | -2.40 | ||||
| 2025-08-12 | 13F | Founders Financial Alliance, LLC | 2,252 | 1.30 | 36 | -2.78 | ||||
| 2025-05-13 | 13F | EPG Wealth Management LLC | 0 | -100.00 | 0 | -100.00 | ||||
| 2025-08-14 | 13F | Smartleaf Asset Management LLC | 7 | 0.00 | 0 | |||||
| 2025-07-25 | 13F | Concurrent Investment Advisors, LLC | 38,941 | 19.46 | 616 | 15.38 | ||||
| 2025-08-12 | 13F | Proequities, Inc. | 0 | 0 | ||||||
| 2025-08-13 | 13F | Keystone Financial Group | 17,389 | -0.70 | 275 | -4.20 | ||||
| 2025-07-25 | 13F | Total Clarity Wealth Management, Inc. | 56,800 | 898 | ||||||
| 2025-07-29 | 13F | International Assets Investment Management, Llc | 47,205 | 102.79 | 746 | 96.32 | ||||
| 2025-07-25 | 13F | Cwm, Llc | 100 | 0.00 | 0 | |||||
| 2025-08-05 | 13F | GPS Wealth Strategies Group, LLC | 3,012 | 0.00 | 48 | -4.08 | ||||
| 2025-08-12 | 13F | SRS Capital Advisors, Inc. | 300 | 0.00 | 5 | 0.00 | ||||
| 2025-07-22 | 13F | Coastal Investment Advisors, Inc. | 0 | -100.00 | 0 | |||||
| 2025-07-29 | 13F | Stratos Wealth Partners, LTD. | 22,233 | 45.62 | 352 | 40.96 | ||||
| 2025-08-05 | 13F | Bank Of Montreal /can/ | 400 | 0.00 | 6 | 0.00 | ||||
| 2025-08-13 | 13F | Proactive Wealth Strategies LLC | 15,400 | 0.00 | 0 | |||||
| 2025-07-23 | 13F | Bellevue Asset Management, Llc | 1,169 | -12.63 | 18 | -14.29 | ||||
| 2025-08-06 | 13F | Cherry Creek Investment Advisors, Inc. | 0 | -100.00 | 0 | |||||
| 2025-05-05 | 13F | Transce3nd, LLC | 0 | -100.00 | 0 | |||||
| 2025-07-15 | 13F | Elevated Capital Advisors, LLC | 72,300 | 0.00 | 1,182 | 0.00 | ||||
| 2025-08-01 | 13F | Bessemer Group Inc | 150 | -98.36 | 0 | |||||
| 2025-08-13 | 13F | EverSource Wealth Advisors, LLC | 196 | 18.79 | 3 | 50.00 | ||||
| 2025-08-14 | 13F | CoreCap Advisors, LLC | 800 | 0.00 | 13 | -7.69 | ||||
| 2025-08-15 | 13F | Kestra Advisory Services, LLC | 128,401 | 3.82 | 2,030 | 0.40 |
Other Listings
| MX:MDIV |